

Key Insights
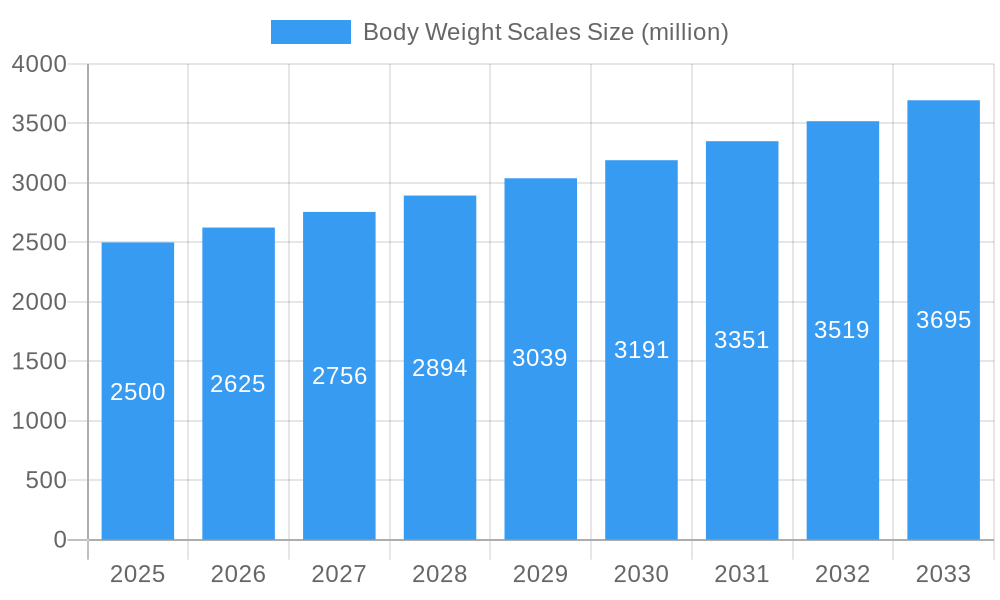
The global body weight scales market is experiencing robust growth, driven by increasing health consciousness and the rising prevalence of obesity and related diseases. The market, estimated at $2.5 billion in 2025, is projected to exhibit a Compound Annual Growth Rate (CAGR) of 5% from 2025 to 2033, reaching an estimated $3.5 billion by 2033. This growth is fueled by several key factors, including the increasing affordability of smart scales with advanced features like body composition analysis (measuring muscle mass, bone density, and body fat percentage), integration with health and fitness apps, and rising demand for convenient at-home health monitoring solutions. Technological advancements, such as Bluetooth connectivity and integration with popular health apps, are further contributing to market expansion. Major players like Tanita, Taylor, Weight Watchers, Withings, and Seca are driving innovation through the introduction of sophisticated scales with enhanced functionalities and user-friendly interfaces. However, market growth may face certain restraints, including price sensitivity among consumers and the potential for inaccuracies in certain measurement technologies.
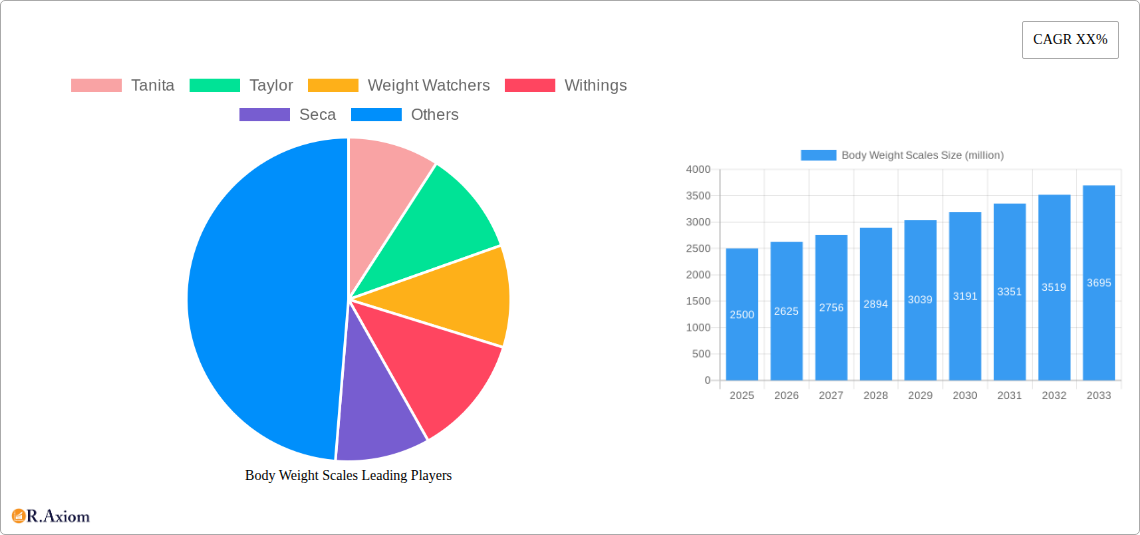
Body Weight Scales Market Size (In Billion)
Despite these restraints, the market's future prospects remain optimistic. The growing adoption of preventative healthcare measures and the expanding availability of connected health devices will continue to fuel demand. The market segmentation, while not fully specified, likely includes categories based on technology (analog, digital, smart), features (body composition analysis, connectivity), and price point. Regional variations in market penetration are expected, with developed regions like North America and Europe currently holding significant market share, but emerging economies in Asia and Latin America exhibiting strong growth potential. The continued focus on personalized health and wellness is poised to drive adoption of technologically advanced body weight scales in the coming years. Manufacturers are likely to focus on improving accuracy, expanding features, and integrating seamlessly with existing health ecosystems to maintain a competitive edge.
Body Weight Scales Company Market Share
Body Weight Scales Market Report: 2019-2033
This comprehensive report provides a detailed analysis of the global body weight scales market, offering invaluable insights for industry stakeholders, investors, and market entrants. The study period spans from 2019 to 2033, with 2025 serving as the base and estimated year. The forecast period covers 2025-2033, while the historical period encompasses 2019-2024. The report meticulously examines market concentration, innovation, trends, dominant segments, product developments, and future outlook, incorporating data on key players like Tanita, Taylor, Weight Watchers, Withings, and Seca. The report projects a market value exceeding $xx million by 2033, with a CAGR of xx% during the forecast period.
Body Weight Scales Market Concentration & Innovation
The global body weight scales market exhibits a moderately concentrated landscape, with a few major players holding significant market share. Tanita, Taylor, and Withings collectively account for approximately xx% of the market, while smaller players contribute to the remaining share. Innovation is driven by advancements in sensor technology, connectivity features (Bluetooth, Wi-Fi), and data analytics capabilities, leading to the emergence of smart scales that integrate with health and fitness apps. Regulatory frameworks, particularly concerning data privacy and accuracy standards, significantly influence market dynamics. Product substitutes, such as body composition analyzers and fitness trackers with weight-tracking functionalities, exert competitive pressure. End-user trends show a growing preference for smart, connected scales offering personalized health insights. Mergers and acquisitions (M&A) activity in the sector has been moderate, with deal values averaging $xx million over the past five years, primarily involving smaller players being acquired by larger companies to expand product portfolios.
Body Weight Scales Industry Trends & Insights
The body weight scales market is experiencing robust growth, driven by increasing health consciousness, rising obesity rates globally, and the growing adoption of wearable technology and connected health solutions. The market’s CAGR during the historical period (2019-2024) was xx%, and it is projected to reach xx% during the forecast period (2025-2033). Technological disruptions, primarily from the integration of smart features and data analytics, are significantly impacting market dynamics. Consumer preferences increasingly favor smart scales with features beyond basic weight measurement, such as body fat percentage, BMI calculation, and integration with health apps. Competitive dynamics are shaped by the continuous introduction of innovative features, price competition, and branding strategies. Market penetration of smart scales is steadily increasing, with projections indicating that they will account for xx% of total sales by 2033. The overall market is expected to surpass $xx million by 2033.
Dominant Markets & Segments in Body Weight Scales
The North American market currently holds the dominant position in the global body weight scales market, accounting for xx% of global revenue in 2025. This dominance is attributed to several factors:
- High disposable incomes: A significant portion of the population has the financial capacity to purchase higher-priced smart scales.
- Technological advancement: The region is a hub for technological innovation, leading to the early adoption of smart scales and connected health solutions.
- Strong health awareness: A focus on wellness and preventative healthcare fuels demand for health-monitoring devices, including body weight scales.
Further analysis reveals that the home segment represents the largest market share within the body weight scales sector, significantly exceeding the commercial segment in terms of revenue generation. This dominance stems from the broader consumer base for home usage.
Body Weight Scales Product Developments
Recent product developments in the body weight scales market are primarily centered around incorporating advanced sensor technology for more precise measurements and integrating connectivity features like Bluetooth and Wi-Fi for seamless data syncing with mobile apps. Smart scales now offer diverse functionalities beyond basic weight measurement, including body fat percentage, muscle mass, bone mass, and water content analysis. These innovative features cater to the rising demand for personalized health data and tailored wellness solutions, providing a competitive advantage to manufacturers.
Report Scope & Segmentation Analysis
This report segments the body weight scales market based on several key parameters including:
By Product Type: Analog scales, digital scales, smart scales (further categorized by features, like Bluetooth, Wi-Fi connectivity, and app integration). Digital scales currently dominate the market, however, the smart scale segment is projected to witness the highest growth rate during the forecast period.
By Application: Home use, commercial use (gyms, clinics, etc.). The home use segment holds a significant market share, driven by increased health consciousness among consumers.
By Distribution Channel: Online retailers, physical stores, direct sales. Online sales are steadily growing due to the increasing e-commerce penetration.
Key Drivers of Body Weight Scales Growth
Several factors drive the growth of the body weight scales market:
- Rising health consciousness and obesity rates: Globally increasing awareness of weight management and related health risks is a key driver.
- Technological advancements: Integration of smart features and connected health solutions significantly enhances user experience and market appeal.
- Government initiatives: Public health campaigns and initiatives aimed at promoting healthy lifestyles indirectly boost market demand.
Challenges in the Body Weight Scales Sector
The body weight scales sector faces several challenges:
- Intense competition: The market is crowded, necessitating constant innovation and competitive pricing strategies.
- Data privacy concerns: Concerns related to the collection and use of personal health data need to be addressed.
- Technological obsolescence: Rapid advancements in sensor and connectivity technologies can lead to rapid product obsolescence.
Emerging Opportunities in Body Weight Scales
Several emerging trends offer exciting opportunities:
- Expansion into emerging markets: Significant growth potential exists in developing economies with increasing health consciousness and rising disposable incomes.
- Integration with other health and fitness devices: Synergies with wearables and health apps provide further market expansion.
- Advanced analytics and personalized health insights: Providing users with more tailored recommendations based on their data can enhance market penetration.
Leading Players in the Body Weight Scales Market
Key Developments in Body Weight Scales Industry
- January 2023: Withings launched a new smart scale with advanced body composition analysis.
- June 2022: Tanita introduced a scale with improved accuracy and connectivity features.
- October 2021: Taylor expanded its product portfolio with a range of affordable digital scales.
Strategic Outlook for Body Weight Scales Market
The future of the body weight scales market looks promising, with continued growth driven by technological innovations, rising health consciousness, and expansion into new markets. Smart scales, with their advanced features and connectivity, are expected to dominate the market, attracting both individual consumers and healthcare professionals. Companies focusing on data security and user privacy, while continuously innovating to enhance the user experience, are poised for significant success in the years to come.
Body Weight Scales Segmentation
-
1. Application
- 1.1. Hospital
- 1.2. Family
- 1.3. Gym
- 1.4. Others
-
2. Types
- 2.1. Toughened Glass
- 2.2. Plastic
- 2.3. Others
Body Weight Scales Segmentation By Geography
-
1. North America
- 1.1. United States
- 1.2. Canada
- 1.3. Mexico
-
2. South America
- 2.1. Brazil
- 2.2. Argentina
- 2.3. Rest of South America
-
3. Europe
- 3.1. United Kingdom
- 3.2. Germany
- 3.3. France
- 3.4. Italy
- 3.5. Spain
- 3.6. Russia
- 3.7. Benelux
- 3.8. Nordics
- 3.9. Rest of Europe
-
4. Middle East & Africa
- 4.1. Turkey
- 4.2. Israel
- 4.3. GCC
- 4.4. North Africa
- 4.5. South Africa
- 4.6. Rest of Middle East & Africa
-
5. Asia Pacific
- 5.1. China
- 5.2. India
- 5.3. Japan
- 5.4. South Korea
- 5.5. ASEAN
- 5.6. Oceania
- 5.7. Rest of Asia Pacific

Body Weight Scales Regional Market Share
Geographic Coverage of Body Weight Scales
Body Weight Scales REPORT HIGHLIGHTS
| Aspects | Details |
|---|---|
| Study Period | 2020-2034 |
| Base Year | 2025 |
| Estimated Year | 2026 |
| Forecast Period | 2026-2034 |
| Historical Period | 2020-2025 |
| Growth Rate | CAGR of XX% from 2020-2034 |
| Segmentation |
|
Table of Contents
- 1. Introduction
- 1.1. Research Scope
- 1.2. Market Segmentation
- 1.3. Research Objective
- 1.4. Definitions and Assumptions
- 2. Executive Summary
- 2.1. Market Snapshot
- 3. Market Dynamics
- 3.1. Market Drivers
- 3.2. Market Restrains
- 3.3. Market Trends
- 3.4. Market Opportunities
- 4. Market Factor Analysis
- 4.1. Porters Five Forces
- 4.1.1. Bargaining Power of Suppliers
- 4.1.2. Bargaining Power of Buyers
- 4.1.3. Threat of New Entrants
- 4.1.4. Threat of Substitutes
- 4.1.5. Competitive Rivalry
- 4.2. PESTEL analysis
- 4.3. BCG Analysis
- 4.3.1. Stars (High Growth, High Market Share)
- 4.3.2. Cash Cows (Low Growth, High Market Share)
- 4.3.3. Question Mark (High Growth, Low Market Share)
- 4.3.4. Dogs (Low Growth, Low Market Share)
- 4.4. Ansoff Matrix Analysis
- 4.5. Supply Chain Analysis
- 4.6. Regulatory Landscape
- 4.7. Current Market Potential and Opportunity Assessment (TAM–SAM–SOM Framework)
- 4.8. RAX Analyst Note
- 4.1. Porters Five Forces
- 5. Market Analysis, Insights and Forecast 2021-2033
- 5.1. Market Analysis, Insights and Forecast - by Application
- 5.1.1. Hospital
- 5.1.2. Family
- 5.1.3. Gym
- 5.1.4. Others
- 5.2. Market Analysis, Insights and Forecast - by Types
- 5.2.1. Toughened Glass
- 5.2.2. Plastic
- 5.2.3. Others
- 5.3. Market Analysis, Insights and Forecast - by Region
- 5.3.1. North America
- 5.3.2. South America
- 5.3.3. Europe
- 5.3.4. Middle East & Africa
- 5.3.5. Asia Pacific
- 5.1. Market Analysis, Insights and Forecast - by Application
- 6. Global Body Weight Scales Analysis, Insights and Forecast, 2021-2033
- 6.1. Market Analysis, Insights and Forecast - by Application
- 6.1.1. Hospital
- 6.1.2. Family
- 6.1.3. Gym
- 6.1.4. Others
- 6.2. Market Analysis, Insights and Forecast - by Types
- 6.2.1. Toughened Glass
- 6.2.2. Plastic
- 6.2.3. Others
- 6.1. Market Analysis, Insights and Forecast - by Application
- 7. North America Body Weight Scales Analysis, Insights and Forecast, 2020-2032
- 7.1. Market Analysis, Insights and Forecast - by Application
- 7.1.1. Hospital
- 7.1.2. Family
- 7.1.3. Gym
- 7.1.4. Others
- 7.2. Market Analysis, Insights and Forecast - by Types
- 7.2.1. Toughened Glass
- 7.2.2. Plastic
- 7.2.3. Others
- 7.1. Market Analysis, Insights and Forecast - by Application
- 8. South America Body Weight Scales Analysis, Insights and Forecast, 2020-2032
- 8.1. Market Analysis, Insights and Forecast - by Application
- 8.1.1. Hospital
- 8.1.2. Family
- 8.1.3. Gym
- 8.1.4. Others
- 8.2. Market Analysis, Insights and Forecast - by Types
- 8.2.1. Toughened Glass
- 8.2.2. Plastic
- 8.2.3. Others
- 8.1. Market Analysis, Insights and Forecast - by Application
- 9. Europe Body Weight Scales Analysis, Insights and Forecast, 2020-2032
- 9.1. Market Analysis, Insights and Forecast - by Application
- 9.1.1. Hospital
- 9.1.2. Family
- 9.1.3. Gym
- 9.1.4. Others
- 9.2. Market Analysis, Insights and Forecast - by Types
- 9.2.1. Toughened Glass
- 9.2.2. Plastic
- 9.2.3. Others
- 9.1. Market Analysis, Insights and Forecast - by Application
- 10. Middle East & Africa Body Weight Scales Analysis, Insights and Forecast, 2020-2032
- 10.1. Market Analysis, Insights and Forecast - by Application
- 10.1.1. Hospital
- 10.1.2. Family
- 10.1.3. Gym
- 10.1.4. Others
- 10.2. Market Analysis, Insights and Forecast - by Types
- 10.2.1. Toughened Glass
- 10.2.2. Plastic
- 10.2.3. Others
- 10.1. Market Analysis, Insights and Forecast - by Application
- 11. Asia Pacific Body Weight Scales Analysis, Insights and Forecast, 2020-2032
- 11.1. Market Analysis, Insights and Forecast - by Application
- 11.1.1. Hospital
- 11.1.2. Family
- 11.1.3. Gym
- 11.1.4. Others
- 11.2. Market Analysis, Insights and Forecast - by Types
- 11.2.1. Toughened Glass
- 11.2.2. Plastic
- 11.2.3. Others
- 11.1. Market Analysis, Insights and Forecast - by Application
- 12. Competitive Analysis
- 12.1. Company Profiles
- 12.1.1 Tanita
- 12.1.1.1. Company Overview
- 12.1.1.2. Products
- 12.1.1.3. Company Financials
- 12.1.1.4. SWOT Analysis
- 12.1.2 Taylor
- 12.1.2.1. Company Overview
- 12.1.2.2. Products
- 12.1.2.3. Company Financials
- 12.1.2.4. SWOT Analysis
- 12.1.3 Weight Watchers
- 12.1.3.1. Company Overview
- 12.1.3.2. Products
- 12.1.3.3. Company Financials
- 12.1.3.4. SWOT Analysis
- 12.1.4 Withings
- 12.1.4.1. Company Overview
- 12.1.4.2. Products
- 12.1.4.3. Company Financials
- 12.1.4.4. SWOT Analysis
- 12.1.5 Seca
- 12.1.5.1. Company Overview
- 12.1.5.2. Products
- 12.1.5.3. Company Financials
- 12.1.5.4. SWOT Analysis
- 12.1.1 Tanita
- 12.2. Market Entropy
- 12.2.1 Company's Key Areas Served
- 12.2.2 Recent Developments
- 12.3. Company Market Share Analysis 2025
- 12.3.1 Top 5 Companies Market Share Analysis
- 12.3.2 Top 3 Companies Market Share Analysis
- 12.4. List of Potential Customers
- 13. Research Methodology
List of Figures
- Figure 1: Global Body Weight Scales Revenue Breakdown (million, %) by Region 2025 & 2033
- Figure 2: Global Body Weight Scales Volume Breakdown (K, %) by Region 2025 & 2033
- Figure 3: North America Body Weight Scales Revenue (million), by Application 2025 & 2033
- Figure 4: North America Body Weight Scales Volume (K), by Application 2025 & 2033
- Figure 5: North America Body Weight Scales Revenue Share (%), by Application 2025 & 2033
- Figure 6: North America Body Weight Scales Volume Share (%), by Application 2025 & 2033
- Figure 7: North America Body Weight Scales Revenue (million), by Types 2025 & 2033
- Figure 8: North America Body Weight Scales Volume (K), by Types 2025 & 2033
- Figure 9: North America Body Weight Scales Revenue Share (%), by Types 2025 & 2033
- Figure 10: North America Body Weight Scales Volume Share (%), by Types 2025 & 2033
- Figure 11: North America Body Weight Scales Revenue (million), by Country 2025 & 2033
- Figure 12: North America Body Weight Scales Volume (K), by Country 2025 & 2033
- Figure 13: North America Body Weight Scales Revenue Share (%), by Country 2025 & 2033
- Figure 14: North America Body Weight Scales Volume Share (%), by Country 2025 & 2033
- Figure 15: South America Body Weight Scales Revenue (million), by Application 2025 & 2033
- Figure 16: South America Body Weight Scales Volume (K), by Application 2025 & 2033
- Figure 17: South America Body Weight Scales Revenue Share (%), by Application 2025 & 2033
- Figure 18: South America Body Weight Scales Volume Share (%), by Application 2025 & 2033
- Figure 19: South America Body Weight Scales Revenue (million), by Types 2025 & 2033
- Figure 20: South America Body Weight Scales Volume (K), by Types 2025 & 2033
- Figure 21: South America Body Weight Scales Revenue Share (%), by Types 2025 & 2033
- Figure 22: South America Body Weight Scales Volume Share (%), by Types 2025 & 2033
- Figure 23: South America Body Weight Scales Revenue (million), by Country 2025 & 2033
- Figure 24: South America Body Weight Scales Volume (K), by Country 2025 & 2033
- Figure 25: South America Body Weight Scales Revenue Share (%), by Country 2025 & 2033
- Figure 26: South America Body Weight Scales Volume Share (%), by Country 2025 & 2033
- Figure 27: Europe Body Weight Scales Revenue (million), by Application 2025 & 2033
- Figure 28: Europe Body Weight Scales Volume (K), by Application 2025 & 2033
- Figure 29: Europe Body Weight Scales Revenue Share (%), by Application 2025 & 2033
- Figure 30: Europe Body Weight Scales Volume Share (%), by Application 2025 & 2033
- Figure 31: Europe Body Weight Scales Revenue (million), by Types 2025 & 2033
- Figure 32: Europe Body Weight Scales Volume (K), by Types 2025 & 2033
- Figure 33: Europe Body Weight Scales Revenue Share (%), by Types 2025 & 2033
- Figure 34: Europe Body Weight Scales Volume Share (%), by Types 2025 & 2033
- Figure 35: Europe Body Weight Scales Revenue (million), by Country 2025 & 2033
- Figure 36: Europe Body Weight Scales Volume (K), by Country 2025 & 2033
- Figure 37: Europe Body Weight Scales Revenue Share (%), by Country 2025 & 2033
- Figure 38: Europe Body Weight Scales Volume Share (%), by Country 2025 & 2033
- Figure 39: Middle East & Africa Body Weight Scales Revenue (million), by Application 2025 & 2033
- Figure 40: Middle East & Africa Body Weight Scales Volume (K), by Application 2025 & 2033
- Figure 41: Middle East & Africa Body Weight Scales Revenue Share (%), by Application 2025 & 2033
- Figure 42: Middle East & Africa Body Weight Scales Volume Share (%), by Application 2025 & 2033
- Figure 43: Middle East & Africa Body Weight Scales Revenue (million), by Types 2025 & 2033
- Figure 44: Middle East & Africa Body Weight Scales Volume (K), by Types 2025 & 2033
- Figure 45: Middle East & Africa Body Weight Scales Revenue Share (%), by Types 2025 & 2033
- Figure 46: Middle East & Africa Body Weight Scales Volume Share (%), by Types 2025 & 2033
- Figure 47: Middle East & Africa Body Weight Scales Revenue (million), by Country 2025 & 2033
- Figure 48: Middle East & Africa Body Weight Scales Volume (K), by Country 2025 & 2033
- Figure 49: Middle East & Africa Body Weight Scales Revenue Share (%), by Country 2025 & 2033
- Figure 50: Middle East & Africa Body Weight Scales Volume Share (%), by Country 2025 & 2033
- Figure 51: Asia Pacific Body Weight Scales Revenue (million), by Application 2025 & 2033
- Figure 52: Asia Pacific Body Weight Scales Volume (K), by Application 2025 & 2033
- Figure 53: Asia Pacific Body Weight Scales Revenue Share (%), by Application 2025 & 2033
- Figure 54: Asia Pacific Body Weight Scales Volume Share (%), by Application 2025 & 2033
- Figure 55: Asia Pacific Body Weight Scales Revenue (million), by Types 2025 & 2033
- Figure 56: Asia Pacific Body Weight Scales Volume (K), by Types 2025 & 2033
- Figure 57: Asia Pacific Body Weight Scales Revenue Share (%), by Types 2025 & 2033
- Figure 58: Asia Pacific Body Weight Scales Volume Share (%), by Types 2025 & 2033
- Figure 59: Asia Pacific Body Weight Scales Revenue (million), by Country 2025 & 2033
- Figure 60: Asia Pacific Body Weight Scales Volume (K), by Country 2025 & 2033
- Figure 61: Asia Pacific Body Weight Scales Revenue Share (%), by Country 2025 & 2033
- Figure 62: Asia Pacific Body Weight Scales Volume Share (%), by Country 2025 & 2033
List of Tables
- Table 1: Global Body Weight Scales Revenue million Forecast, by Application 2020 & 2033
- Table 2: Global Body Weight Scales Volume K Forecast, by Application 2020 & 2033
- Table 3: Global Body Weight Scales Revenue million Forecast, by Types 2020 & 2033
- Table 4: Global Body Weight Scales Volume K Forecast, by Types 2020 & 2033
- Table 5: Global Body Weight Scales Revenue million Forecast, by Region 2020 & 2033
- Table 6: Global Body Weight Scales Volume K Forecast, by Region 2020 & 2033
- Table 7: Global Body Weight Scales Revenue million Forecast, by Application 2020 & 2033
- Table 8: Global Body Weight Scales Volume K Forecast, by Application 2020 & 2033
- Table 9: Global Body Weight Scales Revenue million Forecast, by Types 2020 & 2033
- Table 10: Global Body Weight Scales Volume K Forecast, by Types 2020 & 2033
- Table 11: Global Body Weight Scales Revenue million Forecast, by Country 2020 & 2033
- Table 12: Global Body Weight Scales Volume K Forecast, by Country 2020 & 2033
- Table 13: United States Body Weight Scales Revenue (million) Forecast, by Application 2020 & 2033
- Table 14: United States Body Weight Scales Volume (K) Forecast, by Application 2020 & 2033
- Table 15: Canada Body Weight Scales Revenue (million) Forecast, by Application 2020 & 2033
- Table 16: Canada Body Weight Scales Volume (K) Forecast, by Application 2020 & 2033
- Table 17: Mexico Body Weight Scales Revenue (million) Forecast, by Application 2020 & 2033
- Table 18: Mexico Body Weight Scales Volume (K) Forecast, by Application 2020 & 2033
- Table 19: Global Body Weight Scales Revenue million Forecast, by Application 2020 & 2033
- Table 20: Global Body Weight Scales Volume K Forecast, by Application 2020 & 2033
- Table 21: Global Body Weight Scales Revenue million Forecast, by Types 2020 & 2033
- Table 22: Global Body Weight Scales Volume K Forecast, by Types 2020 & 2033
- Table 23: Global Body Weight Scales Revenue million Forecast, by Country 2020 & 2033
- Table 24: Global Body Weight Scales Volume K Forecast, by Country 2020 & 2033
- Table 25: Brazil Body Weight Scales Revenue (million) Forecast, by Application 2020 & 2033
- Table 26: Brazil Body Weight Scales Volume (K) Forecast, by Application 2020 & 2033
- Table 27: Argentina Body Weight Scales Revenue (million) Forecast, by Application 2020 & 2033
- Table 28: Argentina Body Weight Scales Volume (K) Forecast, by Application 2020 & 2033
- Table 29: Rest of South America Body Weight Scales Revenue (million) Forecast, by Application 2020 & 2033
- Table 30: Rest of South America Body Weight Scales Volume (K) Forecast, by Application 2020 & 2033
- Table 31: Global Body Weight Scales Revenue million Forecast, by Application 2020 & 2033
- Table 32: Global Body Weight Scales Volume K Forecast, by Application 2020 & 2033
- Table 33: Global Body Weight Scales Revenue million Forecast, by Types 2020 & 2033
- Table 34: Global Body Weight Scales Volume K Forecast, by Types 2020 & 2033
- Table 35: Global Body Weight Scales Revenue million Forecast, by Country 2020 & 2033
- Table 36: Global Body Weight Scales Volume K Forecast, by Country 2020 & 2033
- Table 37: United Kingdom Body Weight Scales Revenue (million) Forecast, by Application 2020 & 2033
- Table 38: United Kingdom Body Weight Scales Volume (K) Forecast, by Application 2020 & 2033
- Table 39: Germany Body Weight Scales Revenue (million) Forecast, by Application 2020 & 2033
- Table 40: Germany Body Weight Scales Volume (K) Forecast, by Application 2020 & 2033
- Table 41: France Body Weight Scales Revenue (million) Forecast, by Application 2020 & 2033
- Table 42: France Body Weight Scales Volume (K) Forecast, by Application 2020 & 2033
- Table 43: Italy Body Weight Scales Revenue (million) Forecast, by Application 2020 & 2033
- Table 44: Italy Body Weight Scales Volume (K) Forecast, by Application 2020 & 2033
- Table 45: Spain Body Weight Scales Revenue (million) Forecast, by Application 2020 & 2033
- Table 46: Spain Body Weight Scales Volume (K) Forecast, by Application 2020 & 2033
- Table 47: Russia Body Weight Scales Revenue (million) Forecast, by Application 2020 & 2033
- Table 48: Russia Body Weight Scales Volume (K) Forecast, by Application 2020 & 2033
- Table 49: Benelux Body Weight Scales Revenue (million) Forecast, by Application 2020 & 2033
- Table 50: Benelux Body Weight Scales Volume (K) Forecast, by Application 2020 & 2033
- Table 51: Nordics Body Weight Scales Revenue (million) Forecast, by Application 2020 & 2033
- Table 52: Nordics Body Weight Scales Volume (K) Forecast, by Application 2020 & 2033
- Table 53: Rest of Europe Body Weight Scales Revenue (million) Forecast, by Application 2020 & 2033
- Table 54: Rest of Europe Body Weight Scales Volume (K) Forecast, by Application 2020 & 2033
- Table 55: Global Body Weight Scales Revenue million Forecast, by Application 2020 & 2033
- Table 56: Global Body Weight Scales Volume K Forecast, by Application 2020 & 2033
- Table 57: Global Body Weight Scales Revenue million Forecast, by Types 2020 & 2033
- Table 58: Global Body Weight Scales Volume K Forecast, by Types 2020 & 2033
- Table 59: Global Body Weight Scales Revenue million Forecast, by Country 2020 & 2033
- Table 60: Global Body Weight Scales Volume K Forecast, by Country 2020 & 2033
- Table 61: Turkey Body Weight Scales Revenue (million) Forecast, by Application 2020 & 2033
- Table 62: Turkey Body Weight Scales Volume (K) Forecast, by Application 2020 & 2033
- Table 63: Israel Body Weight Scales Revenue (million) Forecast, by Application 2020 & 2033
- Table 64: Israel Body Weight Scales Volume (K) Forecast, by Application 2020 & 2033
- Table 65: GCC Body Weight Scales Revenue (million) Forecast, by Application 2020 & 2033
- Table 66: GCC Body Weight Scales Volume (K) Forecast, by Application 2020 & 2033
- Table 67: North Africa Body Weight Scales Revenue (million) Forecast, by Application 2020 & 2033
- Table 68: North Africa Body Weight Scales Volume (K) Forecast, by Application 2020 & 2033
- Table 69: South Africa Body Weight Scales Revenue (million) Forecast, by Application 2020 & 2033
- Table 70: South Africa Body Weight Scales Volume (K) Forecast, by Application 2020 & 2033
- Table 71: Rest of Middle East & Africa Body Weight Scales Revenue (million) Forecast, by Application 2020 & 2033
- Table 72: Rest of Middle East & Africa Body Weight Scales Volume (K) Forecast, by Application 2020 & 2033
- Table 73: Global Body Weight Scales Revenue million Forecast, by Application 2020 & 2033
- Table 74: Global Body Weight Scales Volume K Forecast, by Application 2020 & 2033
- Table 75: Global Body Weight Scales Revenue million Forecast, by Types 2020 & 2033
- Table 76: Global Body Weight Scales Volume K Forecast, by Types 2020 & 2033
- Table 77: Global Body Weight Scales Revenue million Forecast, by Country 2020 & 2033
- Table 78: Global Body Weight Scales Volume K Forecast, by Country 2020 & 2033
- Table 79: China Body Weight Scales Revenue (million) Forecast, by Application 2020 & 2033
- Table 80: China Body Weight Scales Volume (K) Forecast, by Application 2020 & 2033
- Table 81: India Body Weight Scales Revenue (million) Forecast, by Application 2020 & 2033
- Table 82: India Body Weight Scales Volume (K) Forecast, by Application 2020 & 2033
- Table 83: Japan Body Weight Scales Revenue (million) Forecast, by Application 2020 & 2033
- Table 84: Japan Body Weight Scales Volume (K) Forecast, by Application 2020 & 2033
- Table 85: South Korea Body Weight Scales Revenue (million) Forecast, by Application 2020 & 2033
- Table 86: South Korea Body Weight Scales Volume (K) Forecast, by Application 2020 & 2033
- Table 87: ASEAN Body Weight Scales Revenue (million) Forecast, by Application 2020 & 2033
- Table 88: ASEAN Body Weight Scales Volume (K) Forecast, by Application 2020 & 2033
- Table 89: Oceania Body Weight Scales Revenue (million) Forecast, by Application 2020 & 2033
- Table 90: Oceania Body Weight Scales Volume (K) Forecast, by Application 2020 & 2033
- Table 91: Rest of Asia Pacific Body Weight Scales Revenue (million) Forecast, by Application 2020 & 2033
- Table 92: Rest of Asia Pacific Body Weight Scales Volume (K) Forecast, by Application 2020 & 2033
Frequently Asked Questions
1. What is the projected Compound Annual Growth Rate (CAGR) of the Body Weight Scales?
The projected CAGR is approximately XX%.
2. Which companies are prominent players in the Body Weight Scales?
Key companies in the market include Tanita, Taylor, Weight Watchers, Withings, Seca.
3. What are the main segments of the Body Weight Scales?
The market segments include Application, Types.
4. Can you provide details about the market size?
The market size is estimated to be USD XXX million as of 2022.
5. What are some drivers contributing to market growth?
N/A
6. What are the notable trends driving market growth?
N/A
7. Are there any restraints impacting market growth?
N/A
8. Can you provide examples of recent developments in the market?
N/A
9. What pricing options are available for accessing the report?
Pricing options include single-user, multi-user, and enterprise licenses priced at USD 3350.00, USD 5025.00, and USD 6700.00 respectively.
10. Is the market size provided in terms of value or volume?
The market size is provided in terms of value, measured in million and volume, measured in K.
11. Are there any specific market keywords associated with the report?
Yes, the market keyword associated with the report is "Body Weight Scales," which aids in identifying and referencing the specific market segment covered.
12. How do I determine which pricing option suits my needs best?
The pricing options vary based on user requirements and access needs. Individual users may opt for single-user licenses, while businesses requiring broader access may choose multi-user or enterprise licenses for cost-effective access to the report.
13. Are there any additional resources or data provided in the Body Weight Scales report?
While the report offers comprehensive insights, it's advisable to review the specific contents or supplementary materials provided to ascertain if additional resources or data are available.
14. How can I stay updated on further developments or reports in the Body Weight Scales?
To stay informed about further developments, trends, and reports in the Body Weight Scales, consider subscribing to industry newsletters, following relevant companies and organizations, or regularly checking reputable industry news sources and publications.
Methodology
Step 1 - Identification of Relevant Samples Size from Population Database


Step 2 - Approaches for Defining Global Market Size (Value, Volume* & Price*)

Note*: In applicable scenarios
Step 3 - Data Sources
Primary Research
- Web Analytics
- Survey Reports
- Research Institute
- Latest Research Reports
- Opinion Leaders
Secondary Research
- Annual Reports
- White Paper
- Latest Press Release
- Industry Association
- Paid Database
- Investor Presentations

Step 4 - Data Triangulation
Involves using different sources of information in order to increase the validity of a study
These sources are likely to be stakeholders in a program - participants, other researchers, program staff, other community members, and so on.
Then we put all data in single framework & apply various statistical tools to find out the dynamic on the market.
During the analysis stage, feedback from the stakeholder groups would be compared to determine areas of agreement as well as areas of divergence