

Key Insights
The global boiler water treatment chemical market is poised for substantial expansion, with an anticipated Compound Annual Growth Rate (CAGR) of 8.2%. This growth trajectory, from a market size of $40.48 billion in the base year of 2025, is propelled by several key market drivers. The escalating demand for dependable power generation, especially in rapidly industrializing Asia-Pacific economies, necessitates efficient boiler systems, thereby increasing the demand for advanced water treatment chemicals to combat scaling and corrosion. Furthermore, increasingly stringent environmental regulations on wastewater discharge are compelling industries to invest in sophisticated water treatment solutions, including oxygen scavengers and advanced corrosion inhibitors. The growing emphasis on sustainable industrial operations is also fostering the adoption of eco-friendly and biodegradable boiler water treatment chemicals, contributing to market growth.
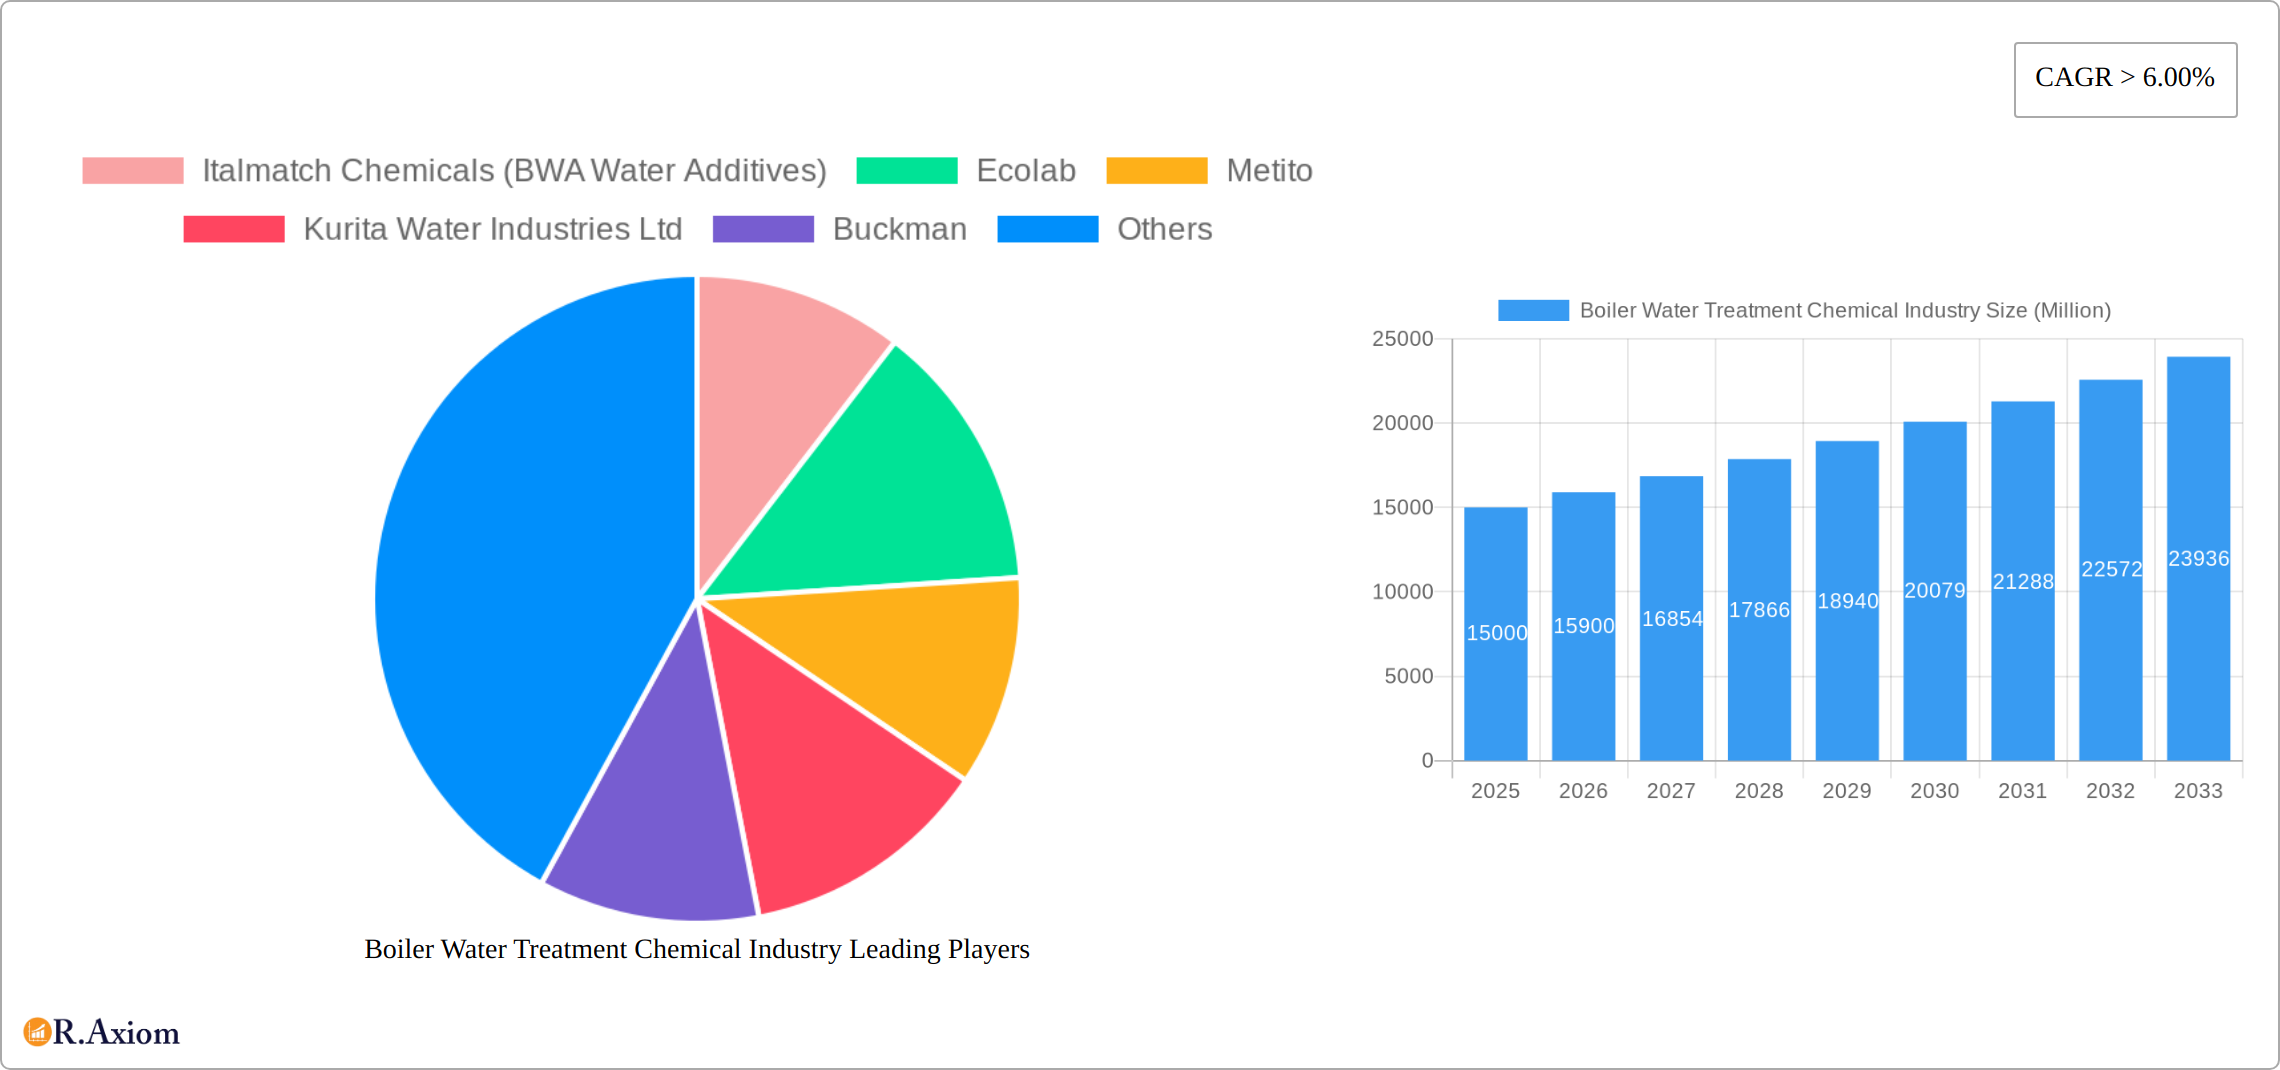
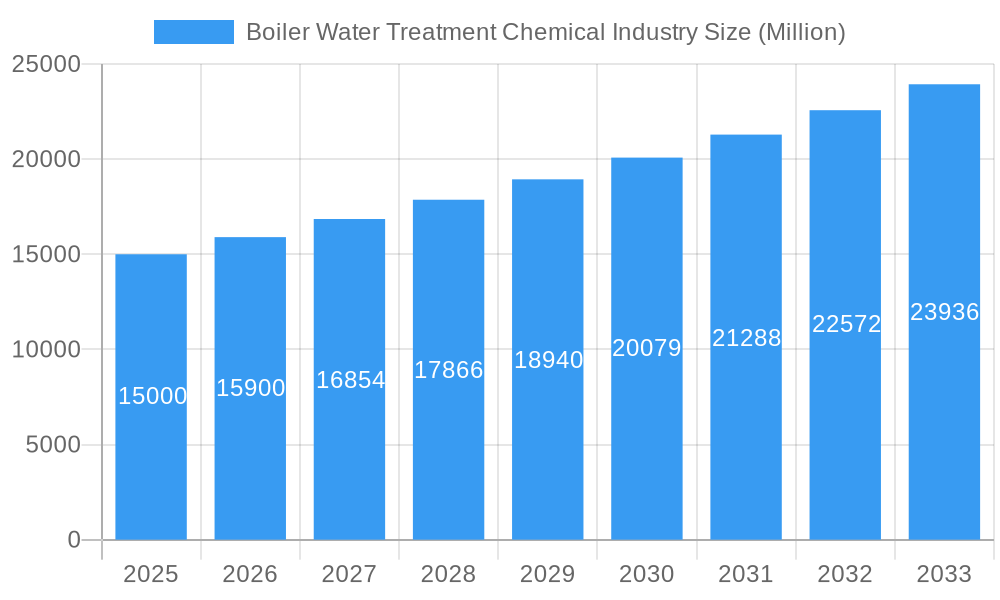
Boiler Water Treatment Chemical Industry Market Size (In Billion)
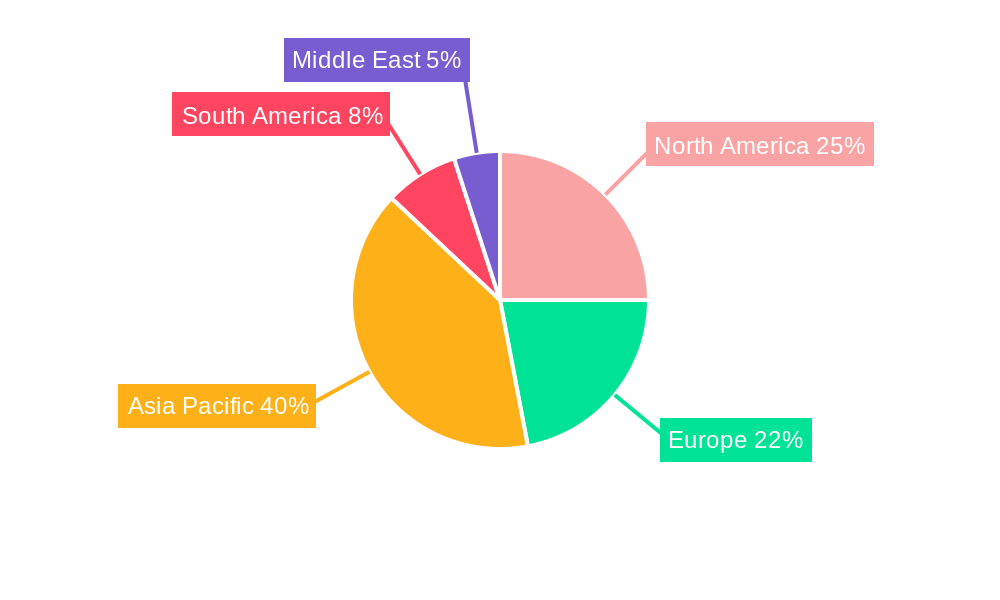
Market analysis indicates that scale and corrosion inhibitors are dominant within the product type segment, addressing critical aspects of boiler system maintenance. The application segment shows a rising preference for blended and specialty chemicals, reflecting a move towards tailored solutions for diverse industrial and water conditions. Geographically, the Asia-Pacific region, led by China and India's industrial development, is projected to lead market growth, followed by North America and Europe. Leading companies such as Italmatch Chemicals, Ecolab, and Kurita Water Industries are strategically expanding through mergers, acquisitions, and technological innovation to secure market share. While challenges like raw material price volatility and complex regulatory compliance exist, the long-term market outlook remains highly positive, underpinned by sustained industrial expansion and the critical need for efficient, sustainable water management.
Boiler Water Treatment Chemical Industry Company Market Share
Boiler Water Treatment Chemical Industry: A Comprehensive Market Report (2019-2033)
This comprehensive report provides a detailed analysis of the Boiler Water Treatment Chemical industry, offering invaluable insights for stakeholders seeking to understand market dynamics, growth opportunities, and competitive landscapes. The study covers the period 2019-2033, with a base year of 2025 and a forecast period of 2025-2033. The report leverages extensive primary and secondary research to deliver actionable intelligence, including market sizing (in Millions), CAGR projections, and competitive benchmarking.
Boiler Water Treatment Chemical Industry Market Concentration & Innovation
The Boiler Water Treatment Chemical industry is moderately concentrated, with several multinational corporations and regional players vying for market share. In 2024, the top five companies held an estimated xx% of the global market. This concentration is driven by significant capital investments in R&D, extensive distribution networks, and established brand recognition. However, the market exhibits a degree of fragmentation, particularly in niche segments and emerging economies.
Innovation Drivers:
- Stringent environmental regulations driving demand for eco-friendly chemicals.
- Advancements in water treatment technologies leading to more efficient and effective solutions.
- Growing focus on water conservation and responsible water management.
- Development of customized solutions tailored to specific industrial needs.
Regulatory Frameworks: Stringent environmental regulations regarding water discharge and chemical usage significantly impact industry players. Compliance necessitates investment in R&D for environmentally benign chemicals.
Product Substitutes: While few direct substitutes exist, alternative water treatment methods and technologies (e.g., membrane filtration) pose indirect competitive pressure.
End-User Trends: Industrial end-users are increasingly prioritizing cost-effectiveness, efficiency, and environmental sustainability in their water treatment strategies.
M&A Activities: Recent years have witnessed significant mergers and acquisitions, including:
- February 2020: Veolia Water Technologies UK acquired Biochemica Water Ltd for an estimated xx Million USD.
- February 2019: Kurita acquired U.S. Water Services Inc. for an estimated xx Million USD. These transactions reflect industry consolidation and expansion strategies.
Boiler Water Treatment Chemical Industry Industry Trends & Insights
The Boiler Water Treatment Chemical industry is experiencing robust growth, driven by factors such as increasing industrialization, rising energy demands, and a growing awareness of water scarcity. The market is projected to register a CAGR of xx% during the forecast period (2025-2033), reaching a value of xx Million USD by 2033. This growth is fueled by multiple factors:
- Expanding Industrialization: The continuous expansion of various industrial sectors, including power generation, petrochemicals, and manufacturing, directly increases demand for effective boiler water treatment solutions.
- Stringent Environmental Regulations: Government regulations mandating cleaner water discharge drive the adoption of advanced treatment chemicals.
- Technological Advancements: Innovations in chemical formulations and water treatment technologies are leading to more efficient and cost-effective solutions. This includes the development of environmentally friendly and less energy-intensive processes.
- Shifting Consumer Preferences: End-users are increasingly prioritizing solutions that minimize operational costs, environmental impact, and optimize water use.
The market penetration of advanced treatment chemicals like blended/specialty chemicals is increasing as industries adopt more sophisticated water treatment practices. This is leading to significant growth in this segment, outpacing the growth of basic chemicals. Competitive dynamics are shaped by pricing strategies, product innovation, and strategic partnerships. Larger multinational corporations leverage their extensive distribution networks and brand reputation to maintain market dominance.
Dominant Markets & Segments in Boiler Water Treatment Chemical Industry
The Asia-Pacific region currently leads the Boiler Water Treatment Chemical market, fueled by rapid industrialization, substantial infrastructure development, and robust economic growth, particularly in China and India. This dominance is further solidified by the region's expanding power generation capacity and supportive government policies promoting industrial efficiency and sustainability. Let's delve into the key market segments:
Type: Scale and corrosion inhibitors remain the largest segment by value, commanding approximately [Insert Updated Percentage]% of the market in 2024, followed by coagulants and flocculants. The high demand reflects the critical role these chemicals play in preventing costly equipment damage and ensuring operational efficiency. Growth in this segment is driven by the increasing adoption of advanced treatment technologies and a rising focus on extending the lifespan of boiler systems.
Application: Blended/specialty chemicals are experiencing significant traction, outpacing the growth of basic chemicals due to their tailored properties, superior performance, and ability to address specific water quality challenges. This segment is projected to witness the highest growth rate over the forecast period, driven by the increasing demand for optimized boiler water treatment solutions that minimize environmental impact and maximize operational efficiency.
End-user Industry: The power generation sector continues to be the largest end-user, owing to the substantial demand from large-scale power plants and the global increase in electricity consumption. However, other sectors, such as the chemical and petrochemical industry, are demonstrating strong growth potential due to stringent regulatory compliance, the need for process optimization, and the adoption of advanced water treatment practices to minimize environmental impact and reduce operational costs. The increasing demand for high-purity water in various industrial processes further fuels market growth.
Key Regional Drivers:
- Asia-Pacific: Rapid industrialization, expanding power generation capacity, and supportive government policies focused on environmental sustainability and industrial efficiency continue to drive substantial market growth.
- North America: Stringent environmental regulations, investments in infrastructure modernization, and a growing emphasis on energy efficiency are key drivers, pushing the adoption of advanced and eco-friendly boiler water treatment solutions.
- Europe: The strong focus on energy efficiency and environmental sustainability, coupled with regulations promoting resource optimization, shapes market dynamics and fosters innovation in environmentally-conscious treatment technologies.
Boiler Water Treatment Chemical Industry Product Developments
Recent product developments focus on enhancing efficiency, reducing environmental impact, and improving cost-effectiveness. This includes the formulation of environmentally friendly chemicals, advancements in biocides, and the introduction of intelligent water treatment systems that incorporate real-time monitoring and data analytics. This allows for improved control and optimization of the water treatment process, resulting in reduced chemical consumption and enhanced treatment efficacy. These innovations are improving market fit by meeting evolving customer demands for sustainable and high-performing solutions.
Report Scope & Segmentation Analysis
This report provides a comprehensive segmentation analysis of the market based on type (Scale and Corrosion Inhibitors, Coagulants & Flocculants, pH Boosters, Oxygen Scavengers, Others), application (Basic Chemicals, Blended/Specialty Chemicals), and end-user industry (Power Generation, Steel and Metal Industry, Oil Refinery, Chemical & Petrochemical, Textile and Dye Industry, Sugar Mill, Food and Beverage, Other End-user Industries). A detailed examination of each segment's market size, growth projections, competitive landscape, and key market drivers is included, offering valuable insights into market opportunities and competitive dynamics. The report specifically highlights the projected significant growth of the Blended/Specialty Chemicals segment, driven by the escalating demand for tailored solutions and superior performance capabilities that address increasingly stringent regulatory requirements and optimize operational efficiency.
Key Drivers of Boiler Water Treatment Chemical Industry Growth
The industry's growth is driven by a confluence of factors: increasing industrialization and energy production lead to higher demand for effective water treatment solutions. Stringent environmental regulations push for more sustainable and less polluting chemicals, fueling innovation. Furthermore, advancements in chemical formulations and water treatment technologies offer more efficient and cost-effective solutions.
Challenges in the Boiler Water Treatment Chemical Industry Sector
The industry faces several significant challenges, including fluctuating raw material prices impacting profitability and margins. Stringent environmental regulations necessitate substantial investments in research and development to ensure compliance and develop eco-friendly solutions. Intense competition, particularly from larger multinational corporations with established market presence and extensive resources, creates pressure on smaller players. Furthermore, supply chain disruptions, especially given the reliance on specific raw materials, pose a major obstacle to consistent production and timely delivery. Economic fluctuations and geopolitical instability can also influence market demand and supply.
Emerging Opportunities in Boiler Water Treatment Chemical Industry
Emerging opportunities exist in developing eco-friendly and sustainable water treatment solutions. Expanding into high-growth economies in Asia and Africa offers significant market potential. The integration of advanced technologies like IoT and AI for real-time monitoring and process optimization presents new avenues for growth. Furthermore, the development of customized solutions tailored to specific industrial needs and unique water conditions creates opportunities to capture market share.
Leading Players in the Boiler Water Treatment Chemical Industry Market
Key Developments in Boiler Water Treatment Chemical Industry Industry
- February 2020: Veolia Water Technologies UK acquired Biochemica Water Ltd., expanding its portfolio and market reach in boiler water treatment solutions.
- February 2019: Kurita acquired U.S. Water Services Inc., strengthening its global presence and market share in the industry.
- [Add more recent acquisitions or mergers and acquisitions]
Strategic Outlook for Boiler Water Treatment Chemical Industry Market
The Boiler Water Treatment Chemical industry is poised for sustained growth, driven by the ongoing expansion of industrial activity globally, increasingly stringent environmental regulations, and advancements in treatment technologies that enhance efficiency and minimize environmental impact. Companies that effectively adapt to changing market dynamics, prioritizing sustainability, innovation, and the development of cost-effective, high-performance solutions, are best positioned to capitalize on emerging opportunities. Strategic partnerships, acquisitions, and investments in research and development will continue to shape the industry landscape, fostering competition and innovation in the sector.
Boiler Water Treatment Chemical Industry Segmentation
-
1. Type
- 1.1. Scale and Corrosion Inhibitors
- 1.2. Coagulants & Flocculants
- 1.3. pH Boosters
- 1.4. Oxygen Scavengers
- 1.5. Others
-
2. Application
- 2.1. Basic Chemicals
- 2.2. Blended/Specialty Chemicals
-
3. End-user Industry
- 3.1. Power Generation
- 3.2. Steel and Metal Industry
- 3.3. Oil Refinery
- 3.4. Chemical & Petrochemical
- 3.5. Textile and Dye Industry
- 3.6. Sugar Mill
- 3.7. Food and Beverage
- 3.8. Other End-user Industries
Boiler Water Treatment Chemical Industry Segmentation By Geography
-
1. Asia Pacific
- 1.1. China
- 1.2. India
- 1.3. Japan
- 1.4. South Korea
- 1.5. ASEAN Countries
- 1.6. Rest of Asia Pacific
-
2. North America
- 2.1. United States
- 2.2. Canada
- 2.3. Mexico
-
3. Europe
- 3.1. Germany
- 3.2. United Kingdom
- 3.3. France
- 3.4. Italy
- 3.5. Rest of the Europe
-
4. South America
- 4.1. Brazil
- 4.2. Argentina
- 4.3. Rest of South America
- 5. Middle East
-
6. Saudi Arabia
- 6.1. South Africa
- 6.2. Rest of Middle East
Boiler Water Treatment Chemical Industry Regional Market Share
Geographic Coverage of Boiler Water Treatment Chemical Industry
Boiler Water Treatment Chemical Industry REPORT HIGHLIGHTS
| Aspects | Details |
|---|---|
| Study Period | 2020-2034 |
| Base Year | 2025 |
| Estimated Year | 2026 |
| Forecast Period | 2026-2034 |
| Historical Period | 2020-2025 |
| Growth Rate | CAGR of 8.2% from 2020-2034 |
| Segmentation |
|
Table of Contents
- 1. Introduction
- 1.1. Research Scope
- 1.2. Market Segmentation
- 1.3. Research Objective
- 1.4. Definitions and Assumptions
- 2. Executive Summary
- 2.1. Market Snapshot
- 3. Market Dynamics
- 3.1. Market Drivers
- 3.2. Market Restrains
- 3.3. Market Trends
- 3.4. Market Opportunities
- 4. Market Factor Analysis
- 4.1. Porters Five Forces
- 4.1.1. Bargaining Power of Suppliers
- 4.1.2. Bargaining Power of Buyers
- 4.1.3. Threat of New Entrants
- 4.1.4. Threat of Substitutes
- 4.1.5. Competitive Rivalry
- 4.2. PESTEL analysis
- 4.3. BCG Analysis
- 4.3.1. Stars (High Growth, High Market Share)
- 4.3.2. Cash Cows (Low Growth, High Market Share)
- 4.3.3. Question Mark (High Growth, Low Market Share)
- 4.3.4. Dogs (Low Growth, Low Market Share)
- 4.4. Ansoff Matrix Analysis
- 4.5. Supply Chain Analysis
- 4.6. Regulatory Landscape
- 4.7. Current Market Potential and Opportunity Assessment (TAM–SAM–SOM Framework)
- 4.8. RAX Analyst Note
- 4.1. Porters Five Forces
- 5. Market Analysis, Insights and Forecast 2021-2033
- 5.1. Market Analysis, Insights and Forecast - by Type
- 5.1.1. Scale and Corrosion Inhibitors
- 5.1.2. Coagulants & Flocculants
- 5.1.3. pH Boosters
- 5.1.4. Oxygen Scavengers
- 5.1.5. Others
- 5.2. Market Analysis, Insights and Forecast - by Application
- 5.2.1. Basic Chemicals
- 5.2.2. Blended/Specialty Chemicals
- 5.3. Market Analysis, Insights and Forecast - by End-user Industry
- 5.3.1. Power Generation
- 5.3.2. Steel and Metal Industry
- 5.3.3. Oil Refinery
- 5.3.4. Chemical & Petrochemical
- 5.3.5. Textile and Dye Industry
- 5.3.6. Sugar Mill
- 5.3.7. Food and Beverage
- 5.3.8. Other End-user Industries
- 5.4. Market Analysis, Insights and Forecast - by Region
- 5.4.1. Asia Pacific
- 5.4.2. North America
- 5.4.3. Europe
- 5.4.4. South America
- 5.4.5. Middle East
- 5.4.6. Saudi Arabia
- 5.1. Market Analysis, Insights and Forecast - by Type
- 6. Global Boiler Water Treatment Chemical Industry Analysis, Insights and Forecast, 2021-2033
- 6.1. Market Analysis, Insights and Forecast - by Type
- 6.1.1. Scale and Corrosion Inhibitors
- 6.1.2. Coagulants & Flocculants
- 6.1.3. pH Boosters
- 6.1.4. Oxygen Scavengers
- 6.1.5. Others
- 6.2. Market Analysis, Insights and Forecast - by Application
- 6.2.1. Basic Chemicals
- 6.2.2. Blended/Specialty Chemicals
- 6.3. Market Analysis, Insights and Forecast - by End-user Industry
- 6.3.1. Power Generation
- 6.3.2. Steel and Metal Industry
- 6.3.3. Oil Refinery
- 6.3.4. Chemical & Petrochemical
- 6.3.5. Textile and Dye Industry
- 6.3.6. Sugar Mill
- 6.3.7. Food and Beverage
- 6.3.8. Other End-user Industries
- 6.1. Market Analysis, Insights and Forecast - by Type
- 7. Asia Pacific Boiler Water Treatment Chemical Industry Analysis, Insights and Forecast, 2020-2032
- 7.1. Market Analysis, Insights and Forecast - by Type
- 7.1.1. Scale and Corrosion Inhibitors
- 7.1.2. Coagulants & Flocculants
- 7.1.3. pH Boosters
- 7.1.4. Oxygen Scavengers
- 7.1.5. Others
- 7.2. Market Analysis, Insights and Forecast - by Application
- 7.2.1. Basic Chemicals
- 7.2.2. Blended/Specialty Chemicals
- 7.3. Market Analysis, Insights and Forecast - by End-user Industry
- 7.3.1. Power Generation
- 7.3.2. Steel and Metal Industry
- 7.3.3. Oil Refinery
- 7.3.4. Chemical & Petrochemical
- 7.3.5. Textile and Dye Industry
- 7.3.6. Sugar Mill
- 7.3.7. Food and Beverage
- 7.3.8. Other End-user Industries
- 7.1. Market Analysis, Insights and Forecast - by Type
- 8. North America Boiler Water Treatment Chemical Industry Analysis, Insights and Forecast, 2020-2032
- 8.1. Market Analysis, Insights and Forecast - by Type
- 8.1.1. Scale and Corrosion Inhibitors
- 8.1.2. Coagulants & Flocculants
- 8.1.3. pH Boosters
- 8.1.4. Oxygen Scavengers
- 8.1.5. Others
- 8.2. Market Analysis, Insights and Forecast - by Application
- 8.2.1. Basic Chemicals
- 8.2.2. Blended/Specialty Chemicals
- 8.3. Market Analysis, Insights and Forecast - by End-user Industry
- 8.3.1. Power Generation
- 8.3.2. Steel and Metal Industry
- 8.3.3. Oil Refinery
- 8.3.4. Chemical & Petrochemical
- 8.3.5. Textile and Dye Industry
- 8.3.6. Sugar Mill
- 8.3.7. Food and Beverage
- 8.3.8. Other End-user Industries
- 8.1. Market Analysis, Insights and Forecast - by Type
- 9. Europe Boiler Water Treatment Chemical Industry Analysis, Insights and Forecast, 2020-2032
- 9.1. Market Analysis, Insights and Forecast - by Type
- 9.1.1. Scale and Corrosion Inhibitors
- 9.1.2. Coagulants & Flocculants
- 9.1.3. pH Boosters
- 9.1.4. Oxygen Scavengers
- 9.1.5. Others
- 9.2. Market Analysis, Insights and Forecast - by Application
- 9.2.1. Basic Chemicals
- 9.2.2. Blended/Specialty Chemicals
- 9.3. Market Analysis, Insights and Forecast - by End-user Industry
- 9.3.1. Power Generation
- 9.3.2. Steel and Metal Industry
- 9.3.3. Oil Refinery
- 9.3.4. Chemical & Petrochemical
- 9.3.5. Textile and Dye Industry
- 9.3.6. Sugar Mill
- 9.3.7. Food and Beverage
- 9.3.8. Other End-user Industries
- 9.1. Market Analysis, Insights and Forecast - by Type
- 10. South America Boiler Water Treatment Chemical Industry Analysis, Insights and Forecast, 2020-2032
- 10.1. Market Analysis, Insights and Forecast - by Type
- 10.1.1. Scale and Corrosion Inhibitors
- 10.1.2. Coagulants & Flocculants
- 10.1.3. pH Boosters
- 10.1.4. Oxygen Scavengers
- 10.1.5. Others
- 10.2. Market Analysis, Insights and Forecast - by Application
- 10.2.1. Basic Chemicals
- 10.2.2. Blended/Specialty Chemicals
- 10.3. Market Analysis, Insights and Forecast - by End-user Industry
- 10.3.1. Power Generation
- 10.3.2. Steel and Metal Industry
- 10.3.3. Oil Refinery
- 10.3.4. Chemical & Petrochemical
- 10.3.5. Textile and Dye Industry
- 10.3.6. Sugar Mill
- 10.3.7. Food and Beverage
- 10.3.8. Other End-user Industries
- 10.1. Market Analysis, Insights and Forecast - by Type
- 11. Middle East Boiler Water Treatment Chemical Industry Analysis, Insights and Forecast, 2020-2032
- 11.1. Market Analysis, Insights and Forecast - by Type
- 11.1.1. Scale and Corrosion Inhibitors
- 11.1.2. Coagulants & Flocculants
- 11.1.3. pH Boosters
- 11.1.4. Oxygen Scavengers
- 11.1.5. Others
- 11.2. Market Analysis, Insights and Forecast - by Application
- 11.2.1. Basic Chemicals
- 11.2.2. Blended/Specialty Chemicals
- 11.3. Market Analysis, Insights and Forecast - by End-user Industry
- 11.3.1. Power Generation
- 11.3.2. Steel and Metal Industry
- 11.3.3. Oil Refinery
- 11.3.4. Chemical & Petrochemical
- 11.3.5. Textile and Dye Industry
- 11.3.6. Sugar Mill
- 11.3.7. Food and Beverage
- 11.3.8. Other End-user Industries
- 11.1. Market Analysis, Insights and Forecast - by Type
- 12. Saudi Arabia Boiler Water Treatment Chemical Industry Analysis, Insights and Forecast, 2020-2032
- 12.1. Market Analysis, Insights and Forecast - by Type
- 12.1.1. Scale and Corrosion Inhibitors
- 12.1.2. Coagulants & Flocculants
- 12.1.3. pH Boosters
- 12.1.4. Oxygen Scavengers
- 12.1.5. Others
- 12.2. Market Analysis, Insights and Forecast - by Application
- 12.2.1. Basic Chemicals
- 12.2.2. Blended/Specialty Chemicals
- 12.3. Market Analysis, Insights and Forecast - by End-user Industry
- 12.3.1. Power Generation
- 12.3.2. Steel and Metal Industry
- 12.3.3. Oil Refinery
- 12.3.4. Chemical & Petrochemical
- 12.3.5. Textile and Dye Industry
- 12.3.6. Sugar Mill
- 12.3.7. Food and Beverage
- 12.3.8. Other End-user Industries
- 12.1. Market Analysis, Insights and Forecast - by Type
- 13. Competitive Analysis
- 13.1. Company Profiles
- 13.1.1 Italmatch Chemicals (BWA Water Additives)
- 13.1.1.1. Company Overview
- 13.1.1.2. Products
- 13.1.1.3. Company Financials
- 13.1.1.4. SWOT Analysis
- 13.1.2 Ecolab
- 13.1.2.1. Company Overview
- 13.1.2.2. Products
- 13.1.2.3. Company Financials
- 13.1.2.4. SWOT Analysis
- 13.1.3 Metito
- 13.1.3.1. Company Overview
- 13.1.3.2. Products
- 13.1.3.3. Company Financials
- 13.1.3.4. SWOT Analysis
- 13.1.4 Kurita Water Industries Ltd
- 13.1.4.1. Company Overview
- 13.1.4.2. Products
- 13.1.4.3. Company Financials
- 13.1.4.4. SWOT Analysis
- 13.1.5 Buckman
- 13.1.5.1. Company Overview
- 13.1.5.2. Products
- 13.1.5.3. Company Financials
- 13.1.5.4. SWOT Analysis
- 13.1.6 Ion Exchange LLC
- 13.1.6.1. Company Overview
- 13.1.6.2. Products
- 13.1.6.3. Company Financials
- 13.1.6.4. SWOT Analysis
- 13.1.7 Wetico*List Not Exhaustive
- 13.1.7.1. Company Overview
- 13.1.7.2. Products
- 13.1.7.3. Company Financials
- 13.1.7.4. SWOT Analysis
- 13.1.8 SUEZ
- 13.1.8.1. Company Overview
- 13.1.8.2. Products
- 13.1.8.3. Company Financials
- 13.1.8.4. SWOT Analysis
- 13.1.9 ChemTreat Inc
- 13.1.9.1. Company Overview
- 13.1.9.2. Products
- 13.1.9.3. Company Financials
- 13.1.9.4. SWOT Analysis
- 13.1.10 Solenis
- 13.1.10.1. Company Overview
- 13.1.10.2. Products
- 13.1.10.3. Company Financials
- 13.1.10.4. SWOT Analysis
- 13.1.11 AES Arabia Ltd
- 13.1.11.1. Company Overview
- 13.1.11.2. Products
- 13.1.11.3. Company Financials
- 13.1.11.4. SWOT Analysis
- 13.1.12 Veolia
- 13.1.12.1. Company Overview
- 13.1.12.2. Products
- 13.1.12.3. Company Financials
- 13.1.12.4. SWOT Analysis
- 13.1.13 Thermax Global
- 13.1.13.1. Company Overview
- 13.1.13.2. Products
- 13.1.13.3. Company Financials
- 13.1.13.4. SWOT Analysis
- 13.1.1 Italmatch Chemicals (BWA Water Additives)
- 13.2. Market Entropy
- 13.2.1 Company's Key Areas Served
- 13.2.2 Recent Developments
- 13.3. Company Market Share Analysis 2025
- 13.3.1 Top 5 Companies Market Share Analysis
- 13.3.2 Top 3 Companies Market Share Analysis
- 13.4. List of Potential Customers
- 14. Research Methodology
List of Figures
- Figure 1: Global Boiler Water Treatment Chemical Industry Revenue Breakdown (billion, %) by Region 2025 & 2033
- Figure 2: Asia Pacific Boiler Water Treatment Chemical Industry Revenue (billion), by Type 2025 & 2033
- Figure 3: Asia Pacific Boiler Water Treatment Chemical Industry Revenue Share (%), by Type 2025 & 2033
- Figure 4: Asia Pacific Boiler Water Treatment Chemical Industry Revenue (billion), by Application 2025 & 2033
- Figure 5: Asia Pacific Boiler Water Treatment Chemical Industry Revenue Share (%), by Application 2025 & 2033
- Figure 6: Asia Pacific Boiler Water Treatment Chemical Industry Revenue (billion), by End-user Industry 2025 & 2033
- Figure 7: Asia Pacific Boiler Water Treatment Chemical Industry Revenue Share (%), by End-user Industry 2025 & 2033
- Figure 8: Asia Pacific Boiler Water Treatment Chemical Industry Revenue (billion), by Country 2025 & 2033
- Figure 9: Asia Pacific Boiler Water Treatment Chemical Industry Revenue Share (%), by Country 2025 & 2033
- Figure 10: North America Boiler Water Treatment Chemical Industry Revenue (billion), by Type 2025 & 2033
- Figure 11: North America Boiler Water Treatment Chemical Industry Revenue Share (%), by Type 2025 & 2033
- Figure 12: North America Boiler Water Treatment Chemical Industry Revenue (billion), by Application 2025 & 2033
- Figure 13: North America Boiler Water Treatment Chemical Industry Revenue Share (%), by Application 2025 & 2033
- Figure 14: North America Boiler Water Treatment Chemical Industry Revenue (billion), by End-user Industry 2025 & 2033
- Figure 15: North America Boiler Water Treatment Chemical Industry Revenue Share (%), by End-user Industry 2025 & 2033
- Figure 16: North America Boiler Water Treatment Chemical Industry Revenue (billion), by Country 2025 & 2033
- Figure 17: North America Boiler Water Treatment Chemical Industry Revenue Share (%), by Country 2025 & 2033
- Figure 18: Europe Boiler Water Treatment Chemical Industry Revenue (billion), by Type 2025 & 2033
- Figure 19: Europe Boiler Water Treatment Chemical Industry Revenue Share (%), by Type 2025 & 2033
- Figure 20: Europe Boiler Water Treatment Chemical Industry Revenue (billion), by Application 2025 & 2033
- Figure 21: Europe Boiler Water Treatment Chemical Industry Revenue Share (%), by Application 2025 & 2033
- Figure 22: Europe Boiler Water Treatment Chemical Industry Revenue (billion), by End-user Industry 2025 & 2033
- Figure 23: Europe Boiler Water Treatment Chemical Industry Revenue Share (%), by End-user Industry 2025 & 2033
- Figure 24: Europe Boiler Water Treatment Chemical Industry Revenue (billion), by Country 2025 & 2033
- Figure 25: Europe Boiler Water Treatment Chemical Industry Revenue Share (%), by Country 2025 & 2033
- Figure 26: South America Boiler Water Treatment Chemical Industry Revenue (billion), by Type 2025 & 2033
- Figure 27: South America Boiler Water Treatment Chemical Industry Revenue Share (%), by Type 2025 & 2033
- Figure 28: South America Boiler Water Treatment Chemical Industry Revenue (billion), by Application 2025 & 2033
- Figure 29: South America Boiler Water Treatment Chemical Industry Revenue Share (%), by Application 2025 & 2033
- Figure 30: South America Boiler Water Treatment Chemical Industry Revenue (billion), by End-user Industry 2025 & 2033
- Figure 31: South America Boiler Water Treatment Chemical Industry Revenue Share (%), by End-user Industry 2025 & 2033
- Figure 32: South America Boiler Water Treatment Chemical Industry Revenue (billion), by Country 2025 & 2033
- Figure 33: South America Boiler Water Treatment Chemical Industry Revenue Share (%), by Country 2025 & 2033
- Figure 34: Middle East Boiler Water Treatment Chemical Industry Revenue (billion), by Type 2025 & 2033
- Figure 35: Middle East Boiler Water Treatment Chemical Industry Revenue Share (%), by Type 2025 & 2033
- Figure 36: Middle East Boiler Water Treatment Chemical Industry Revenue (billion), by Application 2025 & 2033
- Figure 37: Middle East Boiler Water Treatment Chemical Industry Revenue Share (%), by Application 2025 & 2033
- Figure 38: Middle East Boiler Water Treatment Chemical Industry Revenue (billion), by End-user Industry 2025 & 2033
- Figure 39: Middle East Boiler Water Treatment Chemical Industry Revenue Share (%), by End-user Industry 2025 & 2033
- Figure 40: Middle East Boiler Water Treatment Chemical Industry Revenue (billion), by Country 2025 & 2033
- Figure 41: Middle East Boiler Water Treatment Chemical Industry Revenue Share (%), by Country 2025 & 2033
- Figure 42: Saudi Arabia Boiler Water Treatment Chemical Industry Revenue (billion), by Type 2025 & 2033
- Figure 43: Saudi Arabia Boiler Water Treatment Chemical Industry Revenue Share (%), by Type 2025 & 2033
- Figure 44: Saudi Arabia Boiler Water Treatment Chemical Industry Revenue (billion), by Application 2025 & 2033
- Figure 45: Saudi Arabia Boiler Water Treatment Chemical Industry Revenue Share (%), by Application 2025 & 2033
- Figure 46: Saudi Arabia Boiler Water Treatment Chemical Industry Revenue (billion), by End-user Industry 2025 & 2033
- Figure 47: Saudi Arabia Boiler Water Treatment Chemical Industry Revenue Share (%), by End-user Industry 2025 & 2033
- Figure 48: Saudi Arabia Boiler Water Treatment Chemical Industry Revenue (billion), by Country 2025 & 2033
- Figure 49: Saudi Arabia Boiler Water Treatment Chemical Industry Revenue Share (%), by Country 2025 & 2033
List of Tables
- Table 1: Global Boiler Water Treatment Chemical Industry Revenue billion Forecast, by Type 2020 & 2033
- Table 2: Global Boiler Water Treatment Chemical Industry Revenue billion Forecast, by Application 2020 & 2033
- Table 3: Global Boiler Water Treatment Chemical Industry Revenue billion Forecast, by End-user Industry 2020 & 2033
- Table 4: Global Boiler Water Treatment Chemical Industry Revenue billion Forecast, by Region 2020 & 2033
- Table 5: Global Boiler Water Treatment Chemical Industry Revenue billion Forecast, by Type 2020 & 2033
- Table 6: Global Boiler Water Treatment Chemical Industry Revenue billion Forecast, by Application 2020 & 2033
- Table 7: Global Boiler Water Treatment Chemical Industry Revenue billion Forecast, by End-user Industry 2020 & 2033
- Table 8: Global Boiler Water Treatment Chemical Industry Revenue billion Forecast, by Country 2020 & 2033
- Table 9: China Boiler Water Treatment Chemical Industry Revenue (billion) Forecast, by Application 2020 & 2033
- Table 10: India Boiler Water Treatment Chemical Industry Revenue (billion) Forecast, by Application 2020 & 2033
- Table 11: Japan Boiler Water Treatment Chemical Industry Revenue (billion) Forecast, by Application 2020 & 2033
- Table 12: South Korea Boiler Water Treatment Chemical Industry Revenue (billion) Forecast, by Application 2020 & 2033
- Table 13: ASEAN Countries Boiler Water Treatment Chemical Industry Revenue (billion) Forecast, by Application 2020 & 2033
- Table 14: Rest of Asia Pacific Boiler Water Treatment Chemical Industry Revenue (billion) Forecast, by Application 2020 & 2033
- Table 15: Global Boiler Water Treatment Chemical Industry Revenue billion Forecast, by Type 2020 & 2033
- Table 16: Global Boiler Water Treatment Chemical Industry Revenue billion Forecast, by Application 2020 & 2033
- Table 17: Global Boiler Water Treatment Chemical Industry Revenue billion Forecast, by End-user Industry 2020 & 2033
- Table 18: Global Boiler Water Treatment Chemical Industry Revenue billion Forecast, by Country 2020 & 2033
- Table 19: United States Boiler Water Treatment Chemical Industry Revenue (billion) Forecast, by Application 2020 & 2033
- Table 20: Canada Boiler Water Treatment Chemical Industry Revenue (billion) Forecast, by Application 2020 & 2033
- Table 21: Mexico Boiler Water Treatment Chemical Industry Revenue (billion) Forecast, by Application 2020 & 2033
- Table 22: Global Boiler Water Treatment Chemical Industry Revenue billion Forecast, by Type 2020 & 2033
- Table 23: Global Boiler Water Treatment Chemical Industry Revenue billion Forecast, by Application 2020 & 2033
- Table 24: Global Boiler Water Treatment Chemical Industry Revenue billion Forecast, by End-user Industry 2020 & 2033
- Table 25: Global Boiler Water Treatment Chemical Industry Revenue billion Forecast, by Country 2020 & 2033
- Table 26: Germany Boiler Water Treatment Chemical Industry Revenue (billion) Forecast, by Application 2020 & 2033
- Table 27: United Kingdom Boiler Water Treatment Chemical Industry Revenue (billion) Forecast, by Application 2020 & 2033
- Table 28: France Boiler Water Treatment Chemical Industry Revenue (billion) Forecast, by Application 2020 & 2033
- Table 29: Italy Boiler Water Treatment Chemical Industry Revenue (billion) Forecast, by Application 2020 & 2033
- Table 30: Rest of the Europe Boiler Water Treatment Chemical Industry Revenue (billion) Forecast, by Application 2020 & 2033
- Table 31: Global Boiler Water Treatment Chemical Industry Revenue billion Forecast, by Type 2020 & 2033
- Table 32: Global Boiler Water Treatment Chemical Industry Revenue billion Forecast, by Application 2020 & 2033
- Table 33: Global Boiler Water Treatment Chemical Industry Revenue billion Forecast, by End-user Industry 2020 & 2033
- Table 34: Global Boiler Water Treatment Chemical Industry Revenue billion Forecast, by Country 2020 & 2033
- Table 35: Brazil Boiler Water Treatment Chemical Industry Revenue (billion) Forecast, by Application 2020 & 2033
- Table 36: Argentina Boiler Water Treatment Chemical Industry Revenue (billion) Forecast, by Application 2020 & 2033
- Table 37: Rest of South America Boiler Water Treatment Chemical Industry Revenue (billion) Forecast, by Application 2020 & 2033
- Table 38: Global Boiler Water Treatment Chemical Industry Revenue billion Forecast, by Type 2020 & 2033
- Table 39: Global Boiler Water Treatment Chemical Industry Revenue billion Forecast, by Application 2020 & 2033
- Table 40: Global Boiler Water Treatment Chemical Industry Revenue billion Forecast, by End-user Industry 2020 & 2033
- Table 41: Global Boiler Water Treatment Chemical Industry Revenue billion Forecast, by Country 2020 & 2033
- Table 42: Global Boiler Water Treatment Chemical Industry Revenue billion Forecast, by Type 2020 & 2033
- Table 43: Global Boiler Water Treatment Chemical Industry Revenue billion Forecast, by Application 2020 & 2033
- Table 44: Global Boiler Water Treatment Chemical Industry Revenue billion Forecast, by End-user Industry 2020 & 2033
- Table 45: Global Boiler Water Treatment Chemical Industry Revenue billion Forecast, by Country 2020 & 2033
- Table 46: South Africa Boiler Water Treatment Chemical Industry Revenue (billion) Forecast, by Application 2020 & 2033
- Table 47: Rest of Middle East Boiler Water Treatment Chemical Industry Revenue (billion) Forecast, by Application 2020 & 2033
Frequently Asked Questions
1. What is the projected Compound Annual Growth Rate (CAGR) of the Boiler Water Treatment Chemical Industry?
The projected CAGR is approximately 8.2%.
2. Which companies are prominent players in the Boiler Water Treatment Chemical Industry?
Key companies in the market include Italmatch Chemicals (BWA Water Additives), Ecolab, Metito, Kurita Water Industries Ltd, Buckman, Ion Exchange LLC, Wetico*List Not Exhaustive, SUEZ, ChemTreat Inc, Solenis, AES Arabia Ltd, Veolia, Thermax Global.
3. What are the main segments of the Boiler Water Treatment Chemical Industry?
The market segments include Type, Application, End-user Industry.
4. Can you provide details about the market size?
The market size is estimated to be USD 40.48 billion as of 2022.
5. What are some drivers contributing to market growth?
Increasing Capacity Additions and Installations in the Asia-Pacific Power Industry; Increasing Demand from the Pharmaceutical Industry.
6. What are the notable trends driving market growth?
Power Industry to Dominate the Market.
7. Are there any restraints impacting market growth?
Lack of Awareness Regarding Boiler Water Treatment; Negative Impact of COVID-19.
8. Can you provide examples of recent developments in the market?
In February 2020, Veolia Water Technologies UK acquired water and wastewater treatment specialist Biochemica Water Ltd to expand its leadership in water treatment chemicals.
9. What pricing options are available for accessing the report?
Pricing options include single-user, multi-user, and enterprise licenses priced at USD 4750, USD 5250, and USD 8750 respectively.
10. Is the market size provided in terms of value or volume?
The market size is provided in terms of value, measured in billion.
11. Are there any specific market keywords associated with the report?
Yes, the market keyword associated with the report is "Boiler Water Treatment Chemical Industry," which aids in identifying and referencing the specific market segment covered.
12. How do I determine which pricing option suits my needs best?
The pricing options vary based on user requirements and access needs. Individual users may opt for single-user licenses, while businesses requiring broader access may choose multi-user or enterprise licenses for cost-effective access to the report.
13. Are there any additional resources or data provided in the Boiler Water Treatment Chemical Industry report?
While the report offers comprehensive insights, it's advisable to review the specific contents or supplementary materials provided to ascertain if additional resources or data are available.
14. How can I stay updated on further developments or reports in the Boiler Water Treatment Chemical Industry?
To stay informed about further developments, trends, and reports in the Boiler Water Treatment Chemical Industry, consider subscribing to industry newsletters, following relevant companies and organizations, or regularly checking reputable industry news sources and publications.
Methodology
Step 1 - Identification of Relevant Samples Size from Population Database


Step 2 - Approaches for Defining Global Market Size (Value, Volume* & Price*)

Note*: In applicable scenarios
Step 3 - Data Sources
Primary Research
- Web Analytics
- Survey Reports
- Research Institute
- Latest Research Reports
- Opinion Leaders
Secondary Research
- Annual Reports
- White Paper
- Latest Press Release
- Industry Association
- Paid Database
- Investor Presentations

Step 4 - Data Triangulation
Involves using different sources of information in order to increase the validity of a study
These sources are likely to be stakeholders in a program - participants, other researchers, program staff, other community members, and so on.
Then we put all data in single framework & apply various statistical tools to find out the dynamic on the market.
During the analysis stage, feedback from the stakeholder groups would be compared to determine areas of agreement as well as areas of divergence