

Key Insights
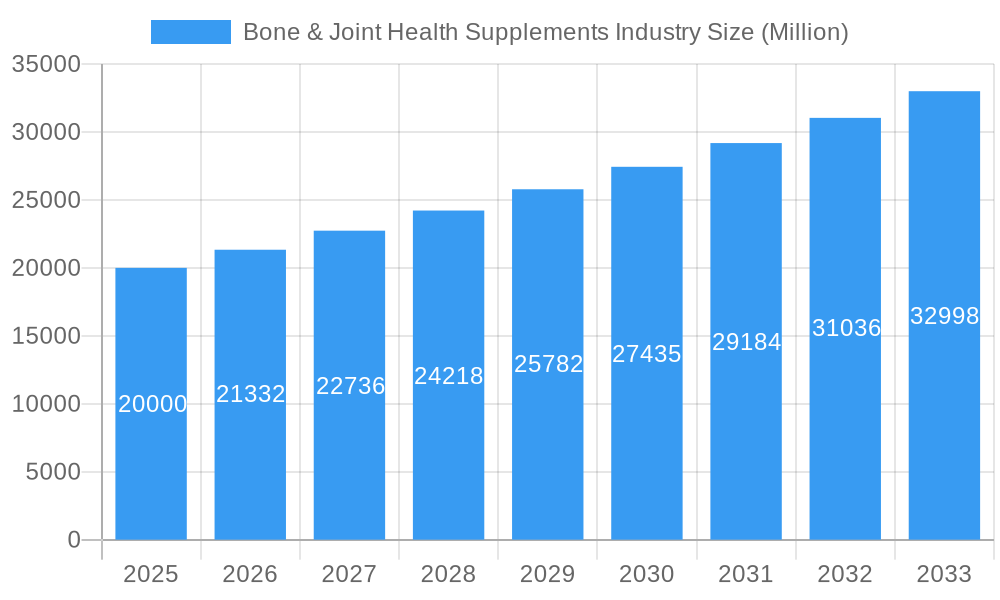
The global bone and joint health supplements market is experiencing robust growth, projected to reach a substantial size by 2033, driven by a 6.60% CAGR. This expansion is fueled by several key factors. The aging global population, with its increased susceptibility to osteoarthritis, osteoporosis, and other age-related joint conditions, significantly boosts demand. Rising awareness of the benefits of preventative healthcare and the increasing adoption of functional foods and supplements further contribute to market growth. Specific supplement types like collagen, glucosamine-chondroitin, and Omega-3 fatty acids are experiencing particularly high demand due to their established efficacy in improving joint health and reducing inflammation. The market is segmented by distribution channels, with supermarkets/hypermarkets, pharmacies, and online stores representing major sales avenues, reflecting the accessibility and convenience consumers seek. Leading companies like Bayer AG, Amway Corp, and Nature's Bounty Inc are leveraging their established brand recognition and extensive distribution networks to capture significant market share. Competition is fierce, however, with both established players and emerging brands vying for market dominance through innovative product formulations, targeted marketing campaigns, and strategic partnerships.
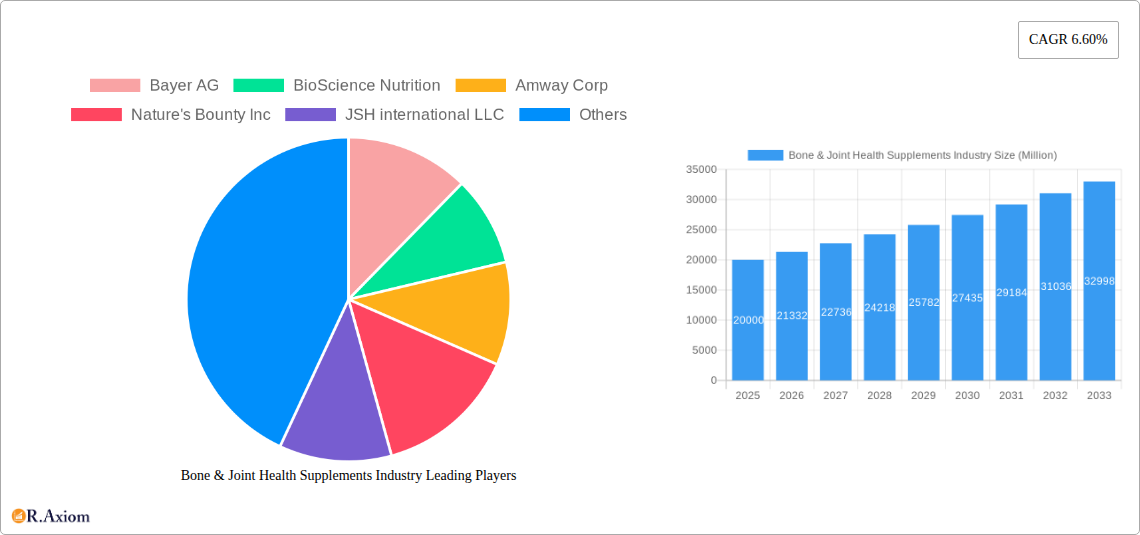
Bone & Joint Health Supplements Industry Market Size (In Billion)
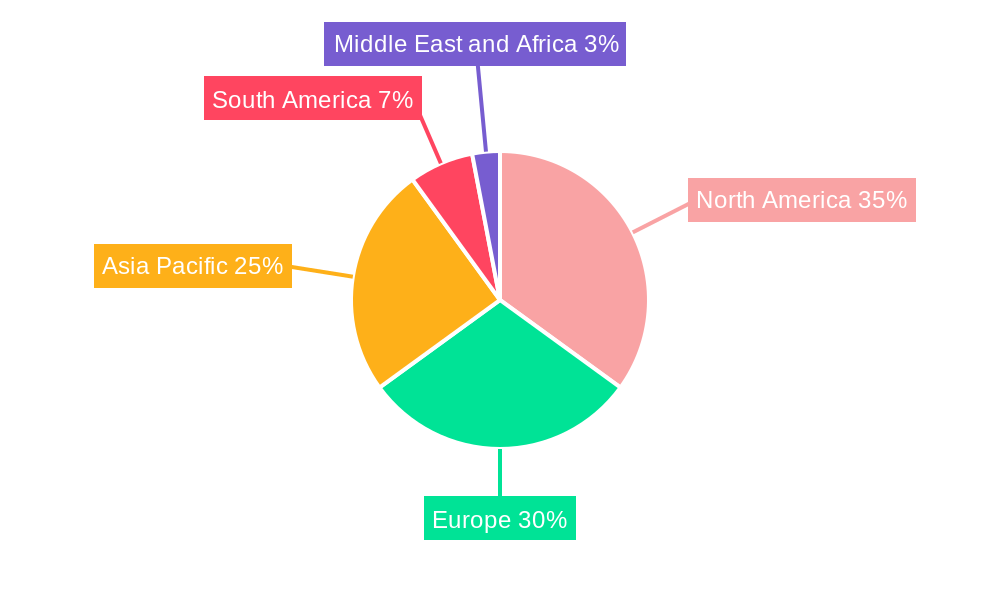
Geographic distribution shows a strong concentration in developed regions like North America and Europe, where healthcare awareness and disposable income are higher. However, emerging markets in Asia-Pacific and South America are demonstrating rapid growth potential, driven by rising middle classes and increased access to healthcare information. Future growth hinges on several factors: continued innovation in supplement formulations (e.g., enhanced bioavailability, personalized nutrition), increased regulatory scrutiny to ensure product quality and safety, and the ongoing exploration of new active ingredients and delivery systems. Understanding consumer preferences and effectively communicating the scientific evidence supporting the efficacy of bone and joint supplements will also be critical for companies aiming to succeed in this dynamic and competitive market.
Bone & Joint Health Supplements Industry Company Market Share
Bone & Joint Health Supplements Industry: A Comprehensive Market Report (2019-2033)
This in-depth report provides a comprehensive analysis of the Bone & Joint Health Supplements industry, covering market size, segmentation, growth drivers, challenges, and key players. The report uses data from 2019-2024 (historical period), estimates for 2025 (estimated year and base year), and projects the market outlook until 2033 (forecast period). The report is essential for industry stakeholders, investors, and businesses seeking to understand and capitalize on the opportunities within this dynamic market, projected to reach xx Million by 2033.
Bone & Joint Health Supplements Industry Market Concentration & Innovation
The Bone & Joint Health Supplements market is moderately concentrated, with several multinational corporations and regional players vying for market share. Key players like Bayer AG, Bayer AG, Amway Corp, Nature's Bounty Inc, Reckitt Benckiser Group plc, Reckitt Benckiser Group plc, and Pfizer Inc, Pfizer Inc, hold significant market share, estimated to collectively account for approximately xx% in 2025. However, a large number of smaller, specialized companies focusing on niche segments (e.g., vegan supplements, liposomal delivery systems) are also emerging.
Innovation within the industry is driven by:
- Technological advancements: Liposomal delivery systems, improved bioavailability of key ingredients (e.g., Vitamin D, Calcium), and the development of novel formulations (e.g., gummies, chewable tablets) are significantly impacting product development.
- Consumer demand for natural and organic products: Growing consumer preference for natural ingredients is driving the development of supplements sourced from natural sources, such as plant-based collagen alternatives.
- Regulatory changes: The evolving regulatory landscape, especially regarding labeling and claims, necessitates continuous innovation to meet compliance requirements and maintain consumer trust.
Mergers and acquisitions (M&A) activity is relatively active in the industry, with larger players acquiring smaller companies to expand their product portfolios and geographical reach. The total value of M&A deals in the historical period (2019-2024) is estimated at xx Million.
Bone & Joint Health Supplements Industry Industry Trends & Insights
The Bone & Joint Health Supplements market is experiencing robust growth, driven by factors such as the aging global population, rising prevalence of osteoarthritis and osteoporosis, increased awareness of the importance of bone and joint health, and changing consumer lifestyles. The compound annual growth rate (CAGR) during the forecast period (2025-2033) is projected to be xx%. Market penetration is increasing across diverse demographics, with significant demand in both developed and developing economies.
Technological advancements are transforming the industry. The adoption of advanced manufacturing processes, including the use of precision fermentation for ingredients, is improving product quality and consistency. Furthermore, the proliferation of e-commerce has broadened market access and boosted sales.
Consumer preferences are evolving towards natural, clean-label products. This shift is shaping product development, with increased demand for supplements with fewer additives, artificial sweeteners, and GMOs. The competitive dynamics involve continuous innovation, strategic partnerships, and aggressive marketing strategies to capture market share.
Dominant Markets & Segments in Bone & Joint Health Supplements Industry
Dominant Region/Country: North America currently holds the largest market share in the bone and joint health supplements industry, followed by Europe and Asia Pacific. The high prevalence of age-related bone and joint diseases, coupled with high consumer spending on health and wellness products, are key drivers.
Dominant Segments:
By Type:
- Glucosamine-Chondroitin: This segment holds a significant share due to its efficacy in treating osteoarthritis symptoms. Increased awareness and physician recommendation fuel demand.
- Collagen: The collagen market is expanding rapidly driven by its diverse applications (beauty, sports nutrition, health supplements), and innovative forms like hydrolyzed collagen and liposomal collagen.
- Calcium and Vitamin D: These remain essential supplements for maintaining bone health, especially in elderly populations. Convenient formulations like gummies are driving growth.
By Distribution Channel:
- Pharmacies: This channel dominates due to the high concentration of health-conscious consumers and the availability of professional consultation.
- Online Stores: The e-commerce channel is rapidly gaining popularity, providing convenience and competitive pricing. Direct-to-consumer brands are thriving in this space.
Key Drivers by Region:
- North America: High disposable income, aging population, and increased awareness of bone health contribute to market dominance.
- Europe: Similar to North America, an aging population and advanced healthcare systems drive demand.
- Asia Pacific: Growing disposable income and rising awareness of health issues in emerging economies are fueling growth.
Bone & Joint Health Supplements Industry Product Developments
Recent product innovations include liposomal collagen supplements, enhanced bioavailability formulations of vitamins and minerals, and gummies aimed at improving palatability and compliance. Many companies focus on clean label, sustainably sourced ingredients, catering to consumer preference for transparency and natural products. These new product developments offer advantages such as improved absorption rates, reduced side effects, and targeted benefits, expanding the market reach and consumer base.
Report Scope & Segmentation Analysis
This report segments the Bone & Joint Health Supplements market by type (Vitamin D, Vitamin K, Calcium, Collagen, Glucosamine-Chondroitin, Omega-3 Fatty Acid, Other Types) and by distribution channel (Supermarkets/Hypermarkets, Pharmacies, Health Stores, Convenience Stores, Online Stores, Other Distribution Channels). Each segment's analysis includes growth projections, market size, and competitive landscape.
For example, the Collagen segment is projected to experience significant growth due to its expanding applications beyond joint health, while the online distribution channel showcases rapid expansion owing to increased consumer preference for convenience and accessibility. The competitive landscape varies across segments and channels, with differing levels of consolidation and intensity of competition.
Key Drivers of Bone & Joint Health Supplements Industry Growth
The Bone & Joint Health Supplements market is fueled by several factors. The aging global population leads to a higher prevalence of age-related bone and joint disorders, increasing demand for preventive and therapeutic supplements. Rising consumer health awareness and the adoption of active lifestyles contribute significantly. Technological advancements in product formulation and delivery systems further enhance the market's growth trajectory. Favorable regulatory environments and government initiatives supporting health and wellness also play a role.
Challenges in the Bone & Joint Health Supplements Industry Sector
Challenges include stringent regulatory requirements regarding product labeling and claims, potentially impacting market entry and product development. Fluctuations in raw material prices can affect production costs and profitability. Intense competition among numerous players, including large multinational corporations and smaller specialized firms, poses a challenge to maintain market share. Consumer skepticism about supplement efficacy also influences market growth.
Emerging Opportunities in Bone & Joint Health Supplements Industry
Emerging opportunities lie in the development of personalized nutrition solutions incorporating genetic testing and AI. Growing demand for sustainable and ethically sourced ingredients presents opportunities for manufacturers. Expanding into untapped markets in developing countries, where the prevalence of bone and joint diseases is high, holds considerable potential. Innovative delivery systems, like nanotechnology-based formulations, promise enhanced absorption and efficacy.
Leading Players in the Bone & Joint Health Supplements Industry Market
- Bayer AG
- BioScience Nutrition
- Amway Corp
- Nature's Bounty Inc
- JSH international LLC
- Vitascience Foods LTDA
- Reckitt Benckiser Group plc
- BIOSTIME NUTRITION (Swisse Wellness PTY LTD)
- The Procter & Gamble Company
- Xtend-Life Group Limited
- Pfizer Inc
Key Developments in Bone & Joint Health Supplements Industry Industry
- July 2022: Infinitus launched a new line of Li Mai Jian supplements for bone and joint health, attracting over 130,000 online views.
- January 2022: Nutrazee launched Calcium and Vitamin D gummies for children and adults in India.
- January 2021: YourZooki launched the first liposomal collagen supplement in the United Kingdom.
Strategic Outlook for Bone & Joint Health Supplements Industry Market
The Bone & Joint Health Supplements market is poised for significant growth driven by a confluence of factors, including an aging population, rising health awareness, technological advancements, and evolving consumer preferences. Strategic investments in research and development, product innovation, and targeted marketing initiatives will be key to success. Expansion into emerging markets and the adoption of personalized nutrition approaches will offer significant opportunities. The market will witness a continued trend towards natural, clean-label products with demonstrable efficacy.
Bone & Joint Health Supplements Industry Segmentation
-
1. Type
- 1.1. Vitamin D
- 1.2. Vitamin K
- 1.3. Calcium
- 1.4. Collagen
- 1.5. Glucosamine-Chondroitin
- 1.6. Omega-3 Fatty Acid
- 1.7. Other Types
-
2. Distribution Channel
- 2.1. Supermarkets/Hypermarkets
- 2.2. Pharmacies
- 2.3. Health Stores
- 2.4. Convenience Stores
- 2.5. Online Stores
- 2.6. Other Distribution Channels
Bone & Joint Health Supplements Industry Segmentation By Geography
-
1. North America
- 1.1. United States
- 1.2. Canada
- 1.3. Mexico
- 1.4. Rest of North America
-
2. Europe
- 2.1. Spain
- 2.2. United Kingdom
- 2.3. France
- 2.4. Germany
- 2.5. Russia
- 2.6. Italy
- 2.7. Rest of Europe
-
3. Asia Pacific
- 3.1. China
- 3.2. Japan
- 3.3. Australia
- 3.4. India
- 3.5. Rest of Asia Pacific
-
4. South America
- 4.1. Brazil
- 4.2. Argentina
- 4.3. Rest of South America
-
5. Middle East and Africa
- 5.1. South Africa
- 5.2. United Arab Emirates
- 5.3. Rest of Middle East and Africa
Bone & Joint Health Supplements Industry Regional Market Share
Geographic Coverage of Bone & Joint Health Supplements Industry
Bone & Joint Health Supplements Industry REPORT HIGHLIGHTS
| Aspects | Details |
|---|---|
| Study Period | 2020-2034 |
| Base Year | 2025 |
| Estimated Year | 2026 |
| Forecast Period | 2026-2034 |
| Historical Period | 2020-2025 |
| Growth Rate | CAGR of 7.5% from 2020-2034 |
| Segmentation |
|
Table of Contents
- 1. Introduction
- 1.1. Research Scope
- 1.2. Market Segmentation
- 1.3. Research Objective
- 1.4. Definitions and Assumptions
- 2. Executive Summary
- 2.1. Market Snapshot
- 3. Market Dynamics
- 3.1. Market Drivers
- 3.2. Market Restrains
- 3.3. Market Trends
- 3.4. Market Opportunities
- 4. Market Factor Analysis
- 4.1. Porters Five Forces
- 4.1.1. Bargaining Power of Suppliers
- 4.1.2. Bargaining Power of Buyers
- 4.1.3. Threat of New Entrants
- 4.1.4. Threat of Substitutes
- 4.1.5. Competitive Rivalry
- 4.2. PESTEL analysis
- 4.3. BCG Analysis
- 4.3.1. Stars (High Growth, High Market Share)
- 4.3.2. Cash Cows (Low Growth, High Market Share)
- 4.3.3. Question Mark (High Growth, Low Market Share)
- 4.3.4. Dogs (Low Growth, Low Market Share)
- 4.4. Ansoff Matrix Analysis
- 4.5. Supply Chain Analysis
- 4.6. Regulatory Landscape
- 4.7. Current Market Potential and Opportunity Assessment (TAM–SAM–SOM Framework)
- 4.8. RAX Analyst Note
- 4.1. Porters Five Forces
- 5. Market Analysis, Insights and Forecast 2021-2033
- 5.1. Market Analysis, Insights and Forecast - by Type
- 5.1.1. Vitamin D
- 5.1.2. Vitamin K
- 5.1.3. Calcium
- 5.1.4. Collagen
- 5.1.5. Glucosamine-Chondroitin
- 5.1.6. Omega-3 Fatty Acid
- 5.1.7. Other Types
- 5.2. Market Analysis, Insights and Forecast - by Distribution Channel
- 5.2.1. Supermarkets/Hypermarkets
- 5.2.2. Pharmacies
- 5.2.3. Health Stores
- 5.2.4. Convenience Stores
- 5.2.5. Online Stores
- 5.2.6. Other Distribution Channels
- 5.3. Market Analysis, Insights and Forecast - by Region
- 5.3.1. North America
- 5.3.2. Europe
- 5.3.3. Asia Pacific
- 5.3.4. South America
- 5.3.5. Middle East and Africa
- 5.1. Market Analysis, Insights and Forecast - by Type
- 6. Global Bone & Joint Health Supplements Industry Analysis, Insights and Forecast, 2021-2033
- 6.1. Market Analysis, Insights and Forecast - by Type
- 6.1.1. Vitamin D
- 6.1.2. Vitamin K
- 6.1.3. Calcium
- 6.1.4. Collagen
- 6.1.5. Glucosamine-Chondroitin
- 6.1.6. Omega-3 Fatty Acid
- 6.1.7. Other Types
- 6.2. Market Analysis, Insights and Forecast - by Distribution Channel
- 6.2.1. Supermarkets/Hypermarkets
- 6.2.2. Pharmacies
- 6.2.3. Health Stores
- 6.2.4. Convenience Stores
- 6.2.5. Online Stores
- 6.2.6. Other Distribution Channels
- 6.1. Market Analysis, Insights and Forecast - by Type
- 7. North America Bone & Joint Health Supplements Industry Analysis, Insights and Forecast, 2020-2032
- 7.1. Market Analysis, Insights and Forecast - by Type
- 7.1.1. Vitamin D
- 7.1.2. Vitamin K
- 7.1.3. Calcium
- 7.1.4. Collagen
- 7.1.5. Glucosamine-Chondroitin
- 7.1.6. Omega-3 Fatty Acid
- 7.1.7. Other Types
- 7.2. Market Analysis, Insights and Forecast - by Distribution Channel
- 7.2.1. Supermarkets/Hypermarkets
- 7.2.2. Pharmacies
- 7.2.3. Health Stores
- 7.2.4. Convenience Stores
- 7.2.5. Online Stores
- 7.2.6. Other Distribution Channels
- 7.1. Market Analysis, Insights and Forecast - by Type
- 8. Europe Bone & Joint Health Supplements Industry Analysis, Insights and Forecast, 2020-2032
- 8.1. Market Analysis, Insights and Forecast - by Type
- 8.1.1. Vitamin D
- 8.1.2. Vitamin K
- 8.1.3. Calcium
- 8.1.4. Collagen
- 8.1.5. Glucosamine-Chondroitin
- 8.1.6. Omega-3 Fatty Acid
- 8.1.7. Other Types
- 8.2. Market Analysis, Insights and Forecast - by Distribution Channel
- 8.2.1. Supermarkets/Hypermarkets
- 8.2.2. Pharmacies
- 8.2.3. Health Stores
- 8.2.4. Convenience Stores
- 8.2.5. Online Stores
- 8.2.6. Other Distribution Channels
- 8.1. Market Analysis, Insights and Forecast - by Type
- 9. Asia Pacific Bone & Joint Health Supplements Industry Analysis, Insights and Forecast, 2020-2032
- 9.1. Market Analysis, Insights and Forecast - by Type
- 9.1.1. Vitamin D
- 9.1.2. Vitamin K
- 9.1.3. Calcium
- 9.1.4. Collagen
- 9.1.5. Glucosamine-Chondroitin
- 9.1.6. Omega-3 Fatty Acid
- 9.1.7. Other Types
- 9.2. Market Analysis, Insights and Forecast - by Distribution Channel
- 9.2.1. Supermarkets/Hypermarkets
- 9.2.2. Pharmacies
- 9.2.3. Health Stores
- 9.2.4. Convenience Stores
- 9.2.5. Online Stores
- 9.2.6. Other Distribution Channels
- 9.1. Market Analysis, Insights and Forecast - by Type
- 10. South America Bone & Joint Health Supplements Industry Analysis, Insights and Forecast, 2020-2032
- 10.1. Market Analysis, Insights and Forecast - by Type
- 10.1.1. Vitamin D
- 10.1.2. Vitamin K
- 10.1.3. Calcium
- 10.1.4. Collagen
- 10.1.5. Glucosamine-Chondroitin
- 10.1.6. Omega-3 Fatty Acid
- 10.1.7. Other Types
- 10.2. Market Analysis, Insights and Forecast - by Distribution Channel
- 10.2.1. Supermarkets/Hypermarkets
- 10.2.2. Pharmacies
- 10.2.3. Health Stores
- 10.2.4. Convenience Stores
- 10.2.5. Online Stores
- 10.2.6. Other Distribution Channels
- 10.1. Market Analysis, Insights and Forecast - by Type
- 11. Middle East and Africa Bone & Joint Health Supplements Industry Analysis, Insights and Forecast, 2020-2032
- 11.1. Market Analysis, Insights and Forecast - by Type
- 11.1.1. Vitamin D
- 11.1.2. Vitamin K
- 11.1.3. Calcium
- 11.1.4. Collagen
- 11.1.5. Glucosamine-Chondroitin
- 11.1.6. Omega-3 Fatty Acid
- 11.1.7. Other Types
- 11.2. Market Analysis, Insights and Forecast - by Distribution Channel
- 11.2.1. Supermarkets/Hypermarkets
- 11.2.2. Pharmacies
- 11.2.3. Health Stores
- 11.2.4. Convenience Stores
- 11.2.5. Online Stores
- 11.2.6. Other Distribution Channels
- 11.1. Market Analysis, Insights and Forecast - by Type
- 12. Competitive Analysis
- 12.1. Company Profiles
- 12.1.1 Bayer AG
- 12.1.1.1. Company Overview
- 12.1.1.2. Products
- 12.1.1.3. Company Financials
- 12.1.1.4. SWOT Analysis
- 12.1.2 BioScience Nutrition
- 12.1.2.1. Company Overview
- 12.1.2.2. Products
- 12.1.2.3. Company Financials
- 12.1.2.4. SWOT Analysis
- 12.1.3 Amway Corp
- 12.1.3.1. Company Overview
- 12.1.3.2. Products
- 12.1.3.3. Company Financials
- 12.1.3.4. SWOT Analysis
- 12.1.4 Nature's Bounty Inc
- 12.1.4.1. Company Overview
- 12.1.4.2. Products
- 12.1.4.3. Company Financials
- 12.1.4.4. SWOT Analysis
- 12.1.5 JSH international LLC
- 12.1.5.1. Company Overview
- 12.1.5.2. Products
- 12.1.5.3. Company Financials
- 12.1.5.4. SWOT Analysis
- 12.1.6 Vitascience Foods LTDA
- 12.1.6.1. Company Overview
- 12.1.6.2. Products
- 12.1.6.3. Company Financials
- 12.1.6.4. SWOT Analysis
- 12.1.7 Reckitt Benckiser Group plc
- 12.1.7.1. Company Overview
- 12.1.7.2. Products
- 12.1.7.3. Company Financials
- 12.1.7.4. SWOT Analysis
- 12.1.8 BIOSTIME NUTRITION (Swisse Wellness PTY LTD)*List Not Exhaustive
- 12.1.8.1. Company Overview
- 12.1.8.2. Products
- 12.1.8.3. Company Financials
- 12.1.8.4. SWOT Analysis
- 12.1.9 The Procter & Gamble Company
- 12.1.9.1. Company Overview
- 12.1.9.2. Products
- 12.1.9.3. Company Financials
- 12.1.9.4. SWOT Analysis
- 12.1.10 Xtend-Life Group Limited
- 12.1.10.1. Company Overview
- 12.1.10.2. Products
- 12.1.10.3. Company Financials
- 12.1.10.4. SWOT Analysis
- 12.1.11 Pfizer Inc
- 12.1.11.1. Company Overview
- 12.1.11.2. Products
- 12.1.11.3. Company Financials
- 12.1.11.4. SWOT Analysis
- 12.1.1 Bayer AG
- 12.2. Market Entropy
- 12.2.1 Company's Key Areas Served
- 12.2.2 Recent Developments
- 12.3. Company Market Share Analysis 2025
- 12.3.1 Top 5 Companies Market Share Analysis
- 12.3.2 Top 3 Companies Market Share Analysis
- 12.4. List of Potential Customers
- 13. Research Methodology
List of Figures
- Figure 1: Global Bone & Joint Health Supplements Industry Revenue Breakdown (billion, %) by Region 2025 & 2033
- Figure 2: North America Bone & Joint Health Supplements Industry Revenue (billion), by Type 2025 & 2033
- Figure 3: North America Bone & Joint Health Supplements Industry Revenue Share (%), by Type 2025 & 2033
- Figure 4: North America Bone & Joint Health Supplements Industry Revenue (billion), by Distribution Channel 2025 & 2033
- Figure 5: North America Bone & Joint Health Supplements Industry Revenue Share (%), by Distribution Channel 2025 & 2033
- Figure 6: North America Bone & Joint Health Supplements Industry Revenue (billion), by Country 2025 & 2033
- Figure 7: North America Bone & Joint Health Supplements Industry Revenue Share (%), by Country 2025 & 2033
- Figure 8: Europe Bone & Joint Health Supplements Industry Revenue (billion), by Type 2025 & 2033
- Figure 9: Europe Bone & Joint Health Supplements Industry Revenue Share (%), by Type 2025 & 2033
- Figure 10: Europe Bone & Joint Health Supplements Industry Revenue (billion), by Distribution Channel 2025 & 2033
- Figure 11: Europe Bone & Joint Health Supplements Industry Revenue Share (%), by Distribution Channel 2025 & 2033
- Figure 12: Europe Bone & Joint Health Supplements Industry Revenue (billion), by Country 2025 & 2033
- Figure 13: Europe Bone & Joint Health Supplements Industry Revenue Share (%), by Country 2025 & 2033
- Figure 14: Asia Pacific Bone & Joint Health Supplements Industry Revenue (billion), by Type 2025 & 2033
- Figure 15: Asia Pacific Bone & Joint Health Supplements Industry Revenue Share (%), by Type 2025 & 2033
- Figure 16: Asia Pacific Bone & Joint Health Supplements Industry Revenue (billion), by Distribution Channel 2025 & 2033
- Figure 17: Asia Pacific Bone & Joint Health Supplements Industry Revenue Share (%), by Distribution Channel 2025 & 2033
- Figure 18: Asia Pacific Bone & Joint Health Supplements Industry Revenue (billion), by Country 2025 & 2033
- Figure 19: Asia Pacific Bone & Joint Health Supplements Industry Revenue Share (%), by Country 2025 & 2033
- Figure 20: South America Bone & Joint Health Supplements Industry Revenue (billion), by Type 2025 & 2033
- Figure 21: South America Bone & Joint Health Supplements Industry Revenue Share (%), by Type 2025 & 2033
- Figure 22: South America Bone & Joint Health Supplements Industry Revenue (billion), by Distribution Channel 2025 & 2033
- Figure 23: South America Bone & Joint Health Supplements Industry Revenue Share (%), by Distribution Channel 2025 & 2033
- Figure 24: South America Bone & Joint Health Supplements Industry Revenue (billion), by Country 2025 & 2033
- Figure 25: South America Bone & Joint Health Supplements Industry Revenue Share (%), by Country 2025 & 2033
- Figure 26: Middle East and Africa Bone & Joint Health Supplements Industry Revenue (billion), by Type 2025 & 2033
- Figure 27: Middle East and Africa Bone & Joint Health Supplements Industry Revenue Share (%), by Type 2025 & 2033
- Figure 28: Middle East and Africa Bone & Joint Health Supplements Industry Revenue (billion), by Distribution Channel 2025 & 2033
- Figure 29: Middle East and Africa Bone & Joint Health Supplements Industry Revenue Share (%), by Distribution Channel 2025 & 2033
- Figure 30: Middle East and Africa Bone & Joint Health Supplements Industry Revenue (billion), by Country 2025 & 2033
- Figure 31: Middle East and Africa Bone & Joint Health Supplements Industry Revenue Share (%), by Country 2025 & 2033
List of Tables
- Table 1: Global Bone & Joint Health Supplements Industry Revenue billion Forecast, by Type 2020 & 2033
- Table 2: Global Bone & Joint Health Supplements Industry Revenue billion Forecast, by Distribution Channel 2020 & 2033
- Table 3: Global Bone & Joint Health Supplements Industry Revenue billion Forecast, by Region 2020 & 2033
- Table 4: Global Bone & Joint Health Supplements Industry Revenue billion Forecast, by Type 2020 & 2033
- Table 5: Global Bone & Joint Health Supplements Industry Revenue billion Forecast, by Distribution Channel 2020 & 2033
- Table 6: Global Bone & Joint Health Supplements Industry Revenue billion Forecast, by Country 2020 & 2033
- Table 7: United States Bone & Joint Health Supplements Industry Revenue (billion) Forecast, by Application 2020 & 2033
- Table 8: Canada Bone & Joint Health Supplements Industry Revenue (billion) Forecast, by Application 2020 & 2033
- Table 9: Mexico Bone & Joint Health Supplements Industry Revenue (billion) Forecast, by Application 2020 & 2033
- Table 10: Rest of North America Bone & Joint Health Supplements Industry Revenue (billion) Forecast, by Application 2020 & 2033
- Table 11: Global Bone & Joint Health Supplements Industry Revenue billion Forecast, by Type 2020 & 2033
- Table 12: Global Bone & Joint Health Supplements Industry Revenue billion Forecast, by Distribution Channel 2020 & 2033
- Table 13: Global Bone & Joint Health Supplements Industry Revenue billion Forecast, by Country 2020 & 2033
- Table 14: Spain Bone & Joint Health Supplements Industry Revenue (billion) Forecast, by Application 2020 & 2033
- Table 15: United Kingdom Bone & Joint Health Supplements Industry Revenue (billion) Forecast, by Application 2020 & 2033
- Table 16: France Bone & Joint Health Supplements Industry Revenue (billion) Forecast, by Application 2020 & 2033
- Table 17: Germany Bone & Joint Health Supplements Industry Revenue (billion) Forecast, by Application 2020 & 2033
- Table 18: Russia Bone & Joint Health Supplements Industry Revenue (billion) Forecast, by Application 2020 & 2033
- Table 19: Italy Bone & Joint Health Supplements Industry Revenue (billion) Forecast, by Application 2020 & 2033
- Table 20: Rest of Europe Bone & Joint Health Supplements Industry Revenue (billion) Forecast, by Application 2020 & 2033
- Table 21: Global Bone & Joint Health Supplements Industry Revenue billion Forecast, by Type 2020 & 2033
- Table 22: Global Bone & Joint Health Supplements Industry Revenue billion Forecast, by Distribution Channel 2020 & 2033
- Table 23: Global Bone & Joint Health Supplements Industry Revenue billion Forecast, by Country 2020 & 2033
- Table 24: China Bone & Joint Health Supplements Industry Revenue (billion) Forecast, by Application 2020 & 2033
- Table 25: Japan Bone & Joint Health Supplements Industry Revenue (billion) Forecast, by Application 2020 & 2033
- Table 26: Australia Bone & Joint Health Supplements Industry Revenue (billion) Forecast, by Application 2020 & 2033
- Table 27: India Bone & Joint Health Supplements Industry Revenue (billion) Forecast, by Application 2020 & 2033
- Table 28: Rest of Asia Pacific Bone & Joint Health Supplements Industry Revenue (billion) Forecast, by Application 2020 & 2033
- Table 29: Global Bone & Joint Health Supplements Industry Revenue billion Forecast, by Type 2020 & 2033
- Table 30: Global Bone & Joint Health Supplements Industry Revenue billion Forecast, by Distribution Channel 2020 & 2033
- Table 31: Global Bone & Joint Health Supplements Industry Revenue billion Forecast, by Country 2020 & 2033
- Table 32: Brazil Bone & Joint Health Supplements Industry Revenue (billion) Forecast, by Application 2020 & 2033
- Table 33: Argentina Bone & Joint Health Supplements Industry Revenue (billion) Forecast, by Application 2020 & 2033
- Table 34: Rest of South America Bone & Joint Health Supplements Industry Revenue (billion) Forecast, by Application 2020 & 2033
- Table 35: Global Bone & Joint Health Supplements Industry Revenue billion Forecast, by Type 2020 & 2033
- Table 36: Global Bone & Joint Health Supplements Industry Revenue billion Forecast, by Distribution Channel 2020 & 2033
- Table 37: Global Bone & Joint Health Supplements Industry Revenue billion Forecast, by Country 2020 & 2033
- Table 38: South Africa Bone & Joint Health Supplements Industry Revenue (billion) Forecast, by Application 2020 & 2033
- Table 39: United Arab Emirates Bone & Joint Health Supplements Industry Revenue (billion) Forecast, by Application 2020 & 2033
- Table 40: Rest of Middle East and Africa Bone & Joint Health Supplements Industry Revenue (billion) Forecast, by Application 2020 & 2033
Frequently Asked Questions
1. What is the projected Compound Annual Growth Rate (CAGR) of the Bone & Joint Health Supplements Industry?
The projected CAGR is approximately 7.5%.
2. Which companies are prominent players in the Bone & Joint Health Supplements Industry?
Key companies in the market include Bayer AG, BioScience Nutrition, Amway Corp, Nature's Bounty Inc, JSH international LLC, Vitascience Foods LTDA, Reckitt Benckiser Group plc, BIOSTIME NUTRITION (Swisse Wellness PTY LTD)*List Not Exhaustive, The Procter & Gamble Company, Xtend-Life Group Limited, Pfizer Inc.
3. What are the main segments of the Bone & Joint Health Supplements Industry?
The market segments include Type, Distribution Channel.
4. Can you provide details about the market size?
The market size is estimated to be USD 13.6 billion as of 2022.
5. What are some drivers contributing to market growth?
Increasing Incidences of Food Allergies; Favorable Government Initiatives and Regulations for Food Safety.
6. What are the notable trends driving market growth?
Significant Volume of Demand Solely from the Ageing Population.
7. Are there any restraints impacting market growth?
Inconsistencies Involved in Food Allergen Declarations.
8. Can you provide examples of recent developments in the market?
In July 2022, Infinitus, a well-known supplier of premium Chinese herbal health goods and services, unveiled a new line of Li Mai Jian supplements for bone and joint health. The theme of the new product launch included Making Bones Stronger for Joint Health, which was held the same evening of the launch online and attracted more than 130,000 views.
9. What pricing options are available for accessing the report?
Pricing options include single-user, multi-user, and enterprise licenses priced at USD 4750, USD 5250, and USD 8750 respectively.
10. Is the market size provided in terms of value or volume?
The market size is provided in terms of value, measured in billion.
11. Are there any specific market keywords associated with the report?
Yes, the market keyword associated with the report is "Bone & Joint Health Supplements Industry," which aids in identifying and referencing the specific market segment covered.
12. How do I determine which pricing option suits my needs best?
The pricing options vary based on user requirements and access needs. Individual users may opt for single-user licenses, while businesses requiring broader access may choose multi-user or enterprise licenses for cost-effective access to the report.
13. Are there any additional resources or data provided in the Bone & Joint Health Supplements Industry report?
While the report offers comprehensive insights, it's advisable to review the specific contents or supplementary materials provided to ascertain if additional resources or data are available.
14. How can I stay updated on further developments or reports in the Bone & Joint Health Supplements Industry?
To stay informed about further developments, trends, and reports in the Bone & Joint Health Supplements Industry, consider subscribing to industry newsletters, following relevant companies and organizations, or regularly checking reputable industry news sources and publications.
Methodology
Step 1 - Identification of Relevant Samples Size from Population Database


Step 2 - Approaches for Defining Global Market Size (Value, Volume* & Price*)

Note*: In applicable scenarios
Step 3 - Data Sources
Primary Research
- Web Analytics
- Survey Reports
- Research Institute
- Latest Research Reports
- Opinion Leaders
Secondary Research
- Annual Reports
- White Paper
- Latest Press Release
- Industry Association
- Paid Database
- Investor Presentations

Step 4 - Data Triangulation
Involves using different sources of information in order to increase the validity of a study
These sources are likely to be stakeholders in a program - participants, other researchers, program staff, other community members, and so on.
Then we put all data in single framework & apply various statistical tools to find out the dynamic on the market.
During the analysis stage, feedback from the stakeholder groups would be compared to determine areas of agreement as well as areas of divergence