

Key Insights
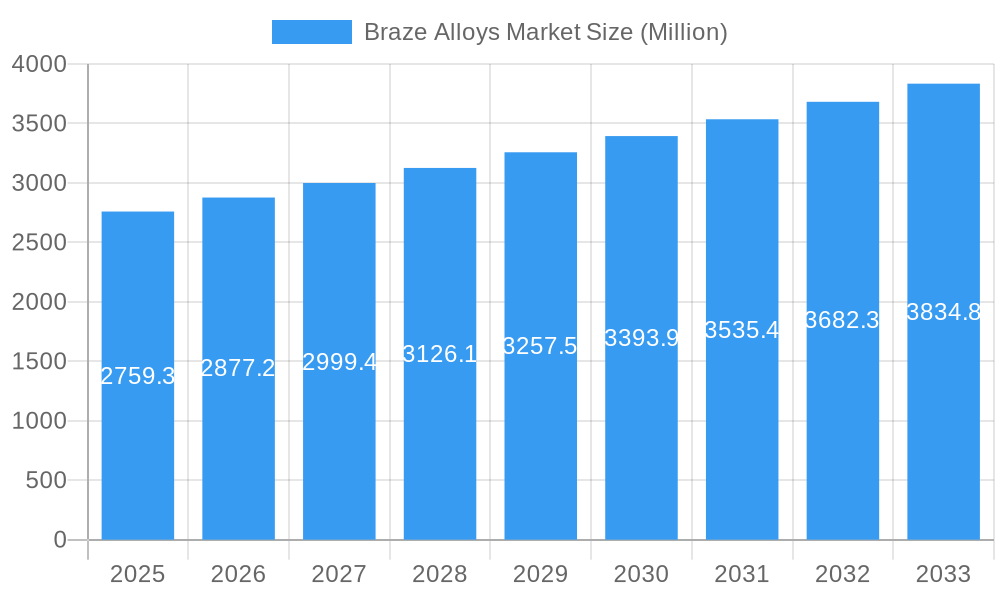
The global braze alloys market, valued at $2759.3 million in 2025, is projected to experience robust growth, driven by a compound annual growth rate (CAGR) exceeding 4.00% from 2025 to 2033. This expansion is fueled by several key factors. The burgeoning automotive and aerospace industries are major consumers of braze alloys, demanding high-performance materials for lightweighting and improved component reliability. The increasing adoption of electronics and the growth of the construction sector further contribute to market demand. Advancements in brazing technologies, leading to improved joint strength and reduced processing times, are also stimulating market growth. Specific alloy types like copper, aluminum, and nickel-based braze alloys are experiencing particularly high demand due to their superior properties in diverse applications. Furthermore, the growing emphasis on sustainable manufacturing practices is influencing the market, driving demand for environmentally friendly braze alloys and encouraging innovation in recycling and material efficiency.
Braze Alloys Market Market Size (In Billion)
However, the market faces some challenges. Fluctuations in the prices of base metals, like copper and nickel, can impact production costs and profitability. The availability of skilled labor for brazing operations and potential regulatory restrictions on certain alloy compositions might pose restraints. Nevertheless, the long-term outlook for the braze alloys market remains positive, supported by the continued expansion of end-use sectors and the development of innovative brazing techniques. Geographic growth is expected to be particularly strong in the Asia-Pacific region, driven by significant industrialization and infrastructure development in countries like China and India. Competitive dynamics are characterized by a mix of established multinational corporations and specialized regional manufacturers, fostering innovation and competition within the market.
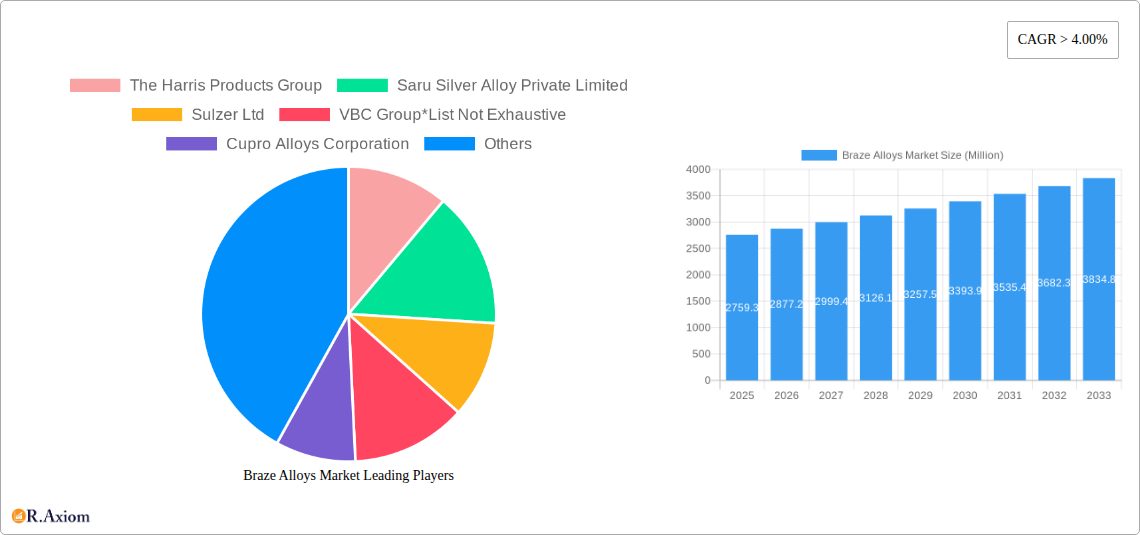
Braze Alloys Market Company Market Share
Braze Alloys Market: A Comprehensive Analysis (2019-2033)
This in-depth report provides a comprehensive analysis of the global braze alloys market, offering invaluable insights for stakeholders across the value chain. Covering the period 2019-2033, with a focus on 2025, this study meticulously examines market dynamics, growth drivers, competitive landscapes, and future opportunities. The report leverages extensive primary and secondary research, incorporating data from leading industry players and subject matter experts. Key market segments, including base metals (copper, gold, silver, aluminum, and others) and end-user industries (automotive, aerospace & defense, electrical & electronics, construction, and others) are thoroughly analyzed, providing actionable intelligence for strategic decision-making.
Braze Alloys Market Market Concentration & Innovation
The global braze alloys market exhibits a moderately concentrated landscape, with several key players holding significant market share. The Harris Products Group, Sulzer Ltd, and Morgan Advanced Materials are among the prominent companies shaping the market dynamics. However, a considerable number of smaller players, including regional specialists, contribute to the overall market volume. Market share data for 2025 estimates that The Harris Products Group holds approximately 15% market share, followed by Sulzer Ltd at 12% and Morgan Advanced Materials at 10%. The remaining 63% is distributed among numerous smaller players.
Innovation within the braze alloys sector is primarily driven by the increasing demand for high-performance materials, particularly lead-free options. Significant R&D investments are focused on developing alloys with improved strength, thermal conductivity, and corrosion resistance. The adoption of robotic brazing technology is also contributing to significant advancements, enabling greater precision, consistency, and efficiency in brazing applications.
Regulatory frameworks, particularly those concerning environmental compliance and material safety, play a crucial role in shaping market trends. The stringent regulations surrounding lead and other hazardous materials are accelerating the adoption of eco-friendly alternatives. Product substitutes, such as adhesives and welding techniques, pose competitive challenges, while end-user trends towards lightweighting and miniaturization in various industries are influencing the demand for specific braze alloy compositions.
Mergers and acquisitions (M&A) activities in the braze alloys market have been relatively moderate in recent years. However, the total value of M&A deals involving braze alloy manufacturers during the period 2019-2024 is estimated to be approximately $xx Million. These activities often aim to expand product portfolios, enhance geographical reach, and consolidate market share.
Braze Alloys Market Industry Trends & Insights
The braze alloys market is experiencing robust growth, driven by several key factors. The increasing demand from diverse end-user sectors, such as automotive, aerospace, and electronics, is a significant catalyst. The automotive industry's push for lightweight vehicles and the electronics industry's demand for miniaturized components are driving the adoption of braze alloys with superior properties. Technological advancements in brazing processes, such as laser brazing and induction brazing, enhance efficiency and quality, further fueling market expansion. The global braze alloys market is projected to register a Compound Annual Growth Rate (CAGR) of approximately 6% during the forecast period (2025-2033). Market penetration is gradually increasing in emerging economies, particularly in Asia-Pacific, where infrastructure development and industrialization are significant drivers. The adoption of lead-free brazing alloys is rapidly increasing, with a market penetration of around 35% in 2025, expected to rise to over 60% by 2033.
Consumer preferences for higher quality and more reliable products are influencing the demand for advanced braze alloys. The increasing emphasis on sustainability and environmental compliance is also shaping the market, with a growing demand for environmentally friendly, lead-free brazing materials.
Competitive dynamics are characterized by both intense competition among established players and the emergence of new entrants offering niche solutions. Product differentiation and innovation play crucial roles in securing market share.
Dominant Markets & Segments in Braze Alloys Market
The Asia-Pacific region, particularly China and India, is currently the dominant market for braze alloys. The region's rapid industrialization, growing automotive sector, and expanding electronics manufacturing capabilities are significant factors in driving this dominance. Within the base metals segment, copper holds the largest market share, owing to its excellent thermal and electrical conductivity, along with its cost-effectiveness.
- Key Drivers in Asia-Pacific:
- Rapid industrialization and urbanization.
- Strong growth in the automotive and electronics sectors.
- Increasing investments in infrastructure development.
- Favorable government policies promoting industrial growth.
The automotive industry remains the largest end-user segment for braze alloys, driven by the increasing adoption of advanced driver-assistance systems (ADAS) and the growing demand for electric vehicles (EVs). The aerospace and defense industry is another significant end-user segment, with braze alloys playing a vital role in the manufacturing of high-performance aircraft components and defense systems.
- Key Drivers in the Automotive Segment:
- Growth in vehicle production.
- Increasing demand for lightweight vehicles.
- Adoption of advanced technologies (ADAS, EVs).
- Stringent emission regulations.
Braze Alloys Market Product Developments
Recent product innovations focus on developing lead-free braze alloys with enhanced mechanical properties, improved corrosion resistance, and better thermal conductivity. The introduction of high-strength, low-temperature braze alloys expands application possibilities in various industries. Technological trends highlight the increasing use of advanced brazing techniques like laser and ultrasonic brazing, further enhancing the efficiency and precision of the process. These innovations cater to the market's demand for lighter, stronger, and more reliable components in high-performance applications. The improved market fit addresses the growing need for environmentally friendly, high-performance solutions across various sectors.
Report Scope & Segmentation Analysis
This report segments the braze alloys market by base metal (copper, gold, silver, aluminum, and other base metals) and end-user industry (automotive, aerospace and defense, electrical and electronics, construction, and other end-user industries). Each segment's growth projections, market size, and competitive dynamics are thoroughly analyzed. The copper segment dominates owing to its cost-effectiveness and excellent properties. The automotive sector is the largest end-user industry, followed by the electronics and aerospace sectors. The market is characterized by moderate competition among established players and emerging niche players.
Key Drivers of Braze Alloys Market Growth
The braze alloys market's growth is driven by several interconnected factors. The expansion of the automotive, aerospace, and electronics industries significantly impacts demand for these materials. Technological advancements such as robotic brazing and laser brazing enhance efficiency and precision, while the growing adoption of lead-free alloys reflects the increased focus on environmental regulations and sustainability. Government regulations favoring lead-free materials also propel market expansion.
Challenges in the Braze Alloys Market Sector
The braze alloys market faces certain challenges. Fluctuations in raw material prices, especially for precious metals like gold and silver, impact production costs and profitability. Stringent environmental regulations pose additional hurdles for manufacturers, requiring investments in compliance and eco-friendly technologies. Intense competition among established players and the emergence of new technologies, such as advanced adhesive systems, create competitive pressure, requiring continuous innovation to maintain market share. Supply chain disruptions can also influence product availability and pricing.
Emerging Opportunities in Braze Alloys Market
Emerging opportunities arise from the growing demand for lightweighting in various sectors. The development of advanced alloys with enhanced properties, such as higher strength and better corrosion resistance, provides significant opportunities. The increasing adoption of advanced brazing techniques like laser brazing opens doors for higher precision and efficiency, while expanding into new end-user industries, such as medical devices and renewable energy, creates further growth potential.
Leading Players in the Braze Alloys Market Market
- The Harris Products Group
- Saru Silver Alloy Private Limited
- Sulzer Ltd
- VBC Group
- Cupro Alloys Corporation
- Morgan Advanced Materials
- OC Oerlikon Management AG (Oerlikon Metco)
- Johnson Matthey
- Aimtek Inc
- Prince Izant Company (Bellman-Melcor)
- Indian Solder and Brazing Alloys
- Lucas-Milhaupt Inc
Key Developments in Braze Alloys Market Industry
- 2022 Q3: Morgan Advanced Materials launched a new line of lead-free braze alloys designed for high-temperature applications.
- 2021 Q4: Sulzer Ltd. acquired a smaller brazing technology company, expanding its portfolio and market reach.
- 2020 Q1: Increased demand for lead-free brazing materials led to several new product launches by various manufacturers.
- 2019-2024: The growing popularity of robotic brazing led to significant investments in automation technologies by several key players.
Strategic Outlook for Braze Alloys Market Market
The future of the braze alloys market appears promising, driven by strong growth in key end-user sectors and technological innovations. The continued demand for lightweighting, high-performance materials, and environmentally friendly solutions will create opportunities for growth. Investments in R&D and strategic partnerships will be key factors in securing market share and driving future success. Expansion into emerging markets and the adoption of advanced manufacturing technologies will be crucial for long-term growth and profitability.
Braze Alloys Market Segmentation
-
1. Base Metal
- 1.1. Copper
- 1.2. Gold
- 1.3. Silver
- 1.4. Aluminum
- 1.5. Other Base Metals
-
2. End-user Industry
- 2.1. Automotive
- 2.2. Aerospace and Defense
- 2.3. Electrical and Electronics
- 2.4. Construction
- 2.5. Other End-user Industries
Braze Alloys Market Segmentation By Geography
-
1. Asia Pacific
- 1.1. China
- 1.2. India
- 1.3. Japan
- 1.4. South Korea
- 1.5. Rest of Asia Pacific
-
2. North America
- 2.1. United States
- 2.2. Canada
- 2.3. Mexico
-
3. Europe
- 3.1. Germany
- 3.2. United Kingdom
- 3.3. Italy
- 3.4. France
- 3.5. Spain
- 3.6. Rest of Europe
-
4. South America
- 4.1. Brazil
- 4.2. Argentina
- 4.3. Rest of South America
-
5. Middle East and Africa
- 5.1. Saudi Arabia
- 5.2. South Africa
- 5.3. Rest of Middle East and Africa
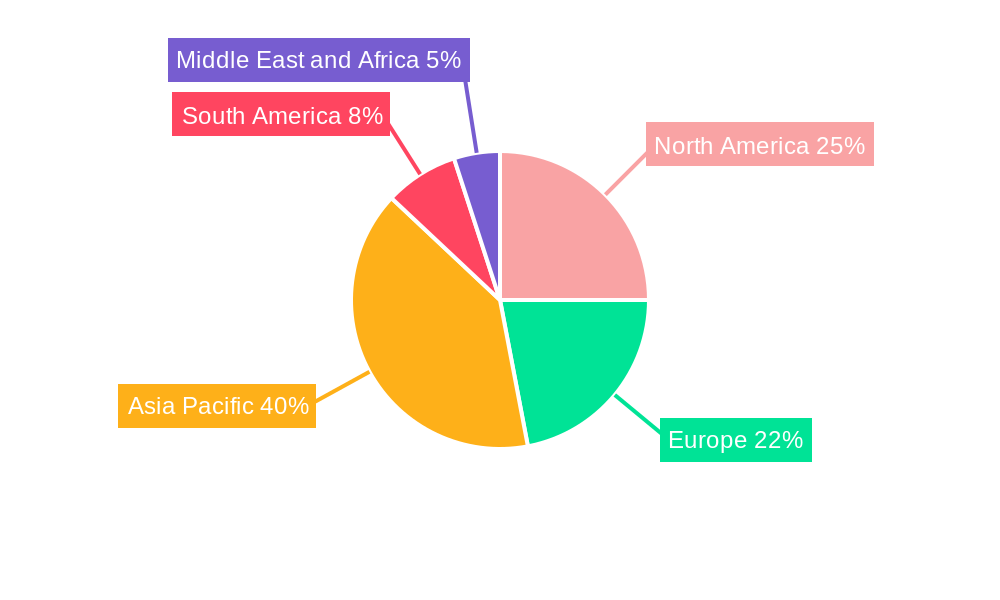
Braze Alloys Market Regional Market Share
Geographic Coverage of Braze Alloys Market
Braze Alloys Market REPORT HIGHLIGHTS
| Aspects | Details |
|---|---|
| Study Period | 2020-2034 |
| Base Year | 2025 |
| Estimated Year | 2026 |
| Forecast Period | 2026-2034 |
| Historical Period | 2020-2025 |
| Growth Rate | CAGR of > 4.00% from 2020-2034 |
| Segmentation |
|
Table of Contents
- 1. Introduction
- 1.1. Research Scope
- 1.2. Market Segmentation
- 1.3. Research Objective
- 1.4. Definitions and Assumptions
- 2. Executive Summary
- 2.1. Market Snapshot
- 3. Market Dynamics
- 3.1. Market Drivers
- 3.2. Market Restrains
- 3.3. Market Trends
- 3.4. Market Opportunities
- 4. Market Factor Analysis
- 4.1. Porters Five Forces
- 4.1.1. Bargaining Power of Suppliers
- 4.1.2. Bargaining Power of Buyers
- 4.1.3. Threat of New Entrants
- 4.1.4. Threat of Substitutes
- 4.1.5. Competitive Rivalry
- 4.2. PESTEL analysis
- 4.3. BCG Analysis
- 4.3.1. Stars (High Growth, High Market Share)
- 4.3.2. Cash Cows (Low Growth, High Market Share)
- 4.3.3. Question Mark (High Growth, Low Market Share)
- 4.3.4. Dogs (Low Growth, Low Market Share)
- 4.4. Ansoff Matrix Analysis
- 4.5. Supply Chain Analysis
- 4.6. Regulatory Landscape
- 4.7. Current Market Potential and Opportunity Assessment (TAM–SAM–SOM Framework)
- 4.8. RAX Analyst Note
- 4.1. Porters Five Forces
- 5. Market Analysis, Insights and Forecast 2021-2033
- 5.1. Market Analysis, Insights and Forecast - by Base Metal
- 5.1.1. Copper
- 5.1.2. Gold
- 5.1.3. Silver
- 5.1.4. Aluminum
- 5.1.5. Other Base Metals
- 5.2. Market Analysis, Insights and Forecast - by End-user Industry
- 5.2.1. Automotive
- 5.2.2. Aerospace and Defense
- 5.2.3. Electrical and Electronics
- 5.2.4. Construction
- 5.2.5. Other End-user Industries
- 5.3. Market Analysis, Insights and Forecast - by Region
- 5.3.1. Asia Pacific
- 5.3.2. North America
- 5.3.3. Europe
- 5.3.4. South America
- 5.3.5. Middle East and Africa
- 5.1. Market Analysis, Insights and Forecast - by Base Metal
- 6. Global Braze Alloys Market Analysis, Insights and Forecast, 2021-2033
- 6.1. Market Analysis, Insights and Forecast - by Base Metal
- 6.1.1. Copper
- 6.1.2. Gold
- 6.1.3. Silver
- 6.1.4. Aluminum
- 6.1.5. Other Base Metals
- 6.2. Market Analysis, Insights and Forecast - by End-user Industry
- 6.2.1. Automotive
- 6.2.2. Aerospace and Defense
- 6.2.3. Electrical and Electronics
- 6.2.4. Construction
- 6.2.5. Other End-user Industries
- 6.1. Market Analysis, Insights and Forecast - by Base Metal
- 7. Asia Pacific Braze Alloys Market Analysis, Insights and Forecast, 2020-2032
- 7.1. Market Analysis, Insights and Forecast - by Base Metal
- 7.1.1. Copper
- 7.1.2. Gold
- 7.1.3. Silver
- 7.1.4. Aluminum
- 7.1.5. Other Base Metals
- 7.2. Market Analysis, Insights and Forecast - by End-user Industry
- 7.2.1. Automotive
- 7.2.2. Aerospace and Defense
- 7.2.3. Electrical and Electronics
- 7.2.4. Construction
- 7.2.5. Other End-user Industries
- 7.1. Market Analysis, Insights and Forecast - by Base Metal
- 8. North America Braze Alloys Market Analysis, Insights and Forecast, 2020-2032
- 8.1. Market Analysis, Insights and Forecast - by Base Metal
- 8.1.1. Copper
- 8.1.2. Gold
- 8.1.3. Silver
- 8.1.4. Aluminum
- 8.1.5. Other Base Metals
- 8.2. Market Analysis, Insights and Forecast - by End-user Industry
- 8.2.1. Automotive
- 8.2.2. Aerospace and Defense
- 8.2.3. Electrical and Electronics
- 8.2.4. Construction
- 8.2.5. Other End-user Industries
- 8.1. Market Analysis, Insights and Forecast - by Base Metal
- 9. Europe Braze Alloys Market Analysis, Insights and Forecast, 2020-2032
- 9.1. Market Analysis, Insights and Forecast - by Base Metal
- 9.1.1. Copper
- 9.1.2. Gold
- 9.1.3. Silver
- 9.1.4. Aluminum
- 9.1.5. Other Base Metals
- 9.2. Market Analysis, Insights and Forecast - by End-user Industry
- 9.2.1. Automotive
- 9.2.2. Aerospace and Defense
- 9.2.3. Electrical and Electronics
- 9.2.4. Construction
- 9.2.5. Other End-user Industries
- 9.1. Market Analysis, Insights and Forecast - by Base Metal
- 10. South America Braze Alloys Market Analysis, Insights and Forecast, 2020-2032
- 10.1. Market Analysis, Insights and Forecast - by Base Metal
- 10.1.1. Copper
- 10.1.2. Gold
- 10.1.3. Silver
- 10.1.4. Aluminum
- 10.1.5. Other Base Metals
- 10.2. Market Analysis, Insights and Forecast - by End-user Industry
- 10.2.1. Automotive
- 10.2.2. Aerospace and Defense
- 10.2.3. Electrical and Electronics
- 10.2.4. Construction
- 10.2.5. Other End-user Industries
- 10.1. Market Analysis, Insights and Forecast - by Base Metal
- 11. Middle East and Africa Braze Alloys Market Analysis, Insights and Forecast, 2020-2032
- 11.1. Market Analysis, Insights and Forecast - by Base Metal
- 11.1.1. Copper
- 11.1.2. Gold
- 11.1.3. Silver
- 11.1.4. Aluminum
- 11.1.5. Other Base Metals
- 11.2. Market Analysis, Insights and Forecast - by End-user Industry
- 11.2.1. Automotive
- 11.2.2. Aerospace and Defense
- 11.2.3. Electrical and Electronics
- 11.2.4. Construction
- 11.2.5. Other End-user Industries
- 11.1. Market Analysis, Insights and Forecast - by Base Metal
- 12. Competitive Analysis
- 12.1. Company Profiles
- 12.1.1 The Harris Products Group
- 12.1.1.1. Company Overview
- 12.1.1.2. Products
- 12.1.1.3. Company Financials
- 12.1.1.4. SWOT Analysis
- 12.1.2 Saru Silver Alloy Private Limited
- 12.1.2.1. Company Overview
- 12.1.2.2. Products
- 12.1.2.3. Company Financials
- 12.1.2.4. SWOT Analysis
- 12.1.3 Sulzer Ltd
- 12.1.3.1. Company Overview
- 12.1.3.2. Products
- 12.1.3.3. Company Financials
- 12.1.3.4. SWOT Analysis
- 12.1.4 VBC Group*List Not Exhaustive
- 12.1.4.1. Company Overview
- 12.1.4.2. Products
- 12.1.4.3. Company Financials
- 12.1.4.4. SWOT Analysis
- 12.1.5 Cupro Alloys Corporation
- 12.1.5.1. Company Overview
- 12.1.5.2. Products
- 12.1.5.3. Company Financials
- 12.1.5.4. SWOT Analysis
- 12.1.6 Morgan Advanced Materials
- 12.1.6.1. Company Overview
- 12.1.6.2. Products
- 12.1.6.3. Company Financials
- 12.1.6.4. SWOT Analysis
- 12.1.7 OC Oerlikon Management AG (Oerlikon Metco)
- 12.1.7.1. Company Overview
- 12.1.7.2. Products
- 12.1.7.3. Company Financials
- 12.1.7.4. SWOT Analysis
- 12.1.8 Johnson Matthey
- 12.1.8.1. Company Overview
- 12.1.8.2. Products
- 12.1.8.3. Company Financials
- 12.1.8.4. SWOT Analysis
- 12.1.9 Aimtek Inc
- 12.1.9.1. Company Overview
- 12.1.9.2. Products
- 12.1.9.3. Company Financials
- 12.1.9.4. SWOT Analysis
- 12.1.10 Prince Izant Company (Bellman-Melcor)
- 12.1.10.1. Company Overview
- 12.1.10.2. Products
- 12.1.10.3. Company Financials
- 12.1.10.4. SWOT Analysis
- 12.1.11 Indian Solder and Brazing Alloys
- 12.1.11.1. Company Overview
- 12.1.11.2. Products
- 12.1.11.3. Company Financials
- 12.1.11.4. SWOT Analysis
- 12.1.12 Lucas-Milhaupt Inc
- 12.1.12.1. Company Overview
- 12.1.12.2. Products
- 12.1.12.3. Company Financials
- 12.1.12.4. SWOT Analysis
- 12.1.1 The Harris Products Group
- 12.2. Market Entropy
- 12.2.1 Company's Key Areas Served
- 12.2.2 Recent Developments
- 12.3. Company Market Share Analysis 2025
- 12.3.1 Top 5 Companies Market Share Analysis
- 12.3.2 Top 3 Companies Market Share Analysis
- 12.4. List of Potential Customers
- 13. Research Methodology
List of Figures
- Figure 1: Global Braze Alloys Market Revenue Breakdown (Million, %) by Region 2025 & 2033
- Figure 2: Global Braze Alloys Market Volume Breakdown (K Tons, %) by Region 2025 & 2033
- Figure 3: Asia Pacific Braze Alloys Market Revenue (Million), by Base Metal 2025 & 2033
- Figure 4: Asia Pacific Braze Alloys Market Volume (K Tons), by Base Metal 2025 & 2033
- Figure 5: Asia Pacific Braze Alloys Market Revenue Share (%), by Base Metal 2025 & 2033
- Figure 6: Asia Pacific Braze Alloys Market Volume Share (%), by Base Metal 2025 & 2033
- Figure 7: Asia Pacific Braze Alloys Market Revenue (Million), by End-user Industry 2025 & 2033
- Figure 8: Asia Pacific Braze Alloys Market Volume (K Tons), by End-user Industry 2025 & 2033
- Figure 9: Asia Pacific Braze Alloys Market Revenue Share (%), by End-user Industry 2025 & 2033
- Figure 10: Asia Pacific Braze Alloys Market Volume Share (%), by End-user Industry 2025 & 2033
- Figure 11: Asia Pacific Braze Alloys Market Revenue (Million), by Country 2025 & 2033
- Figure 12: Asia Pacific Braze Alloys Market Volume (K Tons), by Country 2025 & 2033
- Figure 13: Asia Pacific Braze Alloys Market Revenue Share (%), by Country 2025 & 2033
- Figure 14: Asia Pacific Braze Alloys Market Volume Share (%), by Country 2025 & 2033
- Figure 15: North America Braze Alloys Market Revenue (Million), by Base Metal 2025 & 2033
- Figure 16: North America Braze Alloys Market Volume (K Tons), by Base Metal 2025 & 2033
- Figure 17: North America Braze Alloys Market Revenue Share (%), by Base Metal 2025 & 2033
- Figure 18: North America Braze Alloys Market Volume Share (%), by Base Metal 2025 & 2033
- Figure 19: North America Braze Alloys Market Revenue (Million), by End-user Industry 2025 & 2033
- Figure 20: North America Braze Alloys Market Volume (K Tons), by End-user Industry 2025 & 2033
- Figure 21: North America Braze Alloys Market Revenue Share (%), by End-user Industry 2025 & 2033
- Figure 22: North America Braze Alloys Market Volume Share (%), by End-user Industry 2025 & 2033
- Figure 23: North America Braze Alloys Market Revenue (Million), by Country 2025 & 2033
- Figure 24: North America Braze Alloys Market Volume (K Tons), by Country 2025 & 2033
- Figure 25: North America Braze Alloys Market Revenue Share (%), by Country 2025 & 2033
- Figure 26: North America Braze Alloys Market Volume Share (%), by Country 2025 & 2033
- Figure 27: Europe Braze Alloys Market Revenue (Million), by Base Metal 2025 & 2033
- Figure 28: Europe Braze Alloys Market Volume (K Tons), by Base Metal 2025 & 2033
- Figure 29: Europe Braze Alloys Market Revenue Share (%), by Base Metal 2025 & 2033
- Figure 30: Europe Braze Alloys Market Volume Share (%), by Base Metal 2025 & 2033
- Figure 31: Europe Braze Alloys Market Revenue (Million), by End-user Industry 2025 & 2033
- Figure 32: Europe Braze Alloys Market Volume (K Tons), by End-user Industry 2025 & 2033
- Figure 33: Europe Braze Alloys Market Revenue Share (%), by End-user Industry 2025 & 2033
- Figure 34: Europe Braze Alloys Market Volume Share (%), by End-user Industry 2025 & 2033
- Figure 35: Europe Braze Alloys Market Revenue (Million), by Country 2025 & 2033
- Figure 36: Europe Braze Alloys Market Volume (K Tons), by Country 2025 & 2033
- Figure 37: Europe Braze Alloys Market Revenue Share (%), by Country 2025 & 2033
- Figure 38: Europe Braze Alloys Market Volume Share (%), by Country 2025 & 2033
- Figure 39: South America Braze Alloys Market Revenue (Million), by Base Metal 2025 & 2033
- Figure 40: South America Braze Alloys Market Volume (K Tons), by Base Metal 2025 & 2033
- Figure 41: South America Braze Alloys Market Revenue Share (%), by Base Metal 2025 & 2033
- Figure 42: South America Braze Alloys Market Volume Share (%), by Base Metal 2025 & 2033
- Figure 43: South America Braze Alloys Market Revenue (Million), by End-user Industry 2025 & 2033
- Figure 44: South America Braze Alloys Market Volume (K Tons), by End-user Industry 2025 & 2033
- Figure 45: South America Braze Alloys Market Revenue Share (%), by End-user Industry 2025 & 2033
- Figure 46: South America Braze Alloys Market Volume Share (%), by End-user Industry 2025 & 2033
- Figure 47: South America Braze Alloys Market Revenue (Million), by Country 2025 & 2033
- Figure 48: South America Braze Alloys Market Volume (K Tons), by Country 2025 & 2033
- Figure 49: South America Braze Alloys Market Revenue Share (%), by Country 2025 & 2033
- Figure 50: South America Braze Alloys Market Volume Share (%), by Country 2025 & 2033
- Figure 51: Middle East and Africa Braze Alloys Market Revenue (Million), by Base Metal 2025 & 2033
- Figure 52: Middle East and Africa Braze Alloys Market Volume (K Tons), by Base Metal 2025 & 2033
- Figure 53: Middle East and Africa Braze Alloys Market Revenue Share (%), by Base Metal 2025 & 2033
- Figure 54: Middle East and Africa Braze Alloys Market Volume Share (%), by Base Metal 2025 & 2033
- Figure 55: Middle East and Africa Braze Alloys Market Revenue (Million), by End-user Industry 2025 & 2033
- Figure 56: Middle East and Africa Braze Alloys Market Volume (K Tons), by End-user Industry 2025 & 2033
- Figure 57: Middle East and Africa Braze Alloys Market Revenue Share (%), by End-user Industry 2025 & 2033
- Figure 58: Middle East and Africa Braze Alloys Market Volume Share (%), by End-user Industry 2025 & 2033
- Figure 59: Middle East and Africa Braze Alloys Market Revenue (Million), by Country 2025 & 2033
- Figure 60: Middle East and Africa Braze Alloys Market Volume (K Tons), by Country 2025 & 2033
- Figure 61: Middle East and Africa Braze Alloys Market Revenue Share (%), by Country 2025 & 2033
- Figure 62: Middle East and Africa Braze Alloys Market Volume Share (%), by Country 2025 & 2033
List of Tables
- Table 1: Global Braze Alloys Market Revenue Million Forecast, by Base Metal 2020 & 2033
- Table 2: Global Braze Alloys Market Volume K Tons Forecast, by Base Metal 2020 & 2033
- Table 3: Global Braze Alloys Market Revenue Million Forecast, by End-user Industry 2020 & 2033
- Table 4: Global Braze Alloys Market Volume K Tons Forecast, by End-user Industry 2020 & 2033
- Table 5: Global Braze Alloys Market Revenue Million Forecast, by Region 2020 & 2033
- Table 6: Global Braze Alloys Market Volume K Tons Forecast, by Region 2020 & 2033
- Table 7: Global Braze Alloys Market Revenue Million Forecast, by Base Metal 2020 & 2033
- Table 8: Global Braze Alloys Market Volume K Tons Forecast, by Base Metal 2020 & 2033
- Table 9: Global Braze Alloys Market Revenue Million Forecast, by End-user Industry 2020 & 2033
- Table 10: Global Braze Alloys Market Volume K Tons Forecast, by End-user Industry 2020 & 2033
- Table 11: Global Braze Alloys Market Revenue Million Forecast, by Country 2020 & 2033
- Table 12: Global Braze Alloys Market Volume K Tons Forecast, by Country 2020 & 2033
- Table 13: China Braze Alloys Market Revenue (Million) Forecast, by Application 2020 & 2033
- Table 14: China Braze Alloys Market Volume (K Tons) Forecast, by Application 2020 & 2033
- Table 15: India Braze Alloys Market Revenue (Million) Forecast, by Application 2020 & 2033
- Table 16: India Braze Alloys Market Volume (K Tons) Forecast, by Application 2020 & 2033
- Table 17: Japan Braze Alloys Market Revenue (Million) Forecast, by Application 2020 & 2033
- Table 18: Japan Braze Alloys Market Volume (K Tons) Forecast, by Application 2020 & 2033
- Table 19: South Korea Braze Alloys Market Revenue (Million) Forecast, by Application 2020 & 2033
- Table 20: South Korea Braze Alloys Market Volume (K Tons) Forecast, by Application 2020 & 2033
- Table 21: Rest of Asia Pacific Braze Alloys Market Revenue (Million) Forecast, by Application 2020 & 2033
- Table 22: Rest of Asia Pacific Braze Alloys Market Volume (K Tons) Forecast, by Application 2020 & 2033
- Table 23: Global Braze Alloys Market Revenue Million Forecast, by Base Metal 2020 & 2033
- Table 24: Global Braze Alloys Market Volume K Tons Forecast, by Base Metal 2020 & 2033
- Table 25: Global Braze Alloys Market Revenue Million Forecast, by End-user Industry 2020 & 2033
- Table 26: Global Braze Alloys Market Volume K Tons Forecast, by End-user Industry 2020 & 2033
- Table 27: Global Braze Alloys Market Revenue Million Forecast, by Country 2020 & 2033
- Table 28: Global Braze Alloys Market Volume K Tons Forecast, by Country 2020 & 2033
- Table 29: United States Braze Alloys Market Revenue (Million) Forecast, by Application 2020 & 2033
- Table 30: United States Braze Alloys Market Volume (K Tons) Forecast, by Application 2020 & 2033
- Table 31: Canada Braze Alloys Market Revenue (Million) Forecast, by Application 2020 & 2033
- Table 32: Canada Braze Alloys Market Volume (K Tons) Forecast, by Application 2020 & 2033
- Table 33: Mexico Braze Alloys Market Revenue (Million) Forecast, by Application 2020 & 2033
- Table 34: Mexico Braze Alloys Market Volume (K Tons) Forecast, by Application 2020 & 2033
- Table 35: Global Braze Alloys Market Revenue Million Forecast, by Base Metal 2020 & 2033
- Table 36: Global Braze Alloys Market Volume K Tons Forecast, by Base Metal 2020 & 2033
- Table 37: Global Braze Alloys Market Revenue Million Forecast, by End-user Industry 2020 & 2033
- Table 38: Global Braze Alloys Market Volume K Tons Forecast, by End-user Industry 2020 & 2033
- Table 39: Global Braze Alloys Market Revenue Million Forecast, by Country 2020 & 2033
- Table 40: Global Braze Alloys Market Volume K Tons Forecast, by Country 2020 & 2033
- Table 41: Germany Braze Alloys Market Revenue (Million) Forecast, by Application 2020 & 2033
- Table 42: Germany Braze Alloys Market Volume (K Tons) Forecast, by Application 2020 & 2033
- Table 43: United Kingdom Braze Alloys Market Revenue (Million) Forecast, by Application 2020 & 2033
- Table 44: United Kingdom Braze Alloys Market Volume (K Tons) Forecast, by Application 2020 & 2033
- Table 45: Italy Braze Alloys Market Revenue (Million) Forecast, by Application 2020 & 2033
- Table 46: Italy Braze Alloys Market Volume (K Tons) Forecast, by Application 2020 & 2033
- Table 47: France Braze Alloys Market Revenue (Million) Forecast, by Application 2020 & 2033
- Table 48: France Braze Alloys Market Volume (K Tons) Forecast, by Application 2020 & 2033
- Table 49: Spain Braze Alloys Market Revenue (Million) Forecast, by Application 2020 & 2033
- Table 50: Spain Braze Alloys Market Volume (K Tons) Forecast, by Application 2020 & 2033
- Table 51: Rest of Europe Braze Alloys Market Revenue (Million) Forecast, by Application 2020 & 2033
- Table 52: Rest of Europe Braze Alloys Market Volume (K Tons) Forecast, by Application 2020 & 2033
- Table 53: Global Braze Alloys Market Revenue Million Forecast, by Base Metal 2020 & 2033
- Table 54: Global Braze Alloys Market Volume K Tons Forecast, by Base Metal 2020 & 2033
- Table 55: Global Braze Alloys Market Revenue Million Forecast, by End-user Industry 2020 & 2033
- Table 56: Global Braze Alloys Market Volume K Tons Forecast, by End-user Industry 2020 & 2033
- Table 57: Global Braze Alloys Market Revenue Million Forecast, by Country 2020 & 2033
- Table 58: Global Braze Alloys Market Volume K Tons Forecast, by Country 2020 & 2033
- Table 59: Brazil Braze Alloys Market Revenue (Million) Forecast, by Application 2020 & 2033
- Table 60: Brazil Braze Alloys Market Volume (K Tons) Forecast, by Application 2020 & 2033
- Table 61: Argentina Braze Alloys Market Revenue (Million) Forecast, by Application 2020 & 2033
- Table 62: Argentina Braze Alloys Market Volume (K Tons) Forecast, by Application 2020 & 2033
- Table 63: Rest of South America Braze Alloys Market Revenue (Million) Forecast, by Application 2020 & 2033
- Table 64: Rest of South America Braze Alloys Market Volume (K Tons) Forecast, by Application 2020 & 2033
- Table 65: Global Braze Alloys Market Revenue Million Forecast, by Base Metal 2020 & 2033
- Table 66: Global Braze Alloys Market Volume K Tons Forecast, by Base Metal 2020 & 2033
- Table 67: Global Braze Alloys Market Revenue Million Forecast, by End-user Industry 2020 & 2033
- Table 68: Global Braze Alloys Market Volume K Tons Forecast, by End-user Industry 2020 & 2033
- Table 69: Global Braze Alloys Market Revenue Million Forecast, by Country 2020 & 2033
- Table 70: Global Braze Alloys Market Volume K Tons Forecast, by Country 2020 & 2033
- Table 71: Saudi Arabia Braze Alloys Market Revenue (Million) Forecast, by Application 2020 & 2033
- Table 72: Saudi Arabia Braze Alloys Market Volume (K Tons) Forecast, by Application 2020 & 2033
- Table 73: South Africa Braze Alloys Market Revenue (Million) Forecast, by Application 2020 & 2033
- Table 74: South Africa Braze Alloys Market Volume (K Tons) Forecast, by Application 2020 & 2033
- Table 75: Rest of Middle East and Africa Braze Alloys Market Revenue (Million) Forecast, by Application 2020 & 2033
- Table 76: Rest of Middle East and Africa Braze Alloys Market Volume (K Tons) Forecast, by Application 2020 & 2033
Frequently Asked Questions
1. What is the projected Compound Annual Growth Rate (CAGR) of the Braze Alloys Market?
The projected CAGR is approximately > 4.00%.
2. Which companies are prominent players in the Braze Alloys Market?
Key companies in the market include The Harris Products Group, Saru Silver Alloy Private Limited, Sulzer Ltd, VBC Group*List Not Exhaustive, Cupro Alloys Corporation, Morgan Advanced Materials, OC Oerlikon Management AG (Oerlikon Metco), Johnson Matthey, Aimtek Inc, Prince Izant Company (Bellman-Melcor), Indian Solder and Brazing Alloys, Lucas-Milhaupt Inc.
3. What are the main segments of the Braze Alloys Market?
The market segments include Base Metal, End-user Industry.
4. Can you provide details about the market size?
The market size is estimated to be USD 2759.3 Million as of 2022.
5. What are some drivers contributing to market growth?
Increasing Adoption Rate of Brazing Process Over Processes like Welding and Soldering; Increasing Demand for Aluminum Brazing Alloys from the Automotive Industry.
6. What are the notable trends driving market growth?
The Automotive Segment is Expected to Dominate the Market.
7. Are there any restraints impacting market growth?
Fluctuating Prices of Base Metals; Other Restraints.
8. Can you provide examples of recent developments in the market?
The Braze Alloys sector has experienced several significant developments in recent years. The major developments include the increasing demand for lead-free brazing materials, the growing popularity of robotic brazing, and the increasing demand for copper-based brazing materials.
9. What pricing options are available for accessing the report?
Pricing options include single-user, multi-user, and enterprise licenses priced at USD 4750, USD 5250, and USD 8750 respectively.
10. Is the market size provided in terms of value or volume?
The market size is provided in terms of value, measured in Million and volume, measured in K Tons.
11. Are there any specific market keywords associated with the report?
Yes, the market keyword associated with the report is "Braze Alloys Market," which aids in identifying and referencing the specific market segment covered.
12. How do I determine which pricing option suits my needs best?
The pricing options vary based on user requirements and access needs. Individual users may opt for single-user licenses, while businesses requiring broader access may choose multi-user or enterprise licenses for cost-effective access to the report.
13. Are there any additional resources or data provided in the Braze Alloys Market report?
While the report offers comprehensive insights, it's advisable to review the specific contents or supplementary materials provided to ascertain if additional resources or data are available.
14. How can I stay updated on further developments or reports in the Braze Alloys Market?
To stay informed about further developments, trends, and reports in the Braze Alloys Market, consider subscribing to industry newsletters, following relevant companies and organizations, or regularly checking reputable industry news sources and publications.
Methodology
Step 1 - Identification of Relevant Samples Size from Population Database


Step 2 - Approaches for Defining Global Market Size (Value, Volume* & Price*)

Note*: In applicable scenarios
Step 3 - Data Sources
Primary Research
- Web Analytics
- Survey Reports
- Research Institute
- Latest Research Reports
- Opinion Leaders
Secondary Research
- Annual Reports
- White Paper
- Latest Press Release
- Industry Association
- Paid Database
- Investor Presentations

Step 4 - Data Triangulation
Involves using different sources of information in order to increase the validity of a study
These sources are likely to be stakeholders in a program - participants, other researchers, program staff, other community members, and so on.
Then we put all data in single framework & apply various statistical tools to find out the dynamic on the market.
During the analysis stage, feedback from the stakeholder groups would be compared to determine areas of agreement as well as areas of divergence