

Key Insights
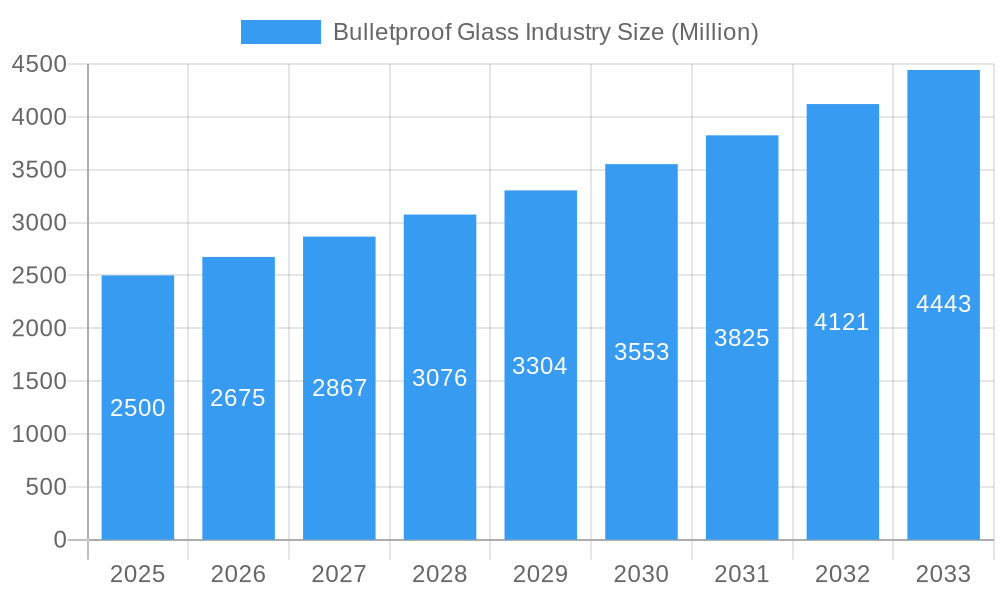
The global bulletproof glass market, valued at approximately $10.83 billion in the base year of 2025, is projected to experience robust growth, exceeding an 11.78% CAGR through 2033. This expansion is driven by escalating security concerns across automotive, building and construction, and defense sectors. Key growth drivers include enhanced vehicle security features, increased infrastructure development, and defense modernization investments. Technological advancements in lighter, stronger, and more transparent bulletproof glass solutions are also fueling market expansion. While traditional laminated glass remains dominant, the growing adoption of polycarbonate and glass-clad polycarbonate for improved ballistic resistance and weight reduction is shaping market segmentation.
Bulletproof Glass Industry Market Size (In Billion)
Regional dynamics show strong growth in Asia-Pacific, particularly China and India, due to rapid urbanization and infrastructure projects. North America and Europe contribute significantly through defense spending and commercial building security upgrades. High production costs and specialized manufacturing expertise present market challenges.
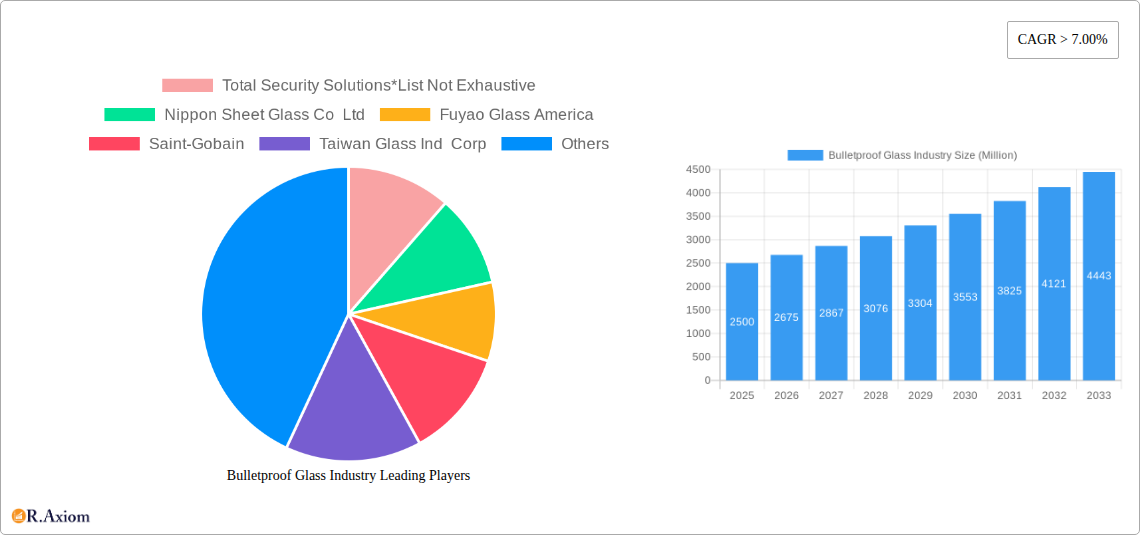
Bulletproof Glass Industry Company Market Share
The competitive landscape includes established players and specialized security providers. Future growth will depend on innovation in cost-effective, high-performance products and catering to diverse end-user needs. The integration of smart technologies into bulletproof glass solutions offers promising growth avenues. Effective marketing strategies highlighting the critical role of bulletproof glass in an increasingly volatile world will be crucial for market penetration. The market trajectory indicates a sustained upward trend, driven by fundamental demand for advanced security solutions.
Bulletproof Glass Industry Market Report: 2019-2033
This comprehensive report provides a detailed analysis of the global bulletproof glass industry, offering actionable insights for stakeholders across the value chain. The study period covers 2019-2033, with 2025 as the base and estimated year. The report forecasts market trends from 2025-2033, leveraging data from the historical period (2019-2024). The market size is valued in Millions USD throughout the report.
Bulletproof Glass Industry Market Concentration & Innovation
This section analyzes the market concentration, innovation drivers, regulatory landscape, product substitutes, end-user trends, and merger & acquisition (M&A) activities within the bulletproof glass industry.
The industry exhibits a moderately concentrated structure, with a few major players holding significant market share. For example, Nippon Sheet Glass Co Ltd and Saint-Gobain are estimated to collectively hold approximately xx% of the global market share in 2025, while Fuyao Glass America and Asahi India Glass Limited account for an additional combined xx%. This concentration, however, is anticipated to see some change with the entrance of smaller innovative players and increased competition in the coming decade.
Innovation Drivers: Key innovations are focused on enhancing ballistic resistance, transparency, weight reduction, and cost-effectiveness. This includes the development of advanced materials, like glass-clad polycarbonate and new lamination techniques.
Regulatory Frameworks: Varying international standards for ballistic protection influence product design and manufacturing. Stringent regulations in certain regions drive innovation in higher-performance materials and testing methodologies.
Product Substitutes: While bulletproof glass remains the dominant solution, alternative materials like advanced polymers are emerging, posing a potential, yet limited threat, in niche applications.
End-user Trends: Growing demand from the automotive and construction sectors, driven by increasing security concerns and urbanization, is a major growth driver. The defense sector remains a significant market segment.
M&A Activities: The industry has witnessed several M&A activities in recent years, with deal values reaching an estimated xx Million USD in 2024. Notable examples include the Guardian Glass acquisition of Vortex Glass in January 2023. These activities reflect efforts to expand market share, access new technologies, and enhance product offerings.
Bulletproof Glass Industry Industry Trends & Insights
The global bulletproof glass market is projected to exhibit a Compound Annual Growth Rate (CAGR) of xx% during the forecast period (2025-2033), driven by several key factors. Market penetration in emerging economies is expected to increase significantly, contributing significantly to the overall growth.
Technological advancements are continuously improving the performance and affordability of bulletproof glass products. This includes the development of lighter, stronger, and more transparent materials, which in turn broaden the applications and market appeal. Consumer preference for enhanced security features in various applications, including automobiles, buildings, and personal protective equipment, further fuels market demand.
The competitive landscape is characterized by both established players and emerging companies. Competition is primarily focused on product innovation, pricing strategies, and expanding market reach. This competitive dynamism drives innovation and keeps the costs competitive and accessible. The increasing need for security across diverse sectors is the primary driver for sustained growth in the coming years, with market penetration being a key factor that would drive further growth.
Dominant Markets & Segments in Bulletproof Glass Industry
The Building and Construction sector represents the largest end-user segment, accounting for an estimated xx% of the market in 2025, driven by increasing urbanization and a rising demand for enhanced security in commercial and residential buildings.
- Key Drivers in Building and Construction: Increased infrastructure development, rising construction activity in developing nations, and stringent building codes demanding enhanced security measures.
- Key Drivers in Automotive Sector: Growing demand for advanced safety features in high-end vehicles and increasing production of armored vehicles for VIP protection.
- Key Drivers in Defense Sector: Government spending on defense equipment and the need for improved personal protective equipment for military and law enforcement personnel.
Geographically, North America and Europe currently hold substantial market share, but Asia-Pacific is expected to experience the fastest growth, driven by economic expansion and increasing security consciousness in emerging economies.
- Type Segmentation: Traditional laminated glass still holds the largest market share, but the demand for lighter and more transparent alternatives like Polycarbonate and Glass-clad Polycarbonate is growing rapidly, representing xx% of the market in 2025.
- Region-wise market dominance: North America will continue to dominate the market due to high demand, strong regulatory frameworks, and robust security requirements. However, the Asia-Pacific region is projected to show significant growth owing to increasing investments in infrastructure and rising construction activity.
Bulletproof Glass Industry Product Developments
Recent innovations in bulletproof glass focus on reducing weight without compromising ballistic protection, enhancing transparency, and improving impact resistance. The development of glass-clad polycarbonate and other advanced materials addresses the need for lighter-weight, more flexible, and cost-effective alternatives to traditional laminated glass, expanding market applications and appeal across sectors. These products are carefully designed to achieve the required level of protection while maximizing the advantages of the material in terms of cost-effectiveness, appearance, and weight management.
Report Scope & Segmentation Analysis
The report segments the bulletproof glass market by type (Solid Acrylic, Traditional Laminated, Polycarbonate, Glass-clad Polycarbonate, Other Types) and end-user industry (Automotive, Buildings and Construction, Defense, Other End-user Industries). Each segment is analyzed based on its historical performance, current market size, growth projections, competitive dynamics and key drivers. The detailed analysis provides insight into market shares, growth trajectories, and opportunities for various product types and applications.
Key Drivers of Bulletproof Glass Industry Growth
The bulletproof glass industry's expansion is fueled by a confluence of critical factors. Escalating global security concerns, heightened government investments in defense and national security infrastructure, and the rapid pace of urbanization are significantly boosting demand within the construction sector. Concurrently, continuous technological breakthroughs are yielding bulletproof glass solutions that are not only lighter and more robust but also increasingly cost-effective. Furthermore, the implementation of stringent safety regulations across various industries is a powerful catalyst, compelling widespread adoption of these advanced protective materials.
Challenges in the Bulletproof Glass Industry Sector
Challenges include the high cost of raw materials, complex manufacturing processes, stringent quality control requirements, and the potential for supply chain disruptions. Moreover, intense competition and the emergence of substitute materials also pose a threat to the continued growth in the industry. These factors are estimated to collectively impact the industry's growth by xx% annually.
Emerging Opportunities in Bulletproof Glass Industry
Beyond its traditional applications, the bulletproof glass industry is witnessing a surge in emerging opportunities. Its integration into personal protective equipment, specialized transportation vehicles, and critical financial institutions represents a growing segment. The development and widespread adoption of advanced, lightweight, and flexible materials are further broadening the scope of potential applications. This innovation is particularly impactful in sectors like automotive and aerospace, paving the way for enhanced market penetration, higher adoption rates, and a significant expansion of market share.
Leading Players in the Bulletproof Glass Industry Market
- Total Security Solutions
- Nippon Sheet Glass Co Ltd
- Fuyao Glass America
- Saint-Gobain
- Taiwan Glass Ind Corp
- Armortex
- Centigon Security Group
- Guardian Industries Holdings
- Asahi India Glass Limited
- Armass glass
- STEC ARMOUR GLASS
- Consolidated Glass Holdings Inc
- Binswanger Glass
- Guangdong Golden Glass Technologies Limited
- SCHOTT AG
Key Developments in Bulletproof Glass Industry Industry
- January 2023: Asahi India Glass Limited, in collaboration with Enormous Brands, has strategically enhanced its brand visibility within the doors and windows segment. This initiative is designed to bolster market share and elevate brand recognition.
- January 2023: Guardian Glass has successfully acquired Vortex Glass, thereby expanding its manufacturing capabilities in tempered glass packages for both residential and commercial construction projects. This acquisition is set to strengthen Guardian Glass's market standing and broaden its customer offerings.
Strategic Outlook for Bulletproof Glass Industry Market
The bulletproof glass industry is on a trajectory for sustained and robust growth. This optimistic outlook is underpinned by consistent demand from a diverse range of sectors and the relentless pace of technological innovation. The ongoing development of materials that offer superior strength, reduced weight, and enhanced transparency, combined with increasing global security imperatives, is expected to propel market applications into new territories. This evolution is projected to drive steady growth, with annual revenues anticipated to surpass xx Million USD by 2033. Strategic foresight, continuous innovation, and the cultivation of key partnerships will be instrumental in shaping the industry's future landscape.
Bulletproof Glass Industry Segmentation
-
1. Type
- 1.1. Solid Acrylic
- 1.2. Traditional Laminated
- 1.3. Polycarbonate
- 1.4. Glass-clad Polycarbonate
- 1.5. Other Types
-
2. End-user Industry
- 2.1. Automotive
- 2.2. Buildings and Construction
- 2.3. Defense
- 2.4. Other End-user Industries
Bulletproof Glass Industry Segmentation By Geography
-
1. Asia Pacific
- 1.1. China
- 1.2. India
- 1.3. Japan
- 1.4. South Korea
- 1.5. Rest of Asia Pacific
-
2. North America
- 2.1. United States
- 2.2. Canada
- 2.3. Mexico
-
3. Europe
- 3.1. Germany
- 3.2. United Kingdom
- 3.3. France
- 3.4. Italy
- 3.5. Rest of Europe
-
4. South America
- 4.1. Brazil
- 4.2. Argentina
- 4.3. Rest of South America
- 5. Middle East
-
6. Saudi Arabia
- 6.1. South Africa
- 6.2. Rest of Middle East
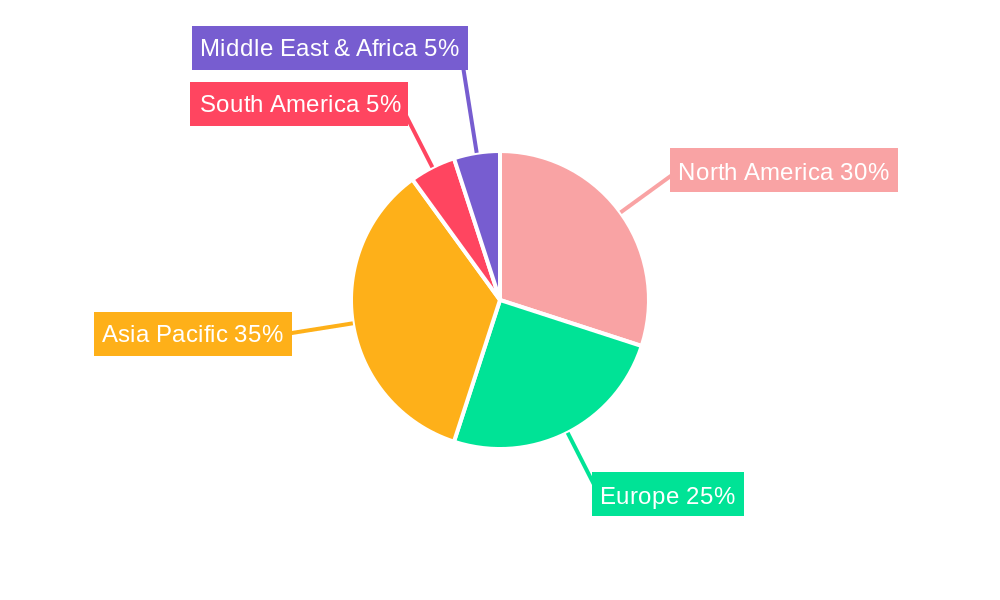
Bulletproof Glass Industry Regional Market Share
Geographic Coverage of Bulletproof Glass Industry
Bulletproof Glass Industry REPORT HIGHLIGHTS
| Aspects | Details |
|---|---|
| Study Period | 2020-2034 |
| Base Year | 2025 |
| Estimated Year | 2026 |
| Forecast Period | 2026-2034 |
| Historical Period | 2020-2025 |
| Growth Rate | CAGR of 11.78% from 2020-2034 |
| Segmentation |
|
Table of Contents
- 1. Introduction
- 1.1. Research Scope
- 1.2. Market Segmentation
- 1.3. Research Objective
- 1.4. Definitions and Assumptions
- 2. Executive Summary
- 2.1. Market Snapshot
- 3. Market Dynamics
- 3.1. Market Drivers
- 3.2. Market Restrains
- 3.3. Market Trends
- 3.4. Market Opportunities
- 4. Market Factor Analysis
- 4.1. Porters Five Forces
- 4.1.1. Bargaining Power of Suppliers
- 4.1.2. Bargaining Power of Buyers
- 4.1.3. Threat of New Entrants
- 4.1.4. Threat of Substitutes
- 4.1.5. Competitive Rivalry
- 4.2. PESTEL analysis
- 4.3. BCG Analysis
- 4.3.1. Stars (High Growth, High Market Share)
- 4.3.2. Cash Cows (Low Growth, High Market Share)
- 4.3.3. Question Mark (High Growth, Low Market Share)
- 4.3.4. Dogs (Low Growth, Low Market Share)
- 4.4. Ansoff Matrix Analysis
- 4.5. Supply Chain Analysis
- 4.6. Regulatory Landscape
- 4.7. Current Market Potential and Opportunity Assessment (TAM–SAM–SOM Framework)
- 4.8. RAX Analyst Note
- 4.1. Porters Five Forces
- 5. Market Analysis, Insights and Forecast 2021-2033
- 5.1. Market Analysis, Insights and Forecast - by Type
- 5.1.1. Solid Acrylic
- 5.1.2. Traditional Laminated
- 5.1.3. Polycarbonate
- 5.1.4. Glass-clad Polycarbonate
- 5.1.5. Other Types
- 5.2. Market Analysis, Insights and Forecast - by End-user Industry
- 5.2.1. Automotive
- 5.2.2. Buildings and Construction
- 5.2.3. Defense
- 5.2.4. Other End-user Industries
- 5.3. Market Analysis, Insights and Forecast - by Region
- 5.3.1. Asia Pacific
- 5.3.2. North America
- 5.3.3. Europe
- 5.3.4. South America
- 5.3.5. Middle East
- 5.3.6. Saudi Arabia
- 5.1. Market Analysis, Insights and Forecast - by Type
- 6. Global Bulletproof Glass Industry Analysis, Insights and Forecast, 2021-2033
- 6.1. Market Analysis, Insights and Forecast - by Type
- 6.1.1. Solid Acrylic
- 6.1.2. Traditional Laminated
- 6.1.3. Polycarbonate
- 6.1.4. Glass-clad Polycarbonate
- 6.1.5. Other Types
- 6.2. Market Analysis, Insights and Forecast - by End-user Industry
- 6.2.1. Automotive
- 6.2.2. Buildings and Construction
- 6.2.3. Defense
- 6.2.4. Other End-user Industries
- 6.1. Market Analysis, Insights and Forecast - by Type
- 7. Asia Pacific Bulletproof Glass Industry Analysis, Insights and Forecast, 2020-2032
- 7.1. Market Analysis, Insights and Forecast - by Type
- 7.1.1. Solid Acrylic
- 7.1.2. Traditional Laminated
- 7.1.3. Polycarbonate
- 7.1.4. Glass-clad Polycarbonate
- 7.1.5. Other Types
- 7.2. Market Analysis, Insights and Forecast - by End-user Industry
- 7.2.1. Automotive
- 7.2.2. Buildings and Construction
- 7.2.3. Defense
- 7.2.4. Other End-user Industries
- 7.1. Market Analysis, Insights and Forecast - by Type
- 8. North America Bulletproof Glass Industry Analysis, Insights and Forecast, 2020-2032
- 8.1. Market Analysis, Insights and Forecast - by Type
- 8.1.1. Solid Acrylic
- 8.1.2. Traditional Laminated
- 8.1.3. Polycarbonate
- 8.1.4. Glass-clad Polycarbonate
- 8.1.5. Other Types
- 8.2. Market Analysis, Insights and Forecast - by End-user Industry
- 8.2.1. Automotive
- 8.2.2. Buildings and Construction
- 8.2.3. Defense
- 8.2.4. Other End-user Industries
- 8.1. Market Analysis, Insights and Forecast - by Type
- 9. Europe Bulletproof Glass Industry Analysis, Insights and Forecast, 2020-2032
- 9.1. Market Analysis, Insights and Forecast - by Type
- 9.1.1. Solid Acrylic
- 9.1.2. Traditional Laminated
- 9.1.3. Polycarbonate
- 9.1.4. Glass-clad Polycarbonate
- 9.1.5. Other Types
- 9.2. Market Analysis, Insights and Forecast - by End-user Industry
- 9.2.1. Automotive
- 9.2.2. Buildings and Construction
- 9.2.3. Defense
- 9.2.4. Other End-user Industries
- 9.1. Market Analysis, Insights and Forecast - by Type
- 10. South America Bulletproof Glass Industry Analysis, Insights and Forecast, 2020-2032
- 10.1. Market Analysis, Insights and Forecast - by Type
- 10.1.1. Solid Acrylic
- 10.1.2. Traditional Laminated
- 10.1.3. Polycarbonate
- 10.1.4. Glass-clad Polycarbonate
- 10.1.5. Other Types
- 10.2. Market Analysis, Insights and Forecast - by End-user Industry
- 10.2.1. Automotive
- 10.2.2. Buildings and Construction
- 10.2.3. Defense
- 10.2.4. Other End-user Industries
- 10.1. Market Analysis, Insights and Forecast - by Type
- 11. Middle East Bulletproof Glass Industry Analysis, Insights and Forecast, 2020-2032
- 11.1. Market Analysis, Insights and Forecast - by Type
- 11.1.1. Solid Acrylic
- 11.1.2. Traditional Laminated
- 11.1.3. Polycarbonate
- 11.1.4. Glass-clad Polycarbonate
- 11.1.5. Other Types
- 11.2. Market Analysis, Insights and Forecast - by End-user Industry
- 11.2.1. Automotive
- 11.2.2. Buildings and Construction
- 11.2.3. Defense
- 11.2.4. Other End-user Industries
- 11.1. Market Analysis, Insights and Forecast - by Type
- 12. Saudi Arabia Bulletproof Glass Industry Analysis, Insights and Forecast, 2020-2032
- 12.1. Market Analysis, Insights and Forecast - by Type
- 12.1.1. Solid Acrylic
- 12.1.2. Traditional Laminated
- 12.1.3. Polycarbonate
- 12.1.4. Glass-clad Polycarbonate
- 12.1.5. Other Types
- 12.2. Market Analysis, Insights and Forecast - by End-user Industry
- 12.2.1. Automotive
- 12.2.2. Buildings and Construction
- 12.2.3. Defense
- 12.2.4. Other End-user Industries
- 12.1. Market Analysis, Insights and Forecast - by Type
- 13. Competitive Analysis
- 13.1. Company Profiles
- 13.1.1 Total Security Solutions*List Not Exhaustive
- 13.1.1.1. Company Overview
- 13.1.1.2. Products
- 13.1.1.3. Company Financials
- 13.1.1.4. SWOT Analysis
- 13.1.2 Nippon Sheet Glass Co Ltd
- 13.1.2.1. Company Overview
- 13.1.2.2. Products
- 13.1.2.3. Company Financials
- 13.1.2.4. SWOT Analysis
- 13.1.3 Fuyao Glass America
- 13.1.3.1. Company Overview
- 13.1.3.2. Products
- 13.1.3.3. Company Financials
- 13.1.3.4. SWOT Analysis
- 13.1.4 Saint-Gobain
- 13.1.4.1. Company Overview
- 13.1.4.2. Products
- 13.1.4.3. Company Financials
- 13.1.4.4. SWOT Analysis
- 13.1.5 Taiwan Glass Ind Corp
- 13.1.5.1. Company Overview
- 13.1.5.2. Products
- 13.1.5.3. Company Financials
- 13.1.5.4. SWOT Analysis
- 13.1.6 Armortex
- 13.1.6.1. Company Overview
- 13.1.6.2. Products
- 13.1.6.3. Company Financials
- 13.1.6.4. SWOT Analysis
- 13.1.7 Centigon Security Group
- 13.1.7.1. Company Overview
- 13.1.7.2. Products
- 13.1.7.3. Company Financials
- 13.1.7.4. SWOT Analysis
- 13.1.8 Guardian Industries Holdings
- 13.1.8.1. Company Overview
- 13.1.8.2. Products
- 13.1.8.3. Company Financials
- 13.1.8.4. SWOT Analysis
- 13.1.9 Asahi India Glass Limited
- 13.1.9.1. Company Overview
- 13.1.9.2. Products
- 13.1.9.3. Company Financials
- 13.1.9.4. SWOT Analysis
- 13.1.10 Armass glass
- 13.1.10.1. Company Overview
- 13.1.10.2. Products
- 13.1.10.3. Company Financials
- 13.1.10.4. SWOT Analysis
- 13.1.11 STEC ARMOUR GLASS
- 13.1.11.1. Company Overview
- 13.1.11.2. Products
- 13.1.11.3. Company Financials
- 13.1.11.4. SWOT Analysis
- 13.1.12 Consolidated Glass Holdings Inc
- 13.1.12.1. Company Overview
- 13.1.12.2. Products
- 13.1.12.3. Company Financials
- 13.1.12.4. SWOT Analysis
- 13.1.13 Binswanger Glass
- 13.1.13.1. Company Overview
- 13.1.13.2. Products
- 13.1.13.3. Company Financials
- 13.1.13.4. SWOT Analysis
- 13.1.14 Guangdong Golden Glass Technologies Limited
- 13.1.14.1. Company Overview
- 13.1.14.2. Products
- 13.1.14.3. Company Financials
- 13.1.14.4. SWOT Analysis
- 13.1.15 SCHOTT AG
- 13.1.15.1. Company Overview
- 13.1.15.2. Products
- 13.1.15.3. Company Financials
- 13.1.15.4. SWOT Analysis
- 13.1.1 Total Security Solutions*List Not Exhaustive
- 13.2. Market Entropy
- 13.2.1 Company's Key Areas Served
- 13.2.2 Recent Developments
- 13.3. Company Market Share Analysis 2025
- 13.3.1 Top 5 Companies Market Share Analysis
- 13.3.2 Top 3 Companies Market Share Analysis
- 13.4. List of Potential Customers
- 14. Research Methodology
List of Figures
- Figure 1: Global Bulletproof Glass Industry Revenue Breakdown (billion, %) by Region 2025 & 2033
- Figure 2: Asia Pacific Bulletproof Glass Industry Revenue (billion), by Type 2025 & 2033
- Figure 3: Asia Pacific Bulletproof Glass Industry Revenue Share (%), by Type 2025 & 2033
- Figure 4: Asia Pacific Bulletproof Glass Industry Revenue (billion), by End-user Industry 2025 & 2033
- Figure 5: Asia Pacific Bulletproof Glass Industry Revenue Share (%), by End-user Industry 2025 & 2033
- Figure 6: Asia Pacific Bulletproof Glass Industry Revenue (billion), by Country 2025 & 2033
- Figure 7: Asia Pacific Bulletproof Glass Industry Revenue Share (%), by Country 2025 & 2033
- Figure 8: North America Bulletproof Glass Industry Revenue (billion), by Type 2025 & 2033
- Figure 9: North America Bulletproof Glass Industry Revenue Share (%), by Type 2025 & 2033
- Figure 10: North America Bulletproof Glass Industry Revenue (billion), by End-user Industry 2025 & 2033
- Figure 11: North America Bulletproof Glass Industry Revenue Share (%), by End-user Industry 2025 & 2033
- Figure 12: North America Bulletproof Glass Industry Revenue (billion), by Country 2025 & 2033
- Figure 13: North America Bulletproof Glass Industry Revenue Share (%), by Country 2025 & 2033
- Figure 14: Europe Bulletproof Glass Industry Revenue (billion), by Type 2025 & 2033
- Figure 15: Europe Bulletproof Glass Industry Revenue Share (%), by Type 2025 & 2033
- Figure 16: Europe Bulletproof Glass Industry Revenue (billion), by End-user Industry 2025 & 2033
- Figure 17: Europe Bulletproof Glass Industry Revenue Share (%), by End-user Industry 2025 & 2033
- Figure 18: Europe Bulletproof Glass Industry Revenue (billion), by Country 2025 & 2033
- Figure 19: Europe Bulletproof Glass Industry Revenue Share (%), by Country 2025 & 2033
- Figure 20: South America Bulletproof Glass Industry Revenue (billion), by Type 2025 & 2033
- Figure 21: South America Bulletproof Glass Industry Revenue Share (%), by Type 2025 & 2033
- Figure 22: South America Bulletproof Glass Industry Revenue (billion), by End-user Industry 2025 & 2033
- Figure 23: South America Bulletproof Glass Industry Revenue Share (%), by End-user Industry 2025 & 2033
- Figure 24: South America Bulletproof Glass Industry Revenue (billion), by Country 2025 & 2033
- Figure 25: South America Bulletproof Glass Industry Revenue Share (%), by Country 2025 & 2033
- Figure 26: Middle East Bulletproof Glass Industry Revenue (billion), by Type 2025 & 2033
- Figure 27: Middle East Bulletproof Glass Industry Revenue Share (%), by Type 2025 & 2033
- Figure 28: Middle East Bulletproof Glass Industry Revenue (billion), by End-user Industry 2025 & 2033
- Figure 29: Middle East Bulletproof Glass Industry Revenue Share (%), by End-user Industry 2025 & 2033
- Figure 30: Middle East Bulletproof Glass Industry Revenue (billion), by Country 2025 & 2033
- Figure 31: Middle East Bulletproof Glass Industry Revenue Share (%), by Country 2025 & 2033
- Figure 32: Saudi Arabia Bulletproof Glass Industry Revenue (billion), by Type 2025 & 2033
- Figure 33: Saudi Arabia Bulletproof Glass Industry Revenue Share (%), by Type 2025 & 2033
- Figure 34: Saudi Arabia Bulletproof Glass Industry Revenue (billion), by End-user Industry 2025 & 2033
- Figure 35: Saudi Arabia Bulletproof Glass Industry Revenue Share (%), by End-user Industry 2025 & 2033
- Figure 36: Saudi Arabia Bulletproof Glass Industry Revenue (billion), by Country 2025 & 2033
- Figure 37: Saudi Arabia Bulletproof Glass Industry Revenue Share (%), by Country 2025 & 2033
List of Tables
- Table 1: Global Bulletproof Glass Industry Revenue billion Forecast, by Type 2020 & 2033
- Table 2: Global Bulletproof Glass Industry Revenue billion Forecast, by End-user Industry 2020 & 2033
- Table 3: Global Bulletproof Glass Industry Revenue billion Forecast, by Region 2020 & 2033
- Table 4: Global Bulletproof Glass Industry Revenue billion Forecast, by Type 2020 & 2033
- Table 5: Global Bulletproof Glass Industry Revenue billion Forecast, by End-user Industry 2020 & 2033
- Table 6: Global Bulletproof Glass Industry Revenue billion Forecast, by Country 2020 & 2033
- Table 7: China Bulletproof Glass Industry Revenue (billion) Forecast, by Application 2020 & 2033
- Table 8: India Bulletproof Glass Industry Revenue (billion) Forecast, by Application 2020 & 2033
- Table 9: Japan Bulletproof Glass Industry Revenue (billion) Forecast, by Application 2020 & 2033
- Table 10: South Korea Bulletproof Glass Industry Revenue (billion) Forecast, by Application 2020 & 2033
- Table 11: Rest of Asia Pacific Bulletproof Glass Industry Revenue (billion) Forecast, by Application 2020 & 2033
- Table 12: Global Bulletproof Glass Industry Revenue billion Forecast, by Type 2020 & 2033
- Table 13: Global Bulletproof Glass Industry Revenue billion Forecast, by End-user Industry 2020 & 2033
- Table 14: Global Bulletproof Glass Industry Revenue billion Forecast, by Country 2020 & 2033
- Table 15: United States Bulletproof Glass Industry Revenue (billion) Forecast, by Application 2020 & 2033
- Table 16: Canada Bulletproof Glass Industry Revenue (billion) Forecast, by Application 2020 & 2033
- Table 17: Mexico Bulletproof Glass Industry Revenue (billion) Forecast, by Application 2020 & 2033
- Table 18: Global Bulletproof Glass Industry Revenue billion Forecast, by Type 2020 & 2033
- Table 19: Global Bulletproof Glass Industry Revenue billion Forecast, by End-user Industry 2020 & 2033
- Table 20: Global Bulletproof Glass Industry Revenue billion Forecast, by Country 2020 & 2033
- Table 21: Germany Bulletproof Glass Industry Revenue (billion) Forecast, by Application 2020 & 2033
- Table 22: United Kingdom Bulletproof Glass Industry Revenue (billion) Forecast, by Application 2020 & 2033
- Table 23: France Bulletproof Glass Industry Revenue (billion) Forecast, by Application 2020 & 2033
- Table 24: Italy Bulletproof Glass Industry Revenue (billion) Forecast, by Application 2020 & 2033
- Table 25: Rest of Europe Bulletproof Glass Industry Revenue (billion) Forecast, by Application 2020 & 2033
- Table 26: Global Bulletproof Glass Industry Revenue billion Forecast, by Type 2020 & 2033
- Table 27: Global Bulletproof Glass Industry Revenue billion Forecast, by End-user Industry 2020 & 2033
- Table 28: Global Bulletproof Glass Industry Revenue billion Forecast, by Country 2020 & 2033
- Table 29: Brazil Bulletproof Glass Industry Revenue (billion) Forecast, by Application 2020 & 2033
- Table 30: Argentina Bulletproof Glass Industry Revenue (billion) Forecast, by Application 2020 & 2033
- Table 31: Rest of South America Bulletproof Glass Industry Revenue (billion) Forecast, by Application 2020 & 2033
- Table 32: Global Bulletproof Glass Industry Revenue billion Forecast, by Type 2020 & 2033
- Table 33: Global Bulletproof Glass Industry Revenue billion Forecast, by End-user Industry 2020 & 2033
- Table 34: Global Bulletproof Glass Industry Revenue billion Forecast, by Country 2020 & 2033
- Table 35: Global Bulletproof Glass Industry Revenue billion Forecast, by Type 2020 & 2033
- Table 36: Global Bulletproof Glass Industry Revenue billion Forecast, by End-user Industry 2020 & 2033
- Table 37: Global Bulletproof Glass Industry Revenue billion Forecast, by Country 2020 & 2033
- Table 38: South Africa Bulletproof Glass Industry Revenue (billion) Forecast, by Application 2020 & 2033
- Table 39: Rest of Middle East Bulletproof Glass Industry Revenue (billion) Forecast, by Application 2020 & 2033
Frequently Asked Questions
1. What is the projected Compound Annual Growth Rate (CAGR) of the Bulletproof Glass Industry?
The projected CAGR is approximately 11.78%.
2. Which companies are prominent players in the Bulletproof Glass Industry?
Key companies in the market include Total Security Solutions*List Not Exhaustive, Nippon Sheet Glass Co Ltd, Fuyao Glass America, Saint-Gobain, Taiwan Glass Ind Corp, Armortex, Centigon Security Group, Guardian Industries Holdings, Asahi India Glass Limited, Armass glass, STEC ARMOUR GLASS, Consolidated Glass Holdings Inc, Binswanger Glass, Guangdong Golden Glass Technologies Limited, SCHOTT AG.
3. What are the main segments of the Bulletproof Glass Industry?
The market segments include Type, End-user Industry.
4. Can you provide details about the market size?
The market size is estimated to be USD 10.83 billion as of 2022.
5. What are some drivers contributing to market growth?
High Military Spending; Increased Development and Construction Activity.
6. What are the notable trends driving market growth?
Increasing Demand from Defense Sector to Dominate the Market.
7. Are there any restraints impacting market growth?
High-end pricing of Raw Materials.
8. Can you provide examples of recent developments in the market?
January 2023: Asahi India Glass Limited announced its collaboration with Enormous Brands to create brand films for its complete doors and windows solutions brand, AIS Windows. With this collaboration, AIS Windows is aiming to make a large impact in the doors and windows segment.
9. What pricing options are available for accessing the report?
Pricing options include single-user, multi-user, and enterprise licenses priced at USD 4750, USD 5250, and USD 8750 respectively.
10. Is the market size provided in terms of value or volume?
The market size is provided in terms of value, measured in billion.
11. Are there any specific market keywords associated with the report?
Yes, the market keyword associated with the report is "Bulletproof Glass Industry," which aids in identifying and referencing the specific market segment covered.
12. How do I determine which pricing option suits my needs best?
The pricing options vary based on user requirements and access needs. Individual users may opt for single-user licenses, while businesses requiring broader access may choose multi-user or enterprise licenses for cost-effective access to the report.
13. Are there any additional resources or data provided in the Bulletproof Glass Industry report?
While the report offers comprehensive insights, it's advisable to review the specific contents or supplementary materials provided to ascertain if additional resources or data are available.
14. How can I stay updated on further developments or reports in the Bulletproof Glass Industry?
To stay informed about further developments, trends, and reports in the Bulletproof Glass Industry, consider subscribing to industry newsletters, following relevant companies and organizations, or regularly checking reputable industry news sources and publications.
Methodology
Step 1 - Identification of Relevant Samples Size from Population Database


Step 2 - Approaches for Defining Global Market Size (Value, Volume* & Price*)

Note*: In applicable scenarios
Step 3 - Data Sources
Primary Research
- Web Analytics
- Survey Reports
- Research Institute
- Latest Research Reports
- Opinion Leaders
Secondary Research
- Annual Reports
- White Paper
- Latest Press Release
- Industry Association
- Paid Database
- Investor Presentations

Step 4 - Data Triangulation
Involves using different sources of information in order to increase the validity of a study
These sources are likely to be stakeholders in a program - participants, other researchers, program staff, other community members, and so on.
Then we put all data in single framework & apply various statistical tools to find out the dynamic on the market.
During the analysis stage, feedback from the stakeholder groups would be compared to determine areas of agreement as well as areas of divergence