

Key Insights
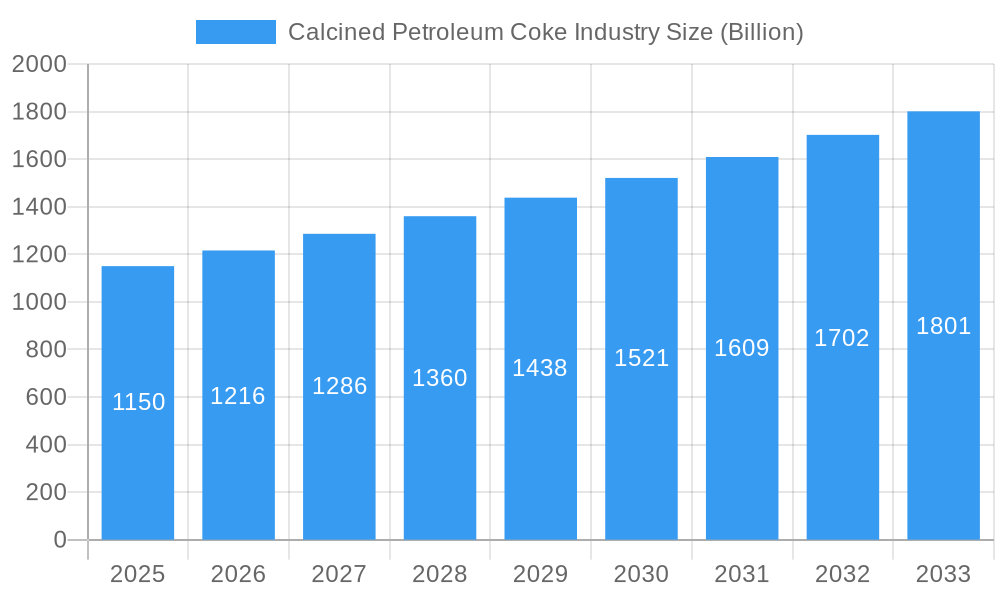
The calcined petroleum coke (CPC) market, valued at $1.15 billion in 2025, is projected to experience robust growth, driven by increasing demand from the aluminum and steel industries. The 5.45% CAGR indicates a steady expansion through 2033, fueled primarily by the rising global consumption of aluminum, which relies heavily on CPC as a key raw material in the smelting process. Furthermore, the growing adoption of CPC in the production of carbon anodes for the burgeoning green energy sector (specifically, battery manufacturing and renewable energy infrastructure) is contributing significantly to market expansion. While the market faces constraints from environmental regulations aimed at reducing carbon emissions and fluctuating crude oil prices, which influence CPC production costs, the overall demand outlook remains positive, especially within the Asia-Pacific region, projected to remain the largest consumer of CPC due to its substantial industrial activity and rapid economic growth. The segmentation of the market, based on fuel grade and calcined coke types and applications spanning green petroleum coke and others (bricks, glass, carbon products), further highlights the diverse applications fueling market growth. Major players like Oxbow Corporation, Petrocoque, and Rain Carbon Inc. are strategically positioned to benefit from this expanding market, focusing on innovation, supply chain optimization, and expansion into new geographic regions to maintain competitiveness.
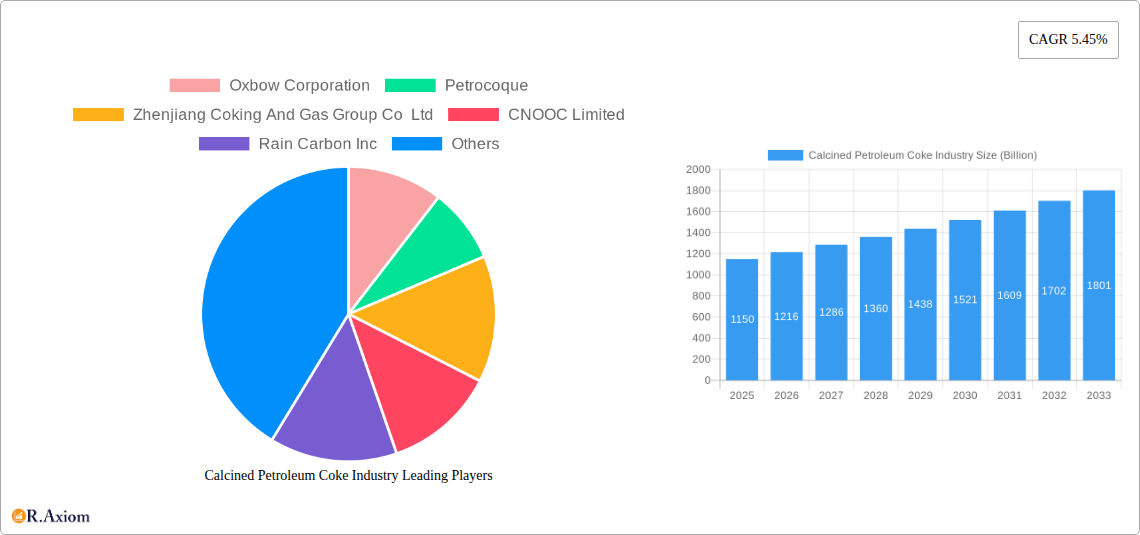
Calcined Petroleum Coke Industry Market Size (In Billion)
The competitive landscape is characterized by both large multinational corporations and regional players. Companies are increasingly focusing on sustainable production practices and exploring alternative feedstocks to address environmental concerns. Technological advancements aimed at improving CPC quality and reducing emissions are also expected to shape market dynamics. The North American market, while significant, faces increasing competition from Asia-Pacific, particularly China, which holds a large share due to its robust aluminum and steel industries. The ongoing growth in infrastructure projects globally, and the increasing use of CPC in various sectors besides aluminum smelting and steel production, further contributes to the positive market trajectory. Future growth will likely depend on successful navigation of environmental regulations, the stability of crude oil prices, and continued innovation in CPC production and application technologies.
Calcined Petroleum Coke Industry Company Market Share
This comprehensive report provides a detailed analysis of the global calcined petroleum coke (CPC) industry, covering market size, growth drivers, key players, and future outlook. The study period spans from 2019 to 2033, with 2025 serving as both the base and estimated year. The forecast period is 2025-2033, and the historical period is 2019-2024. This report is crucial for industry stakeholders, investors, and researchers seeking actionable insights into this dynamic market. The total market value is estimated at $XX Billion in 2025 and is projected to reach $XX Billion by 2033.
Calcined Petroleum Coke Industry Market Concentration & Innovation
The calcined petroleum coke industry exhibits a moderately concentrated market structure, with a few major players commanding significant market share. Oxbow Corporation, Rain Carbon Inc., and BP PLC are among the leading companies, collectively holding an estimated xx% market share in 2025. However, the presence of numerous regional players and emerging companies contributes to competitive intensity.
Innovation in the CPC industry is primarily driven by the need for improved product quality, enhanced sustainability practices, and diversification into new applications. Key areas of innovation include:
- Improved Calcination Processes: Focus on enhancing energy efficiency and reducing emissions.
- Value-Added Product Development: Exploring new applications for CPC beyond traditional uses in aluminum production and electrodes.
- Waste Reduction and Recycling: Developing technologies to minimize CPC waste and explore recycling opportunities.
Regulatory frameworks, particularly those focused on environmental protection and carbon emissions, significantly influence industry practices. The industry faces pressure to adopt sustainable production methods and reduce its environmental footprint. Substitutes for CPC, such as graphite and other carbon-based materials, pose a competitive challenge, especially in specific applications. End-user trends towards sustainable materials and increased demand for high-quality products are driving industry innovation.
Mergers and acquisitions (M&A) activity in the CPC industry has been relatively moderate. Notable recent transactions include the acquisition of DCP Midstream by Phillips 66 in January 2023 (USD 41.75 per standard unit), which strengthened Phillips 66's position in the petroleum coke value chain. The total M&A deal value in the industry for 2022 is estimated to be $XX Billion.
Calcined Petroleum Coke Industry Industry Trends & Insights
The global calcined petroleum coke market is experiencing significant growth, driven by increasing demand from key industries, including aluminum smelting, and the growing use of CPC in other applications. The market is expected to witness a Compound Annual Growth Rate (CAGR) of xx% during the forecast period (2025-2033). This robust growth is fueled by several factors, including:
- Expanding Aluminum Production: The continuous expansion of the aluminum industry remains the largest driver of CPC demand.
- Growth in Other Applications: Growing applications of CPC in carbon products, bricks, glass, and other industries contribute to market expansion.
- Technological Advancements: Innovations in calcination technologies and product development are enhancing the quality and value of CPC.
However, the industry also faces challenges, including fluctuating crude oil prices, environmental concerns, and the availability of substitute materials. Market penetration of CPC in various applications varies significantly depending on region, cost-competitiveness, and availability of alternative solutions. Competitive dynamics are shaped by pricing strategies, product differentiation, and the ability to meet evolving customer needs and stringent environmental regulations.
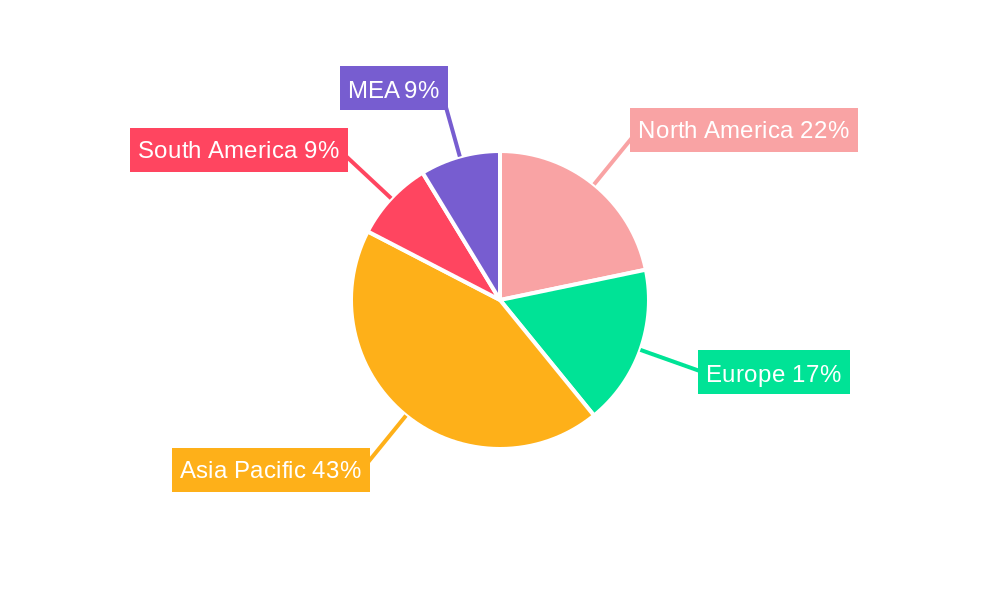
Dominant Markets & Segments in Calcined Petroleum Coke Industry
The Asia-Pacific region dominates the global calcined petroleum coke market, driven by substantial aluminum production and a large and expanding industrial sector. China, India, and other Southeast Asian countries are major consumers of CPC.
- Key Drivers in Asia-Pacific:
- Rapid industrialization and urbanization.
- Significant aluminum production capacity.
- Favorable government policies supporting industrial growth.
Segment Analysis:
Type: The Fuel Grade segment holds the largest market share, followed by Calcined Coke. The Fuel Grade segment is projected to grow at a CAGR of xx% during the forecast period due to the sustained demand from the power and energy sector. The Calcined Coke segment is driven by its extensive use in various industrial applications.
Application: The Green Petroleum Coke application segment shows strong growth potential due to increasing environmental consciousness and stricter regulations. The Others (Bricks, Glass, Carbon Products, etc.) segment displays steady growth, driven by consistent demand from these diverse sectors.
Calcined Petroleum Coke Industry Product Developments
Recent product innovations have focused on enhancing the quality and consistency of CPC, reducing impurities, and improving its performance in various applications. Technological advancements in calcination processes aim for greater energy efficiency and reduced emissions. The industry also witnesses the development of new CPC-based products tailored for specific end-use applications. These developments contribute to CPC's competitive advantage in several sectors, particularly in the production of high-quality electrodes, carbon products, and building materials.
Report Scope & Segmentation Analysis
This report provides a comprehensive segmentation of the calcined petroleum coke market, including:
- By Type: Fuel Grade, Calcined Coke
- By Application: Green Petroleum Coke, Others (Bricks, Glass, Carbon Products, etc.)
Each segment's market size, growth projections, and competitive landscape are thoroughly analyzed, offering detailed insights into the market's diverse structure and future potential. Growth projections are based on rigorous market research and industry trends analysis.
Key Drivers of Calcined Petroleum Coke Industry Growth
The growth of the calcined petroleum coke industry is driven by several factors:
- Robust growth of the aluminum industry: CPC is a crucial raw material in aluminum smelting, and the expansion of the aluminum industry fuels CPC demand.
- Increasing use of CPC in other industries: The use of CPC in the production of graphite electrodes, carbon products, and building materials is driving market growth.
- Technological advancements: Improving calcination techniques are improving the quality and performance of CPC.
Challenges in the Calcined Petroleum Coke Industry Sector
The calcined petroleum coke industry faces several challenges:
- Environmental concerns: The production and use of CPC raise environmental concerns due to emissions and waste generation. Stringent environmental regulations impact production costs and profitability.
- Fluctuating crude oil prices: CPC is a byproduct of crude oil refining, making its cost sensitive to fluctuations in crude oil prices.
- Competition from alternative materials: The availability of substitute materials, such as graphite, poses a competitive challenge. These factors collectively impact industry supply chains and profitability.
Emerging Opportunities in Calcined Petroleum Coke Industry
Emerging opportunities exist in several areas:
- Sustainable CPC production: Developing eco-friendly calcination processes and reducing environmental impact.
- New applications: Exploring new applications for CPC in emerging sectors like renewable energy and advanced materials.
- Value-added products: Developing high-value CPC products tailored to specific end-use applications. These opportunities provide avenues for growth and innovation.
Leading Players in the Calcined Petroleum Coke Industry Market
- Oxbow Corporation
- Petrocoque
- Zhenjiang Coking And Gas Group Co Ltd
- CNOOC Limited
- Rain Carbon Inc
- Aluminium Bahrain B S C (Alba)
- Rio Tinto
- Numaligarh Refinery Limited
- Phillips 66 Company
- Maniayargroup
- Saudi Calcined Petroleum Coke Company (SCPC)
- BP PLC
- ELSID SA
Key Developments in Calcined Petroleum Coke Industry Industry
- January 2023: Phillips 66 acquired all publicly traded standard units representing limited partner interests in DCP Midstream, increasing its economic interest to 86.8%. This acquisition significantly strengthens Phillips 66’s position in the petroleum coke value chain and is expected to boost market productivity.
- June 2022: ExxonMobil and Texas A&M University researchers developed a method to reprocess petroleum coke into graphene using electrochemical exfoliation, opening up potential for high-value applications and waste reduction.
Strategic Outlook for Calcined Petroleum Coke Industry Market
The calcined petroleum coke market is poised for continued growth, driven by the expanding aluminum industry and growing demand from other sectors. Opportunities lie in developing sustainable production methods, exploring new applications, and creating value-added products. Strategic partnerships, technological innovation, and effective risk management will be crucial for companies to succeed in this evolving market. The market's future success hinges on addressing environmental concerns, managing fluctuating crude oil prices, and competing effectively against substitute materials.
Calcined Petroleum Coke Industry Segmentation
-
1. Type
- 1.1. Fuel Grade
- 1.2. Calcined Coke
-
2. Application
-
2.1. Green Petroleum Coke
- 2.1.1. Aluminum
- 2.1.2. Fuel
- 2.1.3. Iron and steel
- 2.1.4. Silicon Metal
- 2.1.5. Others (Bricks, Glass, Carbon Products, etc)
-
2.2. Calcined Petroleum Coke
- 2.2.1. Titanium Dioxide
- 2.2.2. Re-carburizing Market
- 2.2.3. Others (Needle Coke, Carbon Products, etc)
-
2.1. Green Petroleum Coke
Calcined Petroleum Coke Industry Segmentation By Geography
-
1. Asia Pacific
- 1.1. China
- 1.2. India
- 1.3. Japan
- 1.4. South Korea
- 1.5. ASEAN Countries
- 1.6. Rest of Asia Pacific
-
2. North America
- 2.1. United States
- 2.2. Canada
- 2.3. Mexico
-
3. Europe
- 3.1. Germany
- 3.2. United Kingdom
- 3.3. Italy
- 3.4. France
- 3.5. Spain
- 3.6. Rest of Europe
-
4. South America
- 4.1. Brazil
- 4.2. Argentina
- 4.3. Rest of South America
-
5. Middle East and Africa
- 5.1. Saudi Arabia
- 5.2. South Africa
- 5.3. Rest of Middle East and Africa
Calcined Petroleum Coke Industry Regional Market Share
Geographic Coverage of Calcined Petroleum Coke Industry
Calcined Petroleum Coke Industry REPORT HIGHLIGHTS
| Aspects | Details |
|---|---|
| Study Period | 2020-2034 |
| Base Year | 2025 |
| Estimated Year | 2026 |
| Forecast Period | 2026-2034 |
| Historical Period | 2020-2025 |
| Growth Rate | CAGR of 5.45% from 2020-2034 |
| Segmentation |
|
Table of Contents
- 1. Introduction
- 1.1. Research Scope
- 1.2. Market Segmentation
- 1.3. Research Objective
- 1.4. Definitions and Assumptions
- 2. Executive Summary
- 2.1. Market Snapshot
- 3. Market Dynamics
- 3.1. Market Drivers
- 3.2. Market Restrains
- 3.3. Market Trends
- 3.4. Market Opportunities
- 4. Market Factor Analysis
- 4.1. Porters Five Forces
- 4.1.1. Bargaining Power of Suppliers
- 4.1.2. Bargaining Power of Buyers
- 4.1.3. Threat of New Entrants
- 4.1.4. Threat of Substitutes
- 4.1.5. Competitive Rivalry
- 4.2. PESTEL analysis
- 4.3. BCG Analysis
- 4.3.1. Stars (High Growth, High Market Share)
- 4.3.2. Cash Cows (Low Growth, High Market Share)
- 4.3.3. Question Mark (High Growth, Low Market Share)
- 4.3.4. Dogs (Low Growth, Low Market Share)
- 4.4. Ansoff Matrix Analysis
- 4.5. Supply Chain Analysis
- 4.6. Regulatory Landscape
- 4.7. Current Market Potential and Opportunity Assessment (TAM–SAM–SOM Framework)
- 4.8. RAX Analyst Note
- 4.1. Porters Five Forces
- 5. Market Analysis, Insights and Forecast 2021-2033
- 5.1. Market Analysis, Insights and Forecast - by Type
- 5.1.1. Fuel Grade
- 5.1.2. Calcined Coke
- 5.2. Market Analysis, Insights and Forecast - by Application
- 5.2.1. Green Petroleum Coke
- 5.2.1.1. Aluminum
- 5.2.1.2. Fuel
- 5.2.1.3. Iron and steel
- 5.2.1.4. Silicon Metal
- 5.2.1.5. Others (Bricks, Glass, Carbon Products, etc)
- 5.2.2. Calcined Petroleum Coke
- 5.2.2.1. Titanium Dioxide
- 5.2.2.2. Re-carburizing Market
- 5.2.2.3. Others (Needle Coke, Carbon Products, etc)
- 5.2.1. Green Petroleum Coke
- 5.3. Market Analysis, Insights and Forecast - by Region
- 5.3.1. Asia Pacific
- 5.3.2. North America
- 5.3.3. Europe
- 5.3.4. South America
- 5.3.5. Middle East and Africa
- 5.1. Market Analysis, Insights and Forecast - by Type
- 6. Global Calcined Petroleum Coke Industry Analysis, Insights and Forecast, 2021-2033
- 6.1. Market Analysis, Insights and Forecast - by Type
- 6.1.1. Fuel Grade
- 6.1.2. Calcined Coke
- 6.2. Market Analysis, Insights and Forecast - by Application
- 6.2.1. Green Petroleum Coke
- 6.2.1.1. Aluminum
- 6.2.1.2. Fuel
- 6.2.1.3. Iron and steel
- 6.2.1.4. Silicon Metal
- 6.2.1.5. Others (Bricks, Glass, Carbon Products, etc)
- 6.2.2. Calcined Petroleum Coke
- 6.2.2.1. Titanium Dioxide
- 6.2.2.2. Re-carburizing Market
- 6.2.2.3. Others (Needle Coke, Carbon Products, etc)
- 6.2.1. Green Petroleum Coke
- 6.1. Market Analysis, Insights and Forecast - by Type
- 7. Asia Pacific Calcined Petroleum Coke Industry Analysis, Insights and Forecast, 2020-2032
- 7.1. Market Analysis, Insights and Forecast - by Type
- 7.1.1. Fuel Grade
- 7.1.2. Calcined Coke
- 7.2. Market Analysis, Insights and Forecast - by Application
- 7.2.1. Green Petroleum Coke
- 7.2.1.1. Aluminum
- 7.2.1.2. Fuel
- 7.2.1.3. Iron and steel
- 7.2.1.4. Silicon Metal
- 7.2.1.5. Others (Bricks, Glass, Carbon Products, etc)
- 7.2.2. Calcined Petroleum Coke
- 7.2.2.1. Titanium Dioxide
- 7.2.2.2. Re-carburizing Market
- 7.2.2.3. Others (Needle Coke, Carbon Products, etc)
- 7.2.1. Green Petroleum Coke
- 7.1. Market Analysis, Insights and Forecast - by Type
- 8. North America Calcined Petroleum Coke Industry Analysis, Insights and Forecast, 2020-2032
- 8.1. Market Analysis, Insights and Forecast - by Type
- 8.1.1. Fuel Grade
- 8.1.2. Calcined Coke
- 8.2. Market Analysis, Insights and Forecast - by Application
- 8.2.1. Green Petroleum Coke
- 8.2.1.1. Aluminum
- 8.2.1.2. Fuel
- 8.2.1.3. Iron and steel
- 8.2.1.4. Silicon Metal
- 8.2.1.5. Others (Bricks, Glass, Carbon Products, etc)
- 8.2.2. Calcined Petroleum Coke
- 8.2.2.1. Titanium Dioxide
- 8.2.2.2. Re-carburizing Market
- 8.2.2.3. Others (Needle Coke, Carbon Products, etc)
- 8.2.1. Green Petroleum Coke
- 8.1. Market Analysis, Insights and Forecast - by Type
- 9. Europe Calcined Petroleum Coke Industry Analysis, Insights and Forecast, 2020-2032
- 9.1. Market Analysis, Insights and Forecast - by Type
- 9.1.1. Fuel Grade
- 9.1.2. Calcined Coke
- 9.2. Market Analysis, Insights and Forecast - by Application
- 9.2.1. Green Petroleum Coke
- 9.2.1.1. Aluminum
- 9.2.1.2. Fuel
- 9.2.1.3. Iron and steel
- 9.2.1.4. Silicon Metal
- 9.2.1.5. Others (Bricks, Glass, Carbon Products, etc)
- 9.2.2. Calcined Petroleum Coke
- 9.2.2.1. Titanium Dioxide
- 9.2.2.2. Re-carburizing Market
- 9.2.2.3. Others (Needle Coke, Carbon Products, etc)
- 9.2.1. Green Petroleum Coke
- 9.1. Market Analysis, Insights and Forecast - by Type
- 10. South America Calcined Petroleum Coke Industry Analysis, Insights and Forecast, 2020-2032
- 10.1. Market Analysis, Insights and Forecast - by Type
- 10.1.1. Fuel Grade
- 10.1.2. Calcined Coke
- 10.2. Market Analysis, Insights and Forecast - by Application
- 10.2.1. Green Petroleum Coke
- 10.2.1.1. Aluminum
- 10.2.1.2. Fuel
- 10.2.1.3. Iron and steel
- 10.2.1.4. Silicon Metal
- 10.2.1.5. Others (Bricks, Glass, Carbon Products, etc)
- 10.2.2. Calcined Petroleum Coke
- 10.2.2.1. Titanium Dioxide
- 10.2.2.2. Re-carburizing Market
- 10.2.2.3. Others (Needle Coke, Carbon Products, etc)
- 10.2.1. Green Petroleum Coke
- 10.1. Market Analysis, Insights and Forecast - by Type
- 11. Middle East and Africa Calcined Petroleum Coke Industry Analysis, Insights and Forecast, 2020-2032
- 11.1. Market Analysis, Insights and Forecast - by Type
- 11.1.1. Fuel Grade
- 11.1.2. Calcined Coke
- 11.2. Market Analysis, Insights and Forecast - by Application
- 11.2.1. Green Petroleum Coke
- 11.2.1.1. Aluminum
- 11.2.1.2. Fuel
- 11.2.1.3. Iron and steel
- 11.2.1.4. Silicon Metal
- 11.2.1.5. Others (Bricks, Glass, Carbon Products, etc)
- 11.2.2. Calcined Petroleum Coke
- 11.2.2.1. Titanium Dioxide
- 11.2.2.2. Re-carburizing Market
- 11.2.2.3. Others (Needle Coke, Carbon Products, etc)
- 11.2.1. Green Petroleum Coke
- 11.1. Market Analysis, Insights and Forecast - by Type
- 12. Competitive Analysis
- 12.1. Company Profiles
- 12.1.1 Oxbow Corporation
- 12.1.1.1. Company Overview
- 12.1.1.2. Products
- 12.1.1.3. Company Financials
- 12.1.1.4. SWOT Analysis
- 12.1.2 Petrocoque
- 12.1.2.1. Company Overview
- 12.1.2.2. Products
- 12.1.2.3. Company Financials
- 12.1.2.4. SWOT Analysis
- 12.1.3 Zhenjiang Coking And Gas Group Co Ltd
- 12.1.3.1. Company Overview
- 12.1.3.2. Products
- 12.1.3.3. Company Financials
- 12.1.3.4. SWOT Analysis
- 12.1.4 CNOOC Limited
- 12.1.4.1. Company Overview
- 12.1.4.2. Products
- 12.1.4.3. Company Financials
- 12.1.4.4. SWOT Analysis
- 12.1.5 Rain Carbon Inc
- 12.1.5.1. Company Overview
- 12.1.5.2. Products
- 12.1.5.3. Company Financials
- 12.1.5.4. SWOT Analysis
- 12.1.6 Aluminium Bahrain B S C (Alba)
- 12.1.6.1. Company Overview
- 12.1.6.2. Products
- 12.1.6.3. Company Financials
- 12.1.6.4. SWOT Analysis
- 12.1.7 Rio Tinto
- 12.1.7.1. Company Overview
- 12.1.7.2. Products
- 12.1.7.3. Company Financials
- 12.1.7.4. SWOT Analysis
- 12.1.8 Numaligarh Refinery Limited
- 12.1.8.1. Company Overview
- 12.1.8.2. Products
- 12.1.8.3. Company Financials
- 12.1.8.4. SWOT Analysis
- 12.1.9 Phillips 66 Company
- 12.1.9.1. Company Overview
- 12.1.9.2. Products
- 12.1.9.3. Company Financials
- 12.1.9.4. SWOT Analysis
- 12.1.10 Maniayargroup
- 12.1.10.1. Company Overview
- 12.1.10.2. Products
- 12.1.10.3. Company Financials
- 12.1.10.4. SWOT Analysis
- 12.1.11 Saudi Calcined Petroleum Coke Company (SCPC)
- 12.1.11.1. Company Overview
- 12.1.11.2. Products
- 12.1.11.3. Company Financials
- 12.1.11.4. SWOT Analysis
- 12.1.12 BP PLC
- 12.1.12.1. Company Overview
- 12.1.12.2. Products
- 12.1.12.3. Company Financials
- 12.1.12.4. SWOT Analysis
- 12.1.13 ELSID SA
- 12.1.13.1. Company Overview
- 12.1.13.2. Products
- 12.1.13.3. Company Financials
- 12.1.13.4. SWOT Analysis
- 12.1.1 Oxbow Corporation
- 12.2. Market Entropy
- 12.2.1 Company's Key Areas Served
- 12.2.2 Recent Developments
- 12.3. Company Market Share Analysis 2025
- 12.3.1 Top 5 Companies Market Share Analysis
- 12.3.2 Top 3 Companies Market Share Analysis
- 12.4. List of Potential Customers
- 13. Research Methodology
List of Figures
- Figure 1: Global Calcined Petroleum Coke Industry Revenue Breakdown (Billion, %) by Region 2025 & 2033
- Figure 2: Global Calcined Petroleum Coke Industry Volume Breakdown (K Tons, %) by Region 2025 & 2033
- Figure 3: Asia Pacific Calcined Petroleum Coke Industry Revenue (Billion), by Type 2025 & 2033
- Figure 4: Asia Pacific Calcined Petroleum Coke Industry Volume (K Tons), by Type 2025 & 2033
- Figure 5: Asia Pacific Calcined Petroleum Coke Industry Revenue Share (%), by Type 2025 & 2033
- Figure 6: Asia Pacific Calcined Petroleum Coke Industry Volume Share (%), by Type 2025 & 2033
- Figure 7: Asia Pacific Calcined Petroleum Coke Industry Revenue (Billion), by Application 2025 & 2033
- Figure 8: Asia Pacific Calcined Petroleum Coke Industry Volume (K Tons), by Application 2025 & 2033
- Figure 9: Asia Pacific Calcined Petroleum Coke Industry Revenue Share (%), by Application 2025 & 2033
- Figure 10: Asia Pacific Calcined Petroleum Coke Industry Volume Share (%), by Application 2025 & 2033
- Figure 11: Asia Pacific Calcined Petroleum Coke Industry Revenue (Billion), by Country 2025 & 2033
- Figure 12: Asia Pacific Calcined Petroleum Coke Industry Volume (K Tons), by Country 2025 & 2033
- Figure 13: Asia Pacific Calcined Petroleum Coke Industry Revenue Share (%), by Country 2025 & 2033
- Figure 14: Asia Pacific Calcined Petroleum Coke Industry Volume Share (%), by Country 2025 & 2033
- Figure 15: North America Calcined Petroleum Coke Industry Revenue (Billion), by Type 2025 & 2033
- Figure 16: North America Calcined Petroleum Coke Industry Volume (K Tons), by Type 2025 & 2033
- Figure 17: North America Calcined Petroleum Coke Industry Revenue Share (%), by Type 2025 & 2033
- Figure 18: North America Calcined Petroleum Coke Industry Volume Share (%), by Type 2025 & 2033
- Figure 19: North America Calcined Petroleum Coke Industry Revenue (Billion), by Application 2025 & 2033
- Figure 20: North America Calcined Petroleum Coke Industry Volume (K Tons), by Application 2025 & 2033
- Figure 21: North America Calcined Petroleum Coke Industry Revenue Share (%), by Application 2025 & 2033
- Figure 22: North America Calcined Petroleum Coke Industry Volume Share (%), by Application 2025 & 2033
- Figure 23: North America Calcined Petroleum Coke Industry Revenue (Billion), by Country 2025 & 2033
- Figure 24: North America Calcined Petroleum Coke Industry Volume (K Tons), by Country 2025 & 2033
- Figure 25: North America Calcined Petroleum Coke Industry Revenue Share (%), by Country 2025 & 2033
- Figure 26: North America Calcined Petroleum Coke Industry Volume Share (%), by Country 2025 & 2033
- Figure 27: Europe Calcined Petroleum Coke Industry Revenue (Billion), by Type 2025 & 2033
- Figure 28: Europe Calcined Petroleum Coke Industry Volume (K Tons), by Type 2025 & 2033
- Figure 29: Europe Calcined Petroleum Coke Industry Revenue Share (%), by Type 2025 & 2033
- Figure 30: Europe Calcined Petroleum Coke Industry Volume Share (%), by Type 2025 & 2033
- Figure 31: Europe Calcined Petroleum Coke Industry Revenue (Billion), by Application 2025 & 2033
- Figure 32: Europe Calcined Petroleum Coke Industry Volume (K Tons), by Application 2025 & 2033
- Figure 33: Europe Calcined Petroleum Coke Industry Revenue Share (%), by Application 2025 & 2033
- Figure 34: Europe Calcined Petroleum Coke Industry Volume Share (%), by Application 2025 & 2033
- Figure 35: Europe Calcined Petroleum Coke Industry Revenue (Billion), by Country 2025 & 2033
- Figure 36: Europe Calcined Petroleum Coke Industry Volume (K Tons), by Country 2025 & 2033
- Figure 37: Europe Calcined Petroleum Coke Industry Revenue Share (%), by Country 2025 & 2033
- Figure 38: Europe Calcined Petroleum Coke Industry Volume Share (%), by Country 2025 & 2033
- Figure 39: South America Calcined Petroleum Coke Industry Revenue (Billion), by Type 2025 & 2033
- Figure 40: South America Calcined Petroleum Coke Industry Volume (K Tons), by Type 2025 & 2033
- Figure 41: South America Calcined Petroleum Coke Industry Revenue Share (%), by Type 2025 & 2033
- Figure 42: South America Calcined Petroleum Coke Industry Volume Share (%), by Type 2025 & 2033
- Figure 43: South America Calcined Petroleum Coke Industry Revenue (Billion), by Application 2025 & 2033
- Figure 44: South America Calcined Petroleum Coke Industry Volume (K Tons), by Application 2025 & 2033
- Figure 45: South America Calcined Petroleum Coke Industry Revenue Share (%), by Application 2025 & 2033
- Figure 46: South America Calcined Petroleum Coke Industry Volume Share (%), by Application 2025 & 2033
- Figure 47: South America Calcined Petroleum Coke Industry Revenue (Billion), by Country 2025 & 2033
- Figure 48: South America Calcined Petroleum Coke Industry Volume (K Tons), by Country 2025 & 2033
- Figure 49: South America Calcined Petroleum Coke Industry Revenue Share (%), by Country 2025 & 2033
- Figure 50: South America Calcined Petroleum Coke Industry Volume Share (%), by Country 2025 & 2033
- Figure 51: Middle East and Africa Calcined Petroleum Coke Industry Revenue (Billion), by Type 2025 & 2033
- Figure 52: Middle East and Africa Calcined Petroleum Coke Industry Volume (K Tons), by Type 2025 & 2033
- Figure 53: Middle East and Africa Calcined Petroleum Coke Industry Revenue Share (%), by Type 2025 & 2033
- Figure 54: Middle East and Africa Calcined Petroleum Coke Industry Volume Share (%), by Type 2025 & 2033
- Figure 55: Middle East and Africa Calcined Petroleum Coke Industry Revenue (Billion), by Application 2025 & 2033
- Figure 56: Middle East and Africa Calcined Petroleum Coke Industry Volume (K Tons), by Application 2025 & 2033
- Figure 57: Middle East and Africa Calcined Petroleum Coke Industry Revenue Share (%), by Application 2025 & 2033
- Figure 58: Middle East and Africa Calcined Petroleum Coke Industry Volume Share (%), by Application 2025 & 2033
- Figure 59: Middle East and Africa Calcined Petroleum Coke Industry Revenue (Billion), by Country 2025 & 2033
- Figure 60: Middle East and Africa Calcined Petroleum Coke Industry Volume (K Tons), by Country 2025 & 2033
- Figure 61: Middle East and Africa Calcined Petroleum Coke Industry Revenue Share (%), by Country 2025 & 2033
- Figure 62: Middle East and Africa Calcined Petroleum Coke Industry Volume Share (%), by Country 2025 & 2033
List of Tables
- Table 1: Global Calcined Petroleum Coke Industry Revenue Billion Forecast, by Type 2020 & 2033
- Table 2: Global Calcined Petroleum Coke Industry Volume K Tons Forecast, by Type 2020 & 2033
- Table 3: Global Calcined Petroleum Coke Industry Revenue Billion Forecast, by Application 2020 & 2033
- Table 4: Global Calcined Petroleum Coke Industry Volume K Tons Forecast, by Application 2020 & 2033
- Table 5: Global Calcined Petroleum Coke Industry Revenue Billion Forecast, by Region 2020 & 2033
- Table 6: Global Calcined Petroleum Coke Industry Volume K Tons Forecast, by Region 2020 & 2033
- Table 7: Global Calcined Petroleum Coke Industry Revenue Billion Forecast, by Type 2020 & 2033
- Table 8: Global Calcined Petroleum Coke Industry Volume K Tons Forecast, by Type 2020 & 2033
- Table 9: Global Calcined Petroleum Coke Industry Revenue Billion Forecast, by Application 2020 & 2033
- Table 10: Global Calcined Petroleum Coke Industry Volume K Tons Forecast, by Application 2020 & 2033
- Table 11: Global Calcined Petroleum Coke Industry Revenue Billion Forecast, by Country 2020 & 2033
- Table 12: Global Calcined Petroleum Coke Industry Volume K Tons Forecast, by Country 2020 & 2033
- Table 13: China Calcined Petroleum Coke Industry Revenue (Billion) Forecast, by Application 2020 & 2033
- Table 14: China Calcined Petroleum Coke Industry Volume (K Tons) Forecast, by Application 2020 & 2033
- Table 15: India Calcined Petroleum Coke Industry Revenue (Billion) Forecast, by Application 2020 & 2033
- Table 16: India Calcined Petroleum Coke Industry Volume (K Tons) Forecast, by Application 2020 & 2033
- Table 17: Japan Calcined Petroleum Coke Industry Revenue (Billion) Forecast, by Application 2020 & 2033
- Table 18: Japan Calcined Petroleum Coke Industry Volume (K Tons) Forecast, by Application 2020 & 2033
- Table 19: South Korea Calcined Petroleum Coke Industry Revenue (Billion) Forecast, by Application 2020 & 2033
- Table 20: South Korea Calcined Petroleum Coke Industry Volume (K Tons) Forecast, by Application 2020 & 2033
- Table 21: ASEAN Countries Calcined Petroleum Coke Industry Revenue (Billion) Forecast, by Application 2020 & 2033
- Table 22: ASEAN Countries Calcined Petroleum Coke Industry Volume (K Tons) Forecast, by Application 2020 & 2033
- Table 23: Rest of Asia Pacific Calcined Petroleum Coke Industry Revenue (Billion) Forecast, by Application 2020 & 2033
- Table 24: Rest of Asia Pacific Calcined Petroleum Coke Industry Volume (K Tons) Forecast, by Application 2020 & 2033
- Table 25: Global Calcined Petroleum Coke Industry Revenue Billion Forecast, by Type 2020 & 2033
- Table 26: Global Calcined Petroleum Coke Industry Volume K Tons Forecast, by Type 2020 & 2033
- Table 27: Global Calcined Petroleum Coke Industry Revenue Billion Forecast, by Application 2020 & 2033
- Table 28: Global Calcined Petroleum Coke Industry Volume K Tons Forecast, by Application 2020 & 2033
- Table 29: Global Calcined Petroleum Coke Industry Revenue Billion Forecast, by Country 2020 & 2033
- Table 30: Global Calcined Petroleum Coke Industry Volume K Tons Forecast, by Country 2020 & 2033
- Table 31: United States Calcined Petroleum Coke Industry Revenue (Billion) Forecast, by Application 2020 & 2033
- Table 32: United States Calcined Petroleum Coke Industry Volume (K Tons) Forecast, by Application 2020 & 2033
- Table 33: Canada Calcined Petroleum Coke Industry Revenue (Billion) Forecast, by Application 2020 & 2033
- Table 34: Canada Calcined Petroleum Coke Industry Volume (K Tons) Forecast, by Application 2020 & 2033
- Table 35: Mexico Calcined Petroleum Coke Industry Revenue (Billion) Forecast, by Application 2020 & 2033
- Table 36: Mexico Calcined Petroleum Coke Industry Volume (K Tons) Forecast, by Application 2020 & 2033
- Table 37: Global Calcined Petroleum Coke Industry Revenue Billion Forecast, by Type 2020 & 2033
- Table 38: Global Calcined Petroleum Coke Industry Volume K Tons Forecast, by Type 2020 & 2033
- Table 39: Global Calcined Petroleum Coke Industry Revenue Billion Forecast, by Application 2020 & 2033
- Table 40: Global Calcined Petroleum Coke Industry Volume K Tons Forecast, by Application 2020 & 2033
- Table 41: Global Calcined Petroleum Coke Industry Revenue Billion Forecast, by Country 2020 & 2033
- Table 42: Global Calcined Petroleum Coke Industry Volume K Tons Forecast, by Country 2020 & 2033
- Table 43: Germany Calcined Petroleum Coke Industry Revenue (Billion) Forecast, by Application 2020 & 2033
- Table 44: Germany Calcined Petroleum Coke Industry Volume (K Tons) Forecast, by Application 2020 & 2033
- Table 45: United Kingdom Calcined Petroleum Coke Industry Revenue (Billion) Forecast, by Application 2020 & 2033
- Table 46: United Kingdom Calcined Petroleum Coke Industry Volume (K Tons) Forecast, by Application 2020 & 2033
- Table 47: Italy Calcined Petroleum Coke Industry Revenue (Billion) Forecast, by Application 2020 & 2033
- Table 48: Italy Calcined Petroleum Coke Industry Volume (K Tons) Forecast, by Application 2020 & 2033
- Table 49: France Calcined Petroleum Coke Industry Revenue (Billion) Forecast, by Application 2020 & 2033
- Table 50: France Calcined Petroleum Coke Industry Volume (K Tons) Forecast, by Application 2020 & 2033
- Table 51: Spain Calcined Petroleum Coke Industry Revenue (Billion) Forecast, by Application 2020 & 2033
- Table 52: Spain Calcined Petroleum Coke Industry Volume (K Tons) Forecast, by Application 2020 & 2033
- Table 53: Rest of Europe Calcined Petroleum Coke Industry Revenue (Billion) Forecast, by Application 2020 & 2033
- Table 54: Rest of Europe Calcined Petroleum Coke Industry Volume (K Tons) Forecast, by Application 2020 & 2033
- Table 55: Global Calcined Petroleum Coke Industry Revenue Billion Forecast, by Type 2020 & 2033
- Table 56: Global Calcined Petroleum Coke Industry Volume K Tons Forecast, by Type 2020 & 2033
- Table 57: Global Calcined Petroleum Coke Industry Revenue Billion Forecast, by Application 2020 & 2033
- Table 58: Global Calcined Petroleum Coke Industry Volume K Tons Forecast, by Application 2020 & 2033
- Table 59: Global Calcined Petroleum Coke Industry Revenue Billion Forecast, by Country 2020 & 2033
- Table 60: Global Calcined Petroleum Coke Industry Volume K Tons Forecast, by Country 2020 & 2033
- Table 61: Brazil Calcined Petroleum Coke Industry Revenue (Billion) Forecast, by Application 2020 & 2033
- Table 62: Brazil Calcined Petroleum Coke Industry Volume (K Tons) Forecast, by Application 2020 & 2033
- Table 63: Argentina Calcined Petroleum Coke Industry Revenue (Billion) Forecast, by Application 2020 & 2033
- Table 64: Argentina Calcined Petroleum Coke Industry Volume (K Tons) Forecast, by Application 2020 & 2033
- Table 65: Rest of South America Calcined Petroleum Coke Industry Revenue (Billion) Forecast, by Application 2020 & 2033
- Table 66: Rest of South America Calcined Petroleum Coke Industry Volume (K Tons) Forecast, by Application 2020 & 2033
- Table 67: Global Calcined Petroleum Coke Industry Revenue Billion Forecast, by Type 2020 & 2033
- Table 68: Global Calcined Petroleum Coke Industry Volume K Tons Forecast, by Type 2020 & 2033
- Table 69: Global Calcined Petroleum Coke Industry Revenue Billion Forecast, by Application 2020 & 2033
- Table 70: Global Calcined Petroleum Coke Industry Volume K Tons Forecast, by Application 2020 & 2033
- Table 71: Global Calcined Petroleum Coke Industry Revenue Billion Forecast, by Country 2020 & 2033
- Table 72: Global Calcined Petroleum Coke Industry Volume K Tons Forecast, by Country 2020 & 2033
- Table 73: Saudi Arabia Calcined Petroleum Coke Industry Revenue (Billion) Forecast, by Application 2020 & 2033
- Table 74: Saudi Arabia Calcined Petroleum Coke Industry Volume (K Tons) Forecast, by Application 2020 & 2033
- Table 75: South Africa Calcined Petroleum Coke Industry Revenue (Billion) Forecast, by Application 2020 & 2033
- Table 76: South Africa Calcined Petroleum Coke Industry Volume (K Tons) Forecast, by Application 2020 & 2033
- Table 77: Rest of Middle East and Africa Calcined Petroleum Coke Industry Revenue (Billion) Forecast, by Application 2020 & 2033
- Table 78: Rest of Middle East and Africa Calcined Petroleum Coke Industry Volume (K Tons) Forecast, by Application 2020 & 2033
Frequently Asked Questions
1. What is the projected Compound Annual Growth Rate (CAGR) of the Calcined Petroleum Coke Industry?
The projected CAGR is approximately 5.45%.
2. Which companies are prominent players in the Calcined Petroleum Coke Industry?
Key companies in the market include Oxbow Corporation, Petrocoque, Zhenjiang Coking And Gas Group Co Ltd, CNOOC Limited, Rain Carbon Inc, Aluminium Bahrain B S C (Alba), Rio Tinto, Numaligarh Refinery Limited, Phillips 66 Company, Maniayargroup, Saudi Calcined Petroleum Coke Company (SCPC), BP PLC, ELSID SA.
3. What are the main segments of the Calcined Petroleum Coke Industry?
The market segments include Type, Application.
4. Can you provide details about the market size?
The market size is estimated to be USD 1.15 Billion as of 2022.
5. What are some drivers contributing to market growth?
Increasing Demand from Aluminum Applications; Other Drivers.
6. What are the notable trends driving market growth?
Aluminium Segment to Drive the Market Growth.
7. Are there any restraints impacting market growth?
Fluctuating Prices for Raw Materials; Other Restraints.
8. Can you provide examples of recent developments in the market?
January 2023: Phillips 66 and DCP Midstream, LP announced a definitive agreement under which Phillips 66 will acquire all publicly traded standard units representing limited partner interests in DCP Midstream for cash consideration of USD 41.75 per standard unit, increasing its economic interest in DCP Midstream to 86.8%. It will strengthen the corporation and, in specific ways, boost the market productivity of petroleum coke.
9. What pricing options are available for accessing the report?
Pricing options include single-user, multi-user, and enterprise licenses priced at USD 4750, USD 5250, and USD 8750 respectively.
10. Is the market size provided in terms of value or volume?
The market size is provided in terms of value, measured in Billion and volume, measured in K Tons.
11. Are there any specific market keywords associated with the report?
Yes, the market keyword associated with the report is "Calcined Petroleum Coke Industry," which aids in identifying and referencing the specific market segment covered.
12. How do I determine which pricing option suits my needs best?
The pricing options vary based on user requirements and access needs. Individual users may opt for single-user licenses, while businesses requiring broader access may choose multi-user or enterprise licenses for cost-effective access to the report.
13. Are there any additional resources or data provided in the Calcined Petroleum Coke Industry report?
While the report offers comprehensive insights, it's advisable to review the specific contents or supplementary materials provided to ascertain if additional resources or data are available.
14. How can I stay updated on further developments or reports in the Calcined Petroleum Coke Industry?
To stay informed about further developments, trends, and reports in the Calcined Petroleum Coke Industry, consider subscribing to industry newsletters, following relevant companies and organizations, or regularly checking reputable industry news sources and publications.
Methodology
Step 1 - Identification of Relevant Samples Size from Population Database


Step 2 - Approaches for Defining Global Market Size (Value, Volume* & Price*)

Note*: In applicable scenarios
Step 3 - Data Sources
Primary Research
- Web Analytics
- Survey Reports
- Research Institute
- Latest Research Reports
- Opinion Leaders
Secondary Research
- Annual Reports
- White Paper
- Latest Press Release
- Industry Association
- Paid Database
- Investor Presentations

Step 4 - Data Triangulation
Involves using different sources of information in order to increase the validity of a study
These sources are likely to be stakeholders in a program - participants, other researchers, program staff, other community members, and so on.
Then we put all data in single framework & apply various statistical tools to find out the dynamic on the market.
During the analysis stage, feedback from the stakeholder groups would be compared to determine areas of agreement as well as areas of divergence