
Key Insights
The global canal cruise market is experiencing robust expansion, projected to reach a substantial market size of approximately $15.5 billion by 2025, with an impressive Compound Annual Growth Rate (CAGR) of around 7.2% anticipated throughout the forecast period of 2025-2033. This growth is largely propelled by a confluence of factors, including the increasing desire among travelers for immersive and authentic cultural experiences, the rising popularity of niche tourism segments, and a growing awareness of the environmental sustainability often associated with canal-based travel. Key drivers include the demand for personalized and intimate travel options, moving away from mass tourism, and the allure of exploring lesser-known destinations accessible by waterways. The market is segmented by application, with 'Personal Visitor' segments leading the charge, reflecting individual and small group preferences for unique journeys. The 'Group Tours' segment also shows significant potential as organized travel providers increasingly incorporate canal cruises into their offerings. Within the type segment, 'Kids Cruise' and 'Small Open Boat' experiences are gaining traction, catering to families and those seeking a more adventurous and up-close encounter with the environment. The larger 'City Canal Cruise' segment continues to be a staple, offering convenient and scenic city exploration.
The competitive landscape is characterized by the presence of major cruise line operators and specialized canal cruise companies, all vying for market share through innovative offerings and strategic partnerships. Companies like Carnival Corporation, Disney, and Royal Caribbean Cruises Ltd are leveraging their extensive brand recognition and operational expertise to enter or expand their presence in this lucrative market. Simultaneously, niche players such as Hurtigruten, Inc., and those focused on specific regions are carving out their unique selling propositions. Emerging trends in the market include the integration of smart technologies for enhanced passenger experience, the development of eco-friendly vessels and practices, and the expansion of routes into previously underserved regions, particularly within Asia Pacific and South America. However, the market faces certain restraints, including the seasonality of operations in certain climates, the potential for overcrowding in popular canal destinations, and the significant infrastructure investment required for developing and maintaining canal routes and docking facilities. Despite these challenges, the overall outlook for the canal cruise market remains exceptionally positive, driven by evolving consumer preferences and a continuous push for sustainable and unique travel experiences.
Here is the SEO-optimized, detailed report description for Canal Cruise:
Canal Cruise Market Concentration & Innovation
The canal cruise market exhibits a dynamic interplay between established industry giants and emerging niche players, with Carnival Corporation, Royal Caribbean Cruises Ltd, and Norwegian Cruise Line Holdings collectively holding a significant market share estimated to be in the hundreds of millions of dollars. This concentration is driven by substantial capital investments in fleet expansion and destination development. Innovation is a key differentiator, with companies investing millions in sustainable vessel technologies, enhanced onboard guest experiences, and integrated digital platforms. Regulatory frameworks, particularly concerning environmental impact and passenger safety, are becoming increasingly stringent, influencing operational costs and strategic planning. Product substitutes, such as river cruises and land-based luxury tours, exert competitive pressure, necessitating continuous product refinement. End-user trends lean towards personalized itineraries, eco-conscious travel, and immersive cultural experiences. Mergers and acquisitions (M&A) activity, while not at an all-time high, remains a strategic tool for consolidation and market expansion, with deal values potentially reaching hundreds of millions of dollars, allowing larger entities to absorb innovative smaller operators or expand their geographical reach.
Canal Cruise Industry Trends & Insights
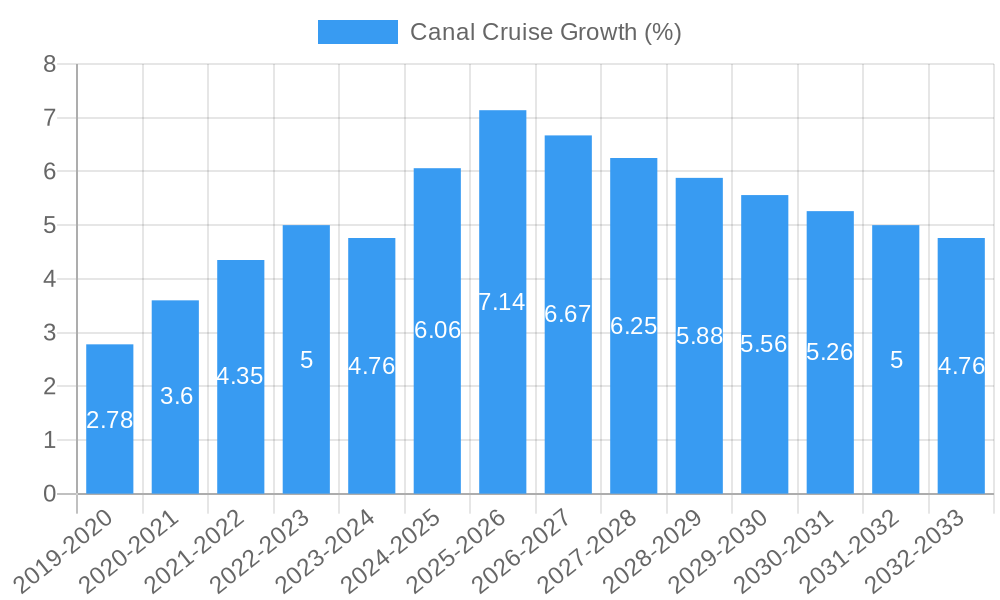
The global canal cruise market is poised for substantial growth, projected to expand at a Compound Annual Growth Rate (CAGR) of approximately 5-7% over the forecast period of 2025–2033, with a market size estimated to exceed several million dollars. This growth is propelled by several key drivers. Firstly, a rising disposable income and an increasing penchant for experiential travel among global consumers are fueling demand for unique vacation options. Secondly, technological advancements are revolutionizing the industry, from the development of eco-friendly propulsion systems and smart vessel management to immersive virtual reality pre-cruise experiences and seamless digital booking platforms. Consumer preferences are increasingly shifting towards personalized itineraries, smaller ship experiences offering greater intimacy and access to unique waterways, and a strong emphasis on sustainability and environmental responsibility. The competitive landscape is characterized by both intense rivalry among major players like Carnival Corporation, Royal Caribbean Cruises Ltd, and NCL Corporation, and the emergence of specialized operators focusing on niche segments such as luxury canal cruises or eco-tours. Market penetration is expected to deepen as awareness of canal cruising as a distinct travel segment grows, particularly in regions with extensive navigable canal networks. The industry is also witnessing a trend towards multi-generational travel and the development of tailored experiences for families, including dedicated kids’ cruise programs. The ongoing investment in infrastructure development, including port facilities and access to historically significant canal routes, further underpins the positive market trajectory.
Dominant Markets & Segments in Canal Cruise
The canal cruise market's dominance is currently held by City Canal Cruises, driven by their accessibility and appeal to a broad demographic. This segment benefits from substantial urban infrastructure and the inherent attractiveness of exploring iconic cityscapes from a unique vantage point. Economic policies supporting tourism and urban regeneration initiatives in major metropolitan areas worldwide have significantly boosted the popularity and accessibility of these cruises. The Personal Visitor application segment also commands a significant share, reflecting an increasing demand for individualistic and curated travel experiences. Travelers are seeking flexibility and the ability to tailor their journeys, making canal cruises an ideal choice for those who prefer independent exploration.
- Key Drivers for City Canal Cruise Dominance:
- Urban Tourism Infrastructure: Extensive network of canals in historically significant cities with high tourist footfall.
- Accessibility: Easy boarding and disembarkation points within city centers, reducing pre/post-cruise travel complexities.
- Short Duration & Affordability: Generally shorter and more budget-friendly than longer ocean or river cruises, appealing to a wider audience.
- Visual Appeal: Iconic landmarks and unique city perspectives offered from the water.
The Group Tours application, while substantial, often leverages the existing infrastructure of City Canal Cruises or is integrated into larger tour packages. The growth in this segment is closely tied to the overall tourism sector and package deal offerings.
- Key Drivers for Group Tour Growth:
- Package Deals: Integration with hotel stays, guided tours, and other tourist activities.
- Organized Experiences: Appeal to travel agencies and tour operators seeking curated, hassle-free itineraries for their clients.
- Social Aspect: Opportunities for shared experiences among friends, families, or corporate groups.
The Kids Cruise type, though a niche segment, shows promising growth potential. This is driven by an increasing demand from families seeking engaging and educational vacation experiences for children, with operators developing specialized onboard activities and themed itineraries.
- Key Drivers for Kids Cruise Growth:
- Family-Centric Offerings: Dedicated entertainment, educational programs, and kid-friendly amenities.
- Safety and Supervision: Assurance for parents regarding the well-being and engagement of their children.
- Themed Experiences: Popular with children, focusing on adventure, fantasy, or educational themes.
The Small Open Boat type, while perhaps less about mass tourism and more about intimate exploration, contributes to the overall market by catering to a desire for authentic and personalized experiences, often in more remote or scenic canal systems.
- Key Drivers for Small Open Boat Popularity:
- Intimate Experience: Personalized attention and access to smaller, less-trafficked waterways.
- Authenticity: Closer connection to the local environment and culture.
- Flexibility: Ability to adapt itineraries to specific interests and smaller group sizes.
Canal Cruise Product Developments
Product developments in the canal cruise sector are heavily influenced by a drive for enhanced guest experiences and sustainability. Innovations include the introduction of smaller, more agile vessels capable of navigating intricate canal systems, offering unparalleled access to remote locations and historic waterways. Technological integration is paramount, with advancements in smart navigation, real-time environmental monitoring, and personalized guest service platforms. Companies like Hurtigruten, Inc. are pioneering expeditions with a focus on eco-tourism and wildlife observation, setting new benchmarks for sustainable cruising. Competitive advantages are being carved out through unique itineraries, themed voyages (e.g., culinary or historical tours), and the integration of local culture and artisanal experiences directly into the cruise offering, ensuring a memorable and differentiated market fit.
Report Scope & Segmentation Analysis
This report provides a comprehensive analysis of the global canal cruise market, segmented across key applications and types. The market size is estimated to be in the millions of dollars, with projections indicating steady growth.
Personal Visitor segment is a significant contributor, driven by individual travelers seeking unique, flexible, and immersive experiences. Growth projections for this segment are robust, fueled by the increasing demand for personalized travel.
Group Tours represent another substantial segment, catering to organized travel parties, corporate events, and specialized interest groups. The competitive dynamics here involve offering attractive package deals and efficient group management.
Kids Cruise is a rapidly growing niche, focusing on family-friendly voyages with dedicated entertainment and educational programs. This segment's market size is expanding as operators recognize the demand for engaging family vacations.
Small Open Boat cruises offer intimate and exclusive experiences, ideal for exploring smaller waterways and natural reserves. While smaller in market size, this segment offers high-value opportunities and caters to a discerning clientele seeking authenticity.
City Canal Cruise dominates the market due to its accessibility and broad appeal, offering iconic sightseeing from a unique perspective. This segment's growth is tied to urban tourism trends and infrastructure development.
Key Drivers of Canal Cruise Growth
The canal cruise sector is propelled by a confluence of powerful growth drivers. Technologically, advancements in eco-friendly propulsion, waste management systems, and digital guest engagement are enhancing operational efficiency and environmental credentials. Economically, rising disposable incomes in emerging markets and a global post-pandemic appetite for experiential travel are significantly boosting demand. Regulatory frameworks, while sometimes posing challenges, are also indirectly driving innovation towards more sustainable and safety-focused operations, which in turn appeals to a more conscious traveler. The increasing popularity of niche tourism, particularly historical and cultural immersion, perfectly aligns with the unique offering of canal cruises.
Challenges in the Canal Cruise Sector
Despite its growth potential, the canal cruise sector faces several significant challenges. Regulatory hurdles, particularly concerning environmental impact assessments and emissions standards in sensitive waterways, can lead to increased operational costs and limit itinerary options, potentially costing millions in compliance. Supply chain issues, affecting the availability of specialized vessel components and experienced crew, can disrupt operations and impact service delivery. Competitive pressures from other forms of tourism, including river cruises and land-based tours, necessitate continuous innovation and differentiation. Furthermore, seasonal weather dependency and potential for waterway closures due to maintenance or environmental events pose inherent operational risks, impacting revenue streams by millions.
Emerging Opportunities in Canal Cruise
The canal cruise market is ripe with emerging opportunities. A significant trend is the expansion into previously underserved geographical regions with developing canal infrastructure, opening up new markets with the potential for millions in new revenue. Technological innovations in autonomous navigation and smart onboard systems present opportunities to enhance efficiency and personalize guest experiences further, creating unique selling propositions. The growing consumer demand for sustainable and eco-friendly travel is a major opportunity, with operators focusing on low-emission vessels and responsible tourism practices poised to capture a larger market share. Furthermore, the development of themed cruises, such as wellness retreats, culinary tours, and historical reenactments, offers avenues for niche market penetration and premium pricing strategies, driving growth in the millions.
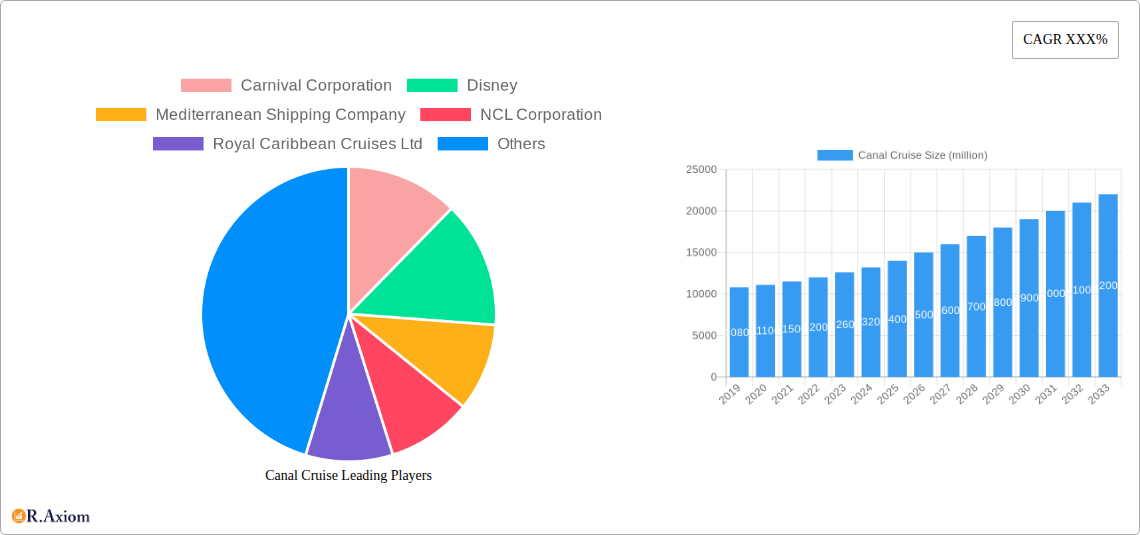
Leading Players in the Canal Cruise Market
- Carnival Corporation
- Disney
- Mediterranean Shipping Company
- NCL Corporation
- Royal Caribbean Cruises Ltd
- Norwegian Cruise Line Holdings
- Genting Hong Kong
- Hurtigruten, Inc.
- Louis PLC
Key Developments in Canal Cruise Industry
- 2023 February: Launch of new eco-friendly propulsion systems by major cruise lines, aiming to reduce carbon footprint by millions of tons annually.
- 2023 August: Increased investment in digital guest experience platforms by Carnival Corporation and Royal Caribbean Cruises Ltd, enhancing booking and onboard services.
- 2024 January: Introduction of specialized "Kids Cruise" itineraries by NCL Corporation, targeting family travelers with tailored entertainment programs.
- 2024 June: Hurtigruten, Inc. announces expansion of its small open boat expedition cruises in Arctic regions, focusing on sustainable tourism.
- 2024 December: Mediterranean Shipping Company explores potential M&A activities within the luxury canal cruise segment, signaling strategic growth ambitions.
Strategic Outlook for Canal Cruise Market
The strategic outlook for the canal cruise market is overwhelmingly positive, driven by sustained consumer demand for unique and experiential travel. Future growth will be catalyzed by continued investment in sustainable technologies, enhancing both environmental performance and operational efficiency, which is crucial for maintaining market access and attracting eco-conscious travelers. The expansion of product offerings to cater to diverse demographics, including specialized cruises for families and niche interest groups, will be key to broadening market appeal and capturing new revenue streams in the millions. Strategic partnerships and collaborations, alongside potential M&A activities, will likely shape the competitive landscape, allowing leading players to consolidate market share and leverage economies of scale. The integration of advanced digital solutions for booking, itinerary management, and onboard services will further differentiate brands and improve customer satisfaction, ensuring long-term market viability and profitability in the billions.
Canal Cruise Segmentation
-
1. Application
- 1.1. Personal Visitor
- 1.2. Group Tours
-
2. Type
- 2.1. Kids Cruise
- 2.2. Small Open Boat
- 2.3. City Canal Cruise
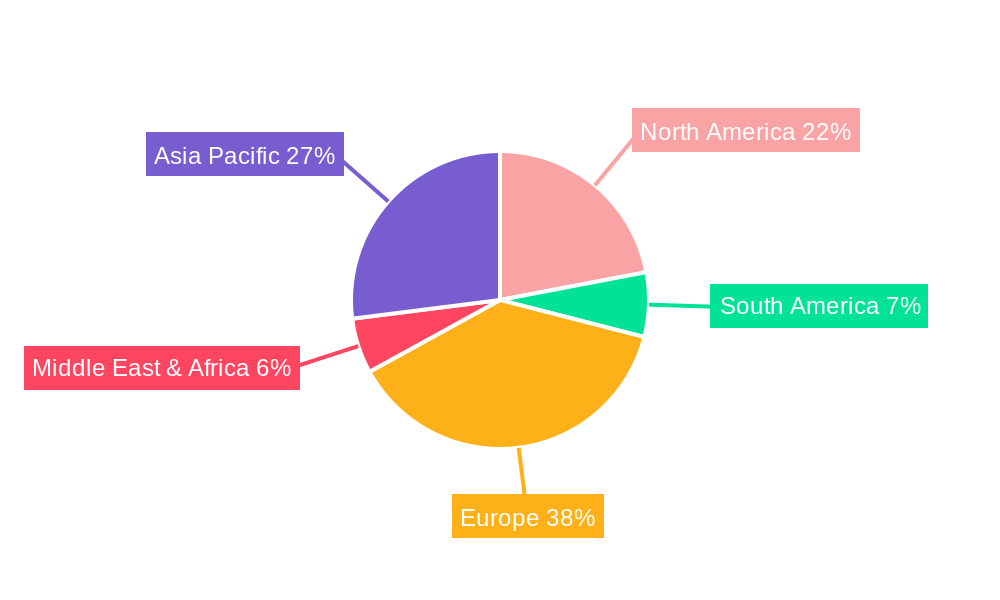
Canal Cruise Segmentation By Geography
-
1. North America
- 1.1. United States
- 1.2. Canada
- 1.3. Mexico
-
2. South America
- 2.1. Brazil
- 2.2. Argentina
- 2.3. Rest of South America
-
3. Europe
- 3.1. United Kingdom
- 3.2. Germany
- 3.3. France
- 3.4. Italy
- 3.5. Spain
- 3.6. Russia
- 3.7. Benelux
- 3.8. Nordics
- 3.9. Rest of Europe
-
4. Middle East & Africa
- 4.1. Turkey
- 4.2. Israel
- 4.3. GCC
- 4.4. North Africa
- 4.5. South Africa
- 4.6. Rest of Middle East & Africa
-
5. Asia Pacific
- 5.1. China
- 5.2. India
- 5.3. Japan
- 5.4. South Korea
- 5.5. ASEAN
- 5.6. Oceania
- 5.7. Rest of Asia Pacific
Canal Cruise REPORT HIGHLIGHTS
| Aspects | Details |
|---|---|
| Study Period | 2019-2033 |
| Base Year | 2024 |
| Estimated Year | 2025 |
| Forecast Period | 2025-2033 |
| Historical Period | 2019-2024 |
| Growth Rate | CAGR of XXX% from 2019-2033 |
| Segmentation |
|
Table of Contents
- 1. Introduction
- 1.1. Research Scope
- 1.2. Market Segmentation
- 1.3. Research Methodology
- 1.4. Definitions and Assumptions
- 2. Executive Summary
- 2.1. Introduction
- 3. Market Dynamics
- 3.1. Introduction
- 3.2. Market Drivers
- 3.3. Market Restrains
- 3.4. Market Trends
- 4. Market Factor Analysis
- 4.1. Porters Five Forces
- 4.2. Supply/Value Chain
- 4.3. PESTEL analysis
- 4.4. Market Entropy
- 4.5. Patent/Trademark Analysis
- 5. Global Canal Cruise Analysis, Insights and Forecast, 2019-2031
- 5.1. Market Analysis, Insights and Forecast - by Application
- 5.1.1. Personal Visitor
- 5.1.2. Group Tours
- 5.2. Market Analysis, Insights and Forecast - by Type
- 5.2.1. Kids Cruise
- 5.2.2. Small Open Boat
- 5.2.3. City Canal Cruise
- 5.3. Market Analysis, Insights and Forecast - by Region
- 5.3.1. North America
- 5.3.2. South America
- 5.3.3. Europe
- 5.3.4. Middle East & Africa
- 5.3.5. Asia Pacific
- 5.1. Market Analysis, Insights and Forecast - by Application
- 6. North America Canal Cruise Analysis, Insights and Forecast, 2019-2031
- 6.1. Market Analysis, Insights and Forecast - by Application
- 6.1.1. Personal Visitor
- 6.1.2. Group Tours
- 6.2. Market Analysis, Insights and Forecast - by Type
- 6.2.1. Kids Cruise
- 6.2.2. Small Open Boat
- 6.2.3. City Canal Cruise
- 6.1. Market Analysis, Insights and Forecast - by Application
- 7. South America Canal Cruise Analysis, Insights and Forecast, 2019-2031
- 7.1. Market Analysis, Insights and Forecast - by Application
- 7.1.1. Personal Visitor
- 7.1.2. Group Tours
- 7.2. Market Analysis, Insights and Forecast - by Type
- 7.2.1. Kids Cruise
- 7.2.2. Small Open Boat
- 7.2.3. City Canal Cruise
- 7.1. Market Analysis, Insights and Forecast - by Application
- 8. Europe Canal Cruise Analysis, Insights and Forecast, 2019-2031
- 8.1. Market Analysis, Insights and Forecast - by Application
- 8.1.1. Personal Visitor
- 8.1.2. Group Tours
- 8.2. Market Analysis, Insights and Forecast - by Type
- 8.2.1. Kids Cruise
- 8.2.2. Small Open Boat
- 8.2.3. City Canal Cruise
- 8.1. Market Analysis, Insights and Forecast - by Application
- 9. Middle East & Africa Canal Cruise Analysis, Insights and Forecast, 2019-2031
- 9.1. Market Analysis, Insights and Forecast - by Application
- 9.1.1. Personal Visitor
- 9.1.2. Group Tours
- 9.2. Market Analysis, Insights and Forecast - by Type
- 9.2.1. Kids Cruise
- 9.2.2. Small Open Boat
- 9.2.3. City Canal Cruise
- 9.1. Market Analysis, Insights and Forecast - by Application
- 10. Asia Pacific Canal Cruise Analysis, Insights and Forecast, 2019-2031
- 10.1. Market Analysis, Insights and Forecast - by Application
- 10.1.1. Personal Visitor
- 10.1.2. Group Tours
- 10.2. Market Analysis, Insights and Forecast - by Type
- 10.2.1. Kids Cruise
- 10.2.2. Small Open Boat
- 10.2.3. City Canal Cruise
- 10.1. Market Analysis, Insights and Forecast - by Application
- 11. Competitive Analysis
- 11.1. Global Market Share Analysis 2024
- 11.2. Company Profiles
- 11.2.1 Carnival Corporation
- 11.2.1.1. Overview
- 11.2.1.2. Products
- 11.2.1.3. SWOT Analysis
- 11.2.1.4. Recent Developments
- 11.2.1.5. Financials (Based on Availability)
- 11.2.2 Disney
- 11.2.2.1. Overview
- 11.2.2.2. Products
- 11.2.2.3. SWOT Analysis
- 11.2.2.4. Recent Developments
- 11.2.2.5. Financials (Based on Availability)
- 11.2.3 Mediterranean Shipping Company
- 11.2.3.1. Overview
- 11.2.3.2. Products
- 11.2.3.3. SWOT Analysis
- 11.2.3.4. Recent Developments
- 11.2.3.5. Financials (Based on Availability)
- 11.2.4 NCL Corporation
- 11.2.4.1. Overview
- 11.2.4.2. Products
- 11.2.4.3. SWOT Analysis
- 11.2.4.4. Recent Developments
- 11.2.4.5. Financials (Based on Availability)
- 11.2.5 Royal Caribbean Cruises Ltd
- 11.2.5.1. Overview
- 11.2.5.2. Products
- 11.2.5.3. SWOT Analysis
- 11.2.5.4. Recent Developments
- 11.2.5.5. Financials (Based on Availability)
- 11.2.6 Norwegian Cruise Line Holdings
- 11.2.6.1. Overview
- 11.2.6.2. Products
- 11.2.6.3. SWOT Analysis
- 11.2.6.4. Recent Developments
- 11.2.6.5. Financials (Based on Availability)
- 11.2.7 Genting Hong Kong
- 11.2.7.1. Overview
- 11.2.7.2. Products
- 11.2.7.3. SWOT Analysis
- 11.2.7.4. Recent Developments
- 11.2.7.5. Financials (Based on Availability)
- 11.2.8 Hurtigruten Inc.
- 11.2.8.1. Overview
- 11.2.8.2. Products
- 11.2.8.3. SWOT Analysis
- 11.2.8.4. Recent Developments
- 11.2.8.5. Financials (Based on Availability)
- 11.2.9 Louis PLC
- 11.2.9.1. Overview
- 11.2.9.2. Products
- 11.2.9.3. SWOT Analysis
- 11.2.9.4. Recent Developments
- 11.2.9.5. Financials (Based on Availability)
- 11.2.1 Carnival Corporation
List of Figures
- Figure 1: Global Canal Cruise Revenue Breakdown (million, %) by Region 2024 & 2032
- Figure 2: North America Canal Cruise Revenue (million), by Application 2024 & 2032
- Figure 3: North America Canal Cruise Revenue Share (%), by Application 2024 & 2032
- Figure 4: North America Canal Cruise Revenue (million), by Type 2024 & 2032
- Figure 5: North America Canal Cruise Revenue Share (%), by Type 2024 & 2032
- Figure 6: North America Canal Cruise Revenue (million), by Country 2024 & 2032
- Figure 7: North America Canal Cruise Revenue Share (%), by Country 2024 & 2032
- Figure 8: South America Canal Cruise Revenue (million), by Application 2024 & 2032
- Figure 9: South America Canal Cruise Revenue Share (%), by Application 2024 & 2032
- Figure 10: South America Canal Cruise Revenue (million), by Type 2024 & 2032
- Figure 11: South America Canal Cruise Revenue Share (%), by Type 2024 & 2032
- Figure 12: South America Canal Cruise Revenue (million), by Country 2024 & 2032
- Figure 13: South America Canal Cruise Revenue Share (%), by Country 2024 & 2032
- Figure 14: Europe Canal Cruise Revenue (million), by Application 2024 & 2032
- Figure 15: Europe Canal Cruise Revenue Share (%), by Application 2024 & 2032
- Figure 16: Europe Canal Cruise Revenue (million), by Type 2024 & 2032
- Figure 17: Europe Canal Cruise Revenue Share (%), by Type 2024 & 2032
- Figure 18: Europe Canal Cruise Revenue (million), by Country 2024 & 2032
- Figure 19: Europe Canal Cruise Revenue Share (%), by Country 2024 & 2032
- Figure 20: Middle East & Africa Canal Cruise Revenue (million), by Application 2024 & 2032
- Figure 21: Middle East & Africa Canal Cruise Revenue Share (%), by Application 2024 & 2032
- Figure 22: Middle East & Africa Canal Cruise Revenue (million), by Type 2024 & 2032
- Figure 23: Middle East & Africa Canal Cruise Revenue Share (%), by Type 2024 & 2032
- Figure 24: Middle East & Africa Canal Cruise Revenue (million), by Country 2024 & 2032
- Figure 25: Middle East & Africa Canal Cruise Revenue Share (%), by Country 2024 & 2032
- Figure 26: Asia Pacific Canal Cruise Revenue (million), by Application 2024 & 2032
- Figure 27: Asia Pacific Canal Cruise Revenue Share (%), by Application 2024 & 2032
- Figure 28: Asia Pacific Canal Cruise Revenue (million), by Type 2024 & 2032
- Figure 29: Asia Pacific Canal Cruise Revenue Share (%), by Type 2024 & 2032
- Figure 30: Asia Pacific Canal Cruise Revenue (million), by Country 2024 & 2032
- Figure 31: Asia Pacific Canal Cruise Revenue Share (%), by Country 2024 & 2032
List of Tables
- Table 1: Global Canal Cruise Revenue million Forecast, by Region 2019 & 2032
- Table 2: Global Canal Cruise Revenue million Forecast, by Application 2019 & 2032
- Table 3: Global Canal Cruise Revenue million Forecast, by Type 2019 & 2032
- Table 4: Global Canal Cruise Revenue million Forecast, by Region 2019 & 2032
- Table 5: Global Canal Cruise Revenue million Forecast, by Application 2019 & 2032
- Table 6: Global Canal Cruise Revenue million Forecast, by Type 2019 & 2032
- Table 7: Global Canal Cruise Revenue million Forecast, by Country 2019 & 2032
- Table 8: United States Canal Cruise Revenue (million) Forecast, by Application 2019 & 2032
- Table 9: Canada Canal Cruise Revenue (million) Forecast, by Application 2019 & 2032
- Table 10: Mexico Canal Cruise Revenue (million) Forecast, by Application 2019 & 2032
- Table 11: Global Canal Cruise Revenue million Forecast, by Application 2019 & 2032
- Table 12: Global Canal Cruise Revenue million Forecast, by Type 2019 & 2032
- Table 13: Global Canal Cruise Revenue million Forecast, by Country 2019 & 2032
- Table 14: Brazil Canal Cruise Revenue (million) Forecast, by Application 2019 & 2032
- Table 15: Argentina Canal Cruise Revenue (million) Forecast, by Application 2019 & 2032
- Table 16: Rest of South America Canal Cruise Revenue (million) Forecast, by Application 2019 & 2032
- Table 17: Global Canal Cruise Revenue million Forecast, by Application 2019 & 2032
- Table 18: Global Canal Cruise Revenue million Forecast, by Type 2019 & 2032
- Table 19: Global Canal Cruise Revenue million Forecast, by Country 2019 & 2032
- Table 20: United Kingdom Canal Cruise Revenue (million) Forecast, by Application 2019 & 2032
- Table 21: Germany Canal Cruise Revenue (million) Forecast, by Application 2019 & 2032
- Table 22: France Canal Cruise Revenue (million) Forecast, by Application 2019 & 2032
- Table 23: Italy Canal Cruise Revenue (million) Forecast, by Application 2019 & 2032
- Table 24: Spain Canal Cruise Revenue (million) Forecast, by Application 2019 & 2032
- Table 25: Russia Canal Cruise Revenue (million) Forecast, by Application 2019 & 2032
- Table 26: Benelux Canal Cruise Revenue (million) Forecast, by Application 2019 & 2032
- Table 27: Nordics Canal Cruise Revenue (million) Forecast, by Application 2019 & 2032
- Table 28: Rest of Europe Canal Cruise Revenue (million) Forecast, by Application 2019 & 2032
- Table 29: Global Canal Cruise Revenue million Forecast, by Application 2019 & 2032
- Table 30: Global Canal Cruise Revenue million Forecast, by Type 2019 & 2032
- Table 31: Global Canal Cruise Revenue million Forecast, by Country 2019 & 2032
- Table 32: Turkey Canal Cruise Revenue (million) Forecast, by Application 2019 & 2032
- Table 33: Israel Canal Cruise Revenue (million) Forecast, by Application 2019 & 2032
- Table 34: GCC Canal Cruise Revenue (million) Forecast, by Application 2019 & 2032
- Table 35: North Africa Canal Cruise Revenue (million) Forecast, by Application 2019 & 2032
- Table 36: South Africa Canal Cruise Revenue (million) Forecast, by Application 2019 & 2032
- Table 37: Rest of Middle East & Africa Canal Cruise Revenue (million) Forecast, by Application 2019 & 2032
- Table 38: Global Canal Cruise Revenue million Forecast, by Application 2019 & 2032
- Table 39: Global Canal Cruise Revenue million Forecast, by Type 2019 & 2032
- Table 40: Global Canal Cruise Revenue million Forecast, by Country 2019 & 2032
- Table 41: China Canal Cruise Revenue (million) Forecast, by Application 2019 & 2032
- Table 42: India Canal Cruise Revenue (million) Forecast, by Application 2019 & 2032
- Table 43: Japan Canal Cruise Revenue (million) Forecast, by Application 2019 & 2032
- Table 44: South Korea Canal Cruise Revenue (million) Forecast, by Application 2019 & 2032
- Table 45: ASEAN Canal Cruise Revenue (million) Forecast, by Application 2019 & 2032
- Table 46: Oceania Canal Cruise Revenue (million) Forecast, by Application 2019 & 2032
- Table 47: Rest of Asia Pacific Canal Cruise Revenue (million) Forecast, by Application 2019 & 2032
Frequently Asked Questions
1. What is the projected Compound Annual Growth Rate (CAGR) of the Canal Cruise?
The projected CAGR is approximately XXX%.
2. Which companies are prominent players in the Canal Cruise?
Key companies in the market include Carnival Corporation, Disney, Mediterranean Shipping Company, NCL Corporation, Royal Caribbean Cruises Ltd, Norwegian Cruise Line Holdings, Genting Hong Kong, Hurtigruten, Inc., Louis PLC.
3. What are the main segments of the Canal Cruise?
The market segments include Application, Type.
4. Can you provide details about the market size?
The market size is estimated to be USD XXX million as of 2022.
5. What are some drivers contributing to market growth?
N/A
6. What are the notable trends driving market growth?
N/A
7. Are there any restraints impacting market growth?
N/A
8. Can you provide examples of recent developments in the market?
N/A
9. What pricing options are available for accessing the report?
Pricing options include single-user, multi-user, and enterprise licenses priced at USD 3950.00, USD 5925.00, and USD 7900.00 respectively.
10. Is the market size provided in terms of value or volume?
The market size is provided in terms of value, measured in million.
11. Are there any specific market keywords associated with the report?
Yes, the market keyword associated with the report is "Canal Cruise," which aids in identifying and referencing the specific market segment covered.
12. How do I determine which pricing option suits my needs best?
The pricing options vary based on user requirements and access needs. Individual users may opt for single-user licenses, while businesses requiring broader access may choose multi-user or enterprise licenses for cost-effective access to the report.
13. Are there any additional resources or data provided in the Canal Cruise report?
While the report offers comprehensive insights, it's advisable to review the specific contents or supplementary materials provided to ascertain if additional resources or data are available.
14. How can I stay updated on further developments or reports in the Canal Cruise?
To stay informed about further developments, trends, and reports in the Canal Cruise, consider subscribing to industry newsletters, following relevant companies and organizations, or regularly checking reputable industry news sources and publications.
Methodology
Step 1 - Identification of Relevant Samples Size from Population Database


Step 2 - Approaches for Defining Global Market Size (Value, Volume* & Price*)

Note*: In applicable scenarios
Step 3 - Data Sources
Primary Research
- Web Analytics
- Survey Reports
- Research Institute
- Latest Research Reports
- Opinion Leaders
Secondary Research
- Annual Reports
- White Paper
- Latest Press Release
- Industry Association
- Paid Database
- Investor Presentations

Step 4 - Data Triangulation
Involves using different sources of information in order to increase the validity of a study
These sources are likely to be stakeholders in a program - participants, other researchers, program staff, other community members, and so on.
Then we put all data in single framework & apply various statistical tools to find out the dynamic on the market.
During the analysis stage, feedback from the stakeholder groups would be compared to determine areas of agreement as well as areas of divergence


