

Key Insights
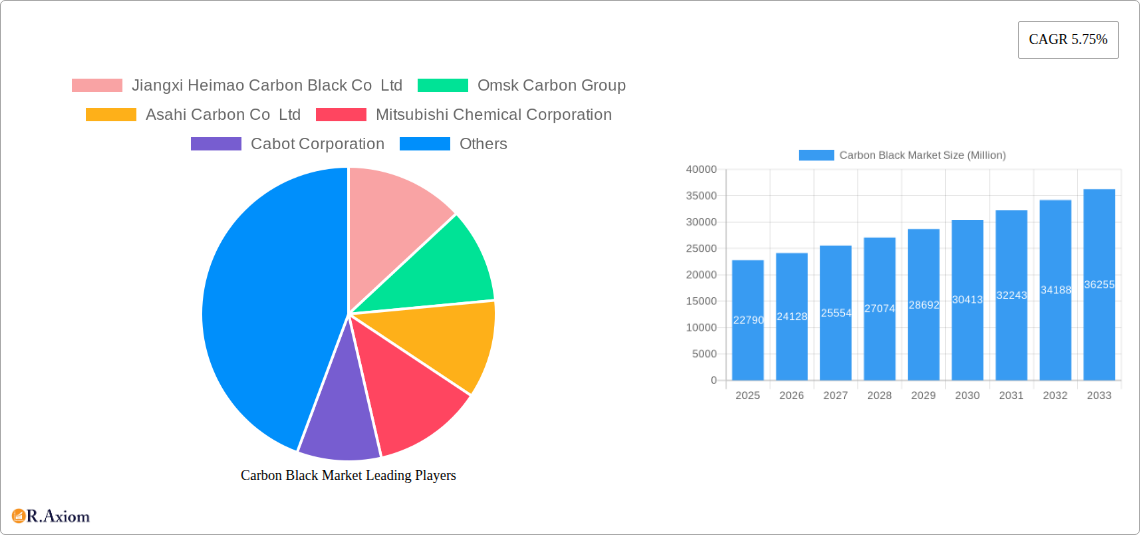
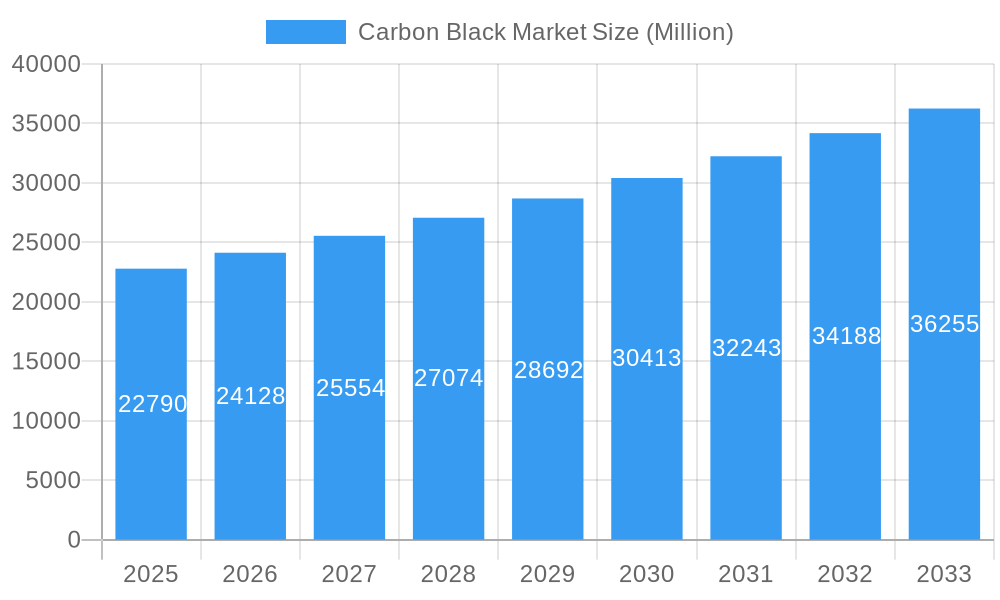
The global carbon black market, valued at $22.79 billion in 2025, is projected to experience robust growth, driven by a Compound Annual Growth Rate (CAGR) of 5.75% from 2025 to 2033. This expansion is fueled by several key factors. The burgeoning tire and industrial rubber products sector, a major consumer of carbon black, is a significant contributor to market growth. Increased demand for automobiles globally, coupled with the rising production of tires, directly translates into higher carbon black consumption. Furthermore, the growing plastics industry, particularly in emerging economies, fuels demand for carbon black as a pigment and reinforcing agent. The expanding applications of carbon black in printing inks, coatings, and textile fibers also contribute to market expansion. Technological advancements leading to the development of more sustainable and efficient carbon black production methods are also influencing market dynamics. Competition among key players such as Cabot Corporation, Birla Carbon, and Asahi Carbon, is driving innovation and enhancing product quality. Regional variations in growth are expected, with Asia-Pacific, particularly China and India, anticipated to remain dominant market forces due to their robust industrial sectors and increasing infrastructure development.
Carbon Black Market Market Size (In Billion)
However, certain restraints may impact market growth. Fluctuations in crude oil prices, a primary raw material for carbon black production, can affect production costs and profitability. Stringent environmental regulations regarding emissions from carbon black manufacturing facilities could also pose challenges for market players. The need for sustainable and environmentally friendly alternatives to carbon black, while currently limited in scope, represents a potential long-term threat. Nonetheless, the overall market outlook remains positive, with consistent growth anticipated throughout the forecast period. The continuous diversification into new applications and ongoing innovation in manufacturing processes will likely offset these challenges, ensuring the sustained expansion of the carbon black market.
Carbon Black Market Company Market Share
Carbon Black Market: A Comprehensive Report (2019-2033)
This in-depth report provides a comprehensive analysis of the global carbon black market, offering crucial insights for industry stakeholders, investors, and strategic decision-makers. The study covers the period from 2019 to 2033, with a focus on the forecast period of 2025-2033 and a base year of 2025. The report meticulously examines market dynamics, competitive landscapes, technological advancements, and emerging opportunities within this vital industrial sector. The total market size is estimated at xx Million in 2025, with a projected CAGR of xx% during the forecast period.
Carbon Black Market Market Concentration & Innovation
The global carbon black market exhibits a moderately concentrated structure, with a few major players holding significant market share. Key players such as Cabot Corporation, Birla Carbon (Aditya Birla Group), Orion Engineered Carbons SA, and Mitsubishi Chemical Corporation account for a substantial portion of the overall market volume. However, a number of regional and smaller players are also significant contributors, fostering a dynamic and competitive environment. Market concentration is influenced by factors such as economies of scale in production, technological advancements, and strategic mergers and acquisitions (M&A).
- Market Share: Cabot Corporation and Birla Carbon are estimated to collectively hold around xx% of the global market share in 2025.
- M&A Activity: The past five years have witnessed several significant M&A deals, valued at an estimated xx Million, driven by companies seeking to expand their geographic reach and product portfolios. These activities have further shaped the market concentration, leading to both consolidation and increased competition.
- Innovation Drivers: The industry's continuous drive towards innovation is fueled by stringent environmental regulations, the demand for enhanced performance characteristics (e.g., improved abrasion resistance, UV stability), and the development of new applications in emerging industries such as electric vehicles and 3D printing. This is evident in the ongoing research and development efforts focused on producing more sustainable and high-performance carbon black grades.
- Regulatory Frameworks: Environmental regulations related to emissions and waste disposal have a significant impact on the market. Companies are actively investing in cleaner production technologies and sustainable practices to comply with evolving regulatory landscapes.
- Product Substitutes: While carbon black has a strong market position, there are some emerging substitutes, including alternatives like silicon dioxide and graphene, which might impact market share in certain segments in the long term.
- End-User Trends: Growing demand from the tire and rubber industries, alongside the expanding plastics and coatings sectors, remains the primary driver of market growth.
Carbon Black Market Industry Trends & Insights
The carbon black market is projected to experience substantial growth driven by several key factors. The increasing demand for tires and rubber products, particularly in developing economies, is a major contributor. The rising adoption of carbon black in plastics for improved properties such as strength, UV resistance, and color is also boosting market growth. Furthermore, the expansion of the construction and infrastructure sectors worldwide further fuels the demand for carbon black in paints, coatings, and other construction materials.
Technological advancements in carbon black production, such as the development of specialized grades with enhanced performance characteristics, are also driving growth. The industry is witnessing a shift towards more sustainable and efficient production processes, including the implementation of renewable energy sources, as exemplified by PCBL Limited's recent initiatives. This trend aligns with increasing environmental concerns and stricter regulations.
Consumer preference for high-performance products, improved durability, and aesthetically pleasing materials is directly translating into increased demand for carbon black across various applications. Competitive dynamics are marked by both intense rivalry among established players and the emergence of new entrants, especially in regions with favorable economic conditions and governmental support.
Dominant Markets & Segments in Carbon Black Market
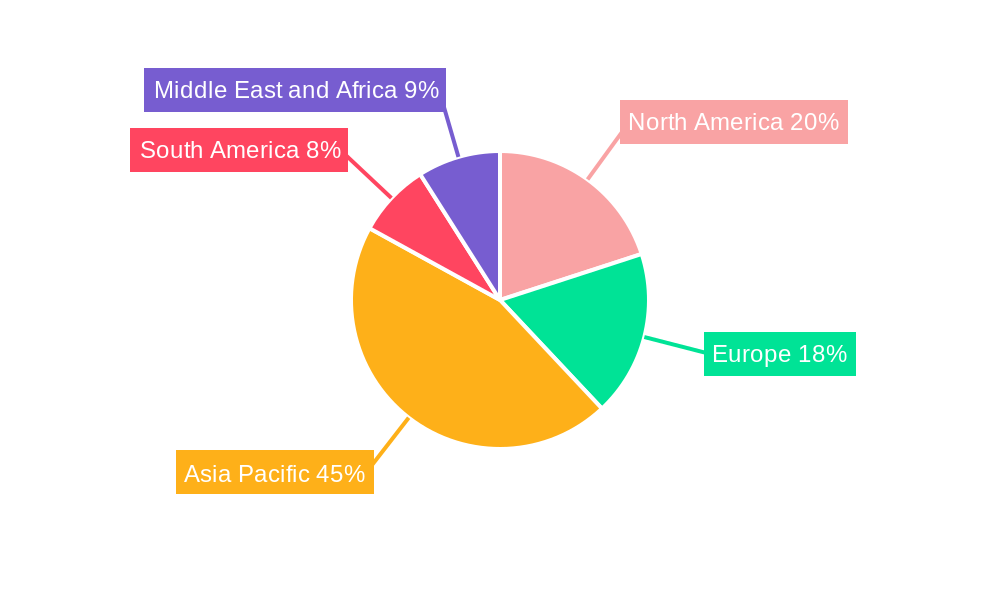
The Asia-Pacific region dominates the global carbon black market, driven by rapid industrialization, significant automotive production, and expanding infrastructure projects. China, India, and other Southeast Asian countries are key contributors to this regional dominance.
Process Type: Furnace black holds the largest market share among different production processes due to its cost-effectiveness and versatility. The segment is further anticipated to experience robust growth during the forecast period due to the continued demand from its primary applications.
Application: The Tires and Industrial Rubber Products segment is the most dominant application segment, owing to the indispensable role of carbon black in enhancing the properties of tires and other rubber-based products. The high penetration of carbon black in this sector coupled with continued growth in the automotive and tire industry ensures a significant portion of market demand.
Key Drivers for Asia-Pacific Dominance:
- Rapid economic growth and industrialization.
- Expansion of the automotive sector.
- Rising infrastructure development.
- Favorable government policies supporting industrial growth.
Carbon Black Market Product Developments
Recent product innovations are significantly advancing the carbon black landscape, with a strong emphasis on developing specialized grades that offer superior performance characteristics. Key advancements include breakthroughs in achieving enhanced dispersion, leading to more homogeneous mixing in polymer matrices. Furthermore, new formulations are delivering higher reinforcement properties, crucial for improving the mechanical strength and durability of end products, particularly in high-performance tires and robust industrial rubber goods. UV stability is also a major focus, with developers creating grades that offer extended protection against degradation from ultraviolet radiation, vital for applications in advanced plastics and protective specialty coatings that face prolonged environmental exposure. These innovations are directly addressing the evolving and increasingly sophisticated demands across diverse application segments. Concurrently, the industry is making substantial strides in sustainability. This involves the pioneering of cleaner production processes that minimize environmental impact and the integration of recycled materials into the manufacturing cycle, yielding high-quality carbon black from waste streams. This dual focus on performance enhancement and environmental responsibility reflects a strategic alignment with growing consumer preferences for eco-conscious products and stringent, forward-looking regulatory requirements.
Report Scope & Segmentation Analysis
This comprehensive report meticulously segments the global carbon black market by Process Type, categorizing it into Furnace Black, Gas Black, Lamp Black, and Thermal Black. The market is further analyzed through its diverse Application segments, including Tires and Industrial Rubber Products, Plastics, Toners and Printing Inks, Coatings, Textile Fiber, and a consolidated category for Other Applications. Each segment is subjected to in-depth analysis, providing critical insights into projected growth trajectories, precise market size estimations, and the intricate competitive dynamics at play. For instance, the Furnace Black segment is anticipated to retain its dominant market position, owing to its widespread applicability across numerous industries. Simultaneously, the Tires and Industrial Rubber Products application segment is poised for robust expansion, primarily propelled by the sustained growth and evolving demands of the global automotive industry.
Key Drivers of Carbon Black Market Growth
The carbon black market is experiencing robust growth, primarily fueled by the escalating demand originating from the automotive and tire manufacturing sectors, which are continually seeking high-performance materials. Concurrently, the burgeoning construction and infrastructure development activities worldwide are significantly boosting the consumption of carbon black in rubber products and coatings. The expanding applications of carbon black in the plastics industry, from automotive components to consumer goods, and its crucial role in advanced coatings for enhanced durability and aesthetics, also represent significant growth drivers. Technological advancements in carbon black production processes are instrumental, enabling the development of specialized, higher-performance grades tailored to specific application needs. Furthermore, supportive government policies aimed at promoting industrial development and fostering economic growth across various key regions are creating a conducive environment for market expansion.
Challenges in the Carbon Black Market Sector
The carbon black market faces challenges such as fluctuating raw material prices, stringent environmental regulations increasing production costs, and intense competition from alternative materials. Supply chain disruptions due to geopolitical events can also impact market stability. The need for continuous innovation to meet the demands for improved performance and sustainability also presents a significant challenge for market participants.
Emerging Opportunities in Carbon Black Market
The carbon black market is ripe with emerging opportunities, particularly in the development of highly specialized carbon black grades designed for cutting-edge applications. This includes the creation of advanced carbon black for use in electric vehicle batteries, where it enhances conductivity and performance, and for 3D printing filaments, contributing to stronger and more functional printed objects. The global emphasis on sustainability is paving the way for significant opportunities in bio-based carbon black, derived from renewable feedstocks, and the advancement of carbon capture technologies that can transform emissions into valuable carbon black products. Geographically, expanding into new and rapidly growing international markets, especially in emerging economies with burgeoning industrial sectors, presents substantial avenues for market penetration and sustained growth.
Leading Players in the Carbon Black Market Market
- Jiangxi Heimao Carbon Black Co Ltd
- Omsk Carbon Group
- Asahi Carbon Co Ltd
- Mitsubishi Chemical Corporation
- Cabot Corporation
- Epsilon Carbon Private Limited
- NNPC Limited
- Himadri Speciality Chemical Ltd
- ADNOC Group
- Longxing Chemical Stock Co Ltd
- PCBL Limited
- International CSRC Investment Holdings Co Ltd
- Imerys SA
- Tokai Carbon Co Ltd
- OCI Company Ltd
- BKT Carbon
- Orion Engineered Carbons SA
- Birla Carbon (Aditya Birla Group)
Key Developments in Carbon Black Market Industry
- June 2023: PCBL Limited announced two growth projects, including plant expansion in Chennai, Tamil Nadu, and Mundra, Gujarat, increasing its capacity to 790,000 MTPA and integrating 122 MW of renewable energy.
- February 2023: Balkrishna Industries Ltd (BKT) plans to boost carbon black production capacity by almost 20%, adding 198 kilotons per year to its Bhuj plant.
- June 2022: ADNOC Distribution signed a carbon black supply agreement with ADNOC to explore market opportunities.
Strategic Outlook for Carbon Black Market Market
The carbon black market is poised for sustained growth, driven by consistent demand from key applications, technological advancements, and expansion into new markets. The focus on sustainable production methods and the development of high-performance grades will shape future market dynamics. Companies that proactively adapt to evolving regulatory environments and consumer preferences are expected to achieve significant success in this dynamic sector.
Carbon Black Market Segmentation
-
1. Process Type
- 1.1. Furnace Black
- 1.2. Gas Black
- 1.3. Lamp Black
- 1.4. Thermal Black
-
2. Application
- 2.1. Tires and Industrial Rubber Products
- 2.2. Plastic
- 2.3. Toners and Printing Inks
- 2.4. Coatings
- 2.5. Textile Fiber
- 2.6. Other Applications
Carbon Black Market Segmentation By Geography
-
1. Asia Pacific
- 1.1. China
- 1.2. India
- 1.3. Japan
- 1.4. South Korea
- 1.5. Rest of Asia Pacific
-
2. North America
- 2.1. United States
- 2.2. Canada
- 2.3. Mexico
-
3. Europe
- 3.1. Germany
- 3.2. United Kingdom
- 3.3. Italy
- 3.4. France
- 3.5. Rest of Europe
-
4. South America
- 4.1. Brazil
- 4.2. Argentina
- 4.3. Rest of South America
-
5. Middle East and Africa
- 5.1. Saudi Arabia
- 5.2. South Africa
- 5.3. United Arab Emirates
- 5.4. Rest of Middle East and Africa
Carbon Black Market Regional Market Share
Geographic Coverage of Carbon Black Market
Carbon Black Market REPORT HIGHLIGHTS
| Aspects | Details |
|---|---|
| Study Period | 2020-2034 |
| Base Year | 2025 |
| Estimated Year | 2026 |
| Forecast Period | 2026-2034 |
| Historical Period | 2020-2025 |
| Growth Rate | CAGR of 5.75% from 2020-2034 |
| Segmentation |
|
Table of Contents
- 1. Introduction
- 1.1. Research Scope
- 1.2. Market Segmentation
- 1.3. Research Objective
- 1.4. Definitions and Assumptions
- 2. Executive Summary
- 2.1. Market Snapshot
- 3. Market Dynamics
- 3.1. Market Drivers
- 3.2. Market Restrains
- 3.3. Market Trends
- 3.4. Market Opportunities
- 4. Market Factor Analysis
- 4.1. Porters Five Forces
- 4.1.1. Bargaining Power of Suppliers
- 4.1.2. Bargaining Power of Buyers
- 4.1.3. Threat of New Entrants
- 4.1.4. Threat of Substitutes
- 4.1.5. Competitive Rivalry
- 4.2. PESTEL analysis
- 4.3. BCG Analysis
- 4.3.1. Stars (High Growth, High Market Share)
- 4.3.2. Cash Cows (Low Growth, High Market Share)
- 4.3.3. Question Mark (High Growth, Low Market Share)
- 4.3.4. Dogs (Low Growth, Low Market Share)
- 4.4. Ansoff Matrix Analysis
- 4.5. Supply Chain Analysis
- 4.6. Regulatory Landscape
- 4.7. Current Market Potential and Opportunity Assessment (TAM–SAM–SOM Framework)
- 4.8. RAX Analyst Note
- 4.1. Porters Five Forces
- 5. Market Analysis, Insights and Forecast 2021-2033
- 5.1. Market Analysis, Insights and Forecast - by Process Type
- 5.1.1. Furnace Black
- 5.1.2. Gas Black
- 5.1.3. Lamp Black
- 5.1.4. Thermal Black
- 5.2. Market Analysis, Insights and Forecast - by Application
- 5.2.1. Tires and Industrial Rubber Products
- 5.2.2. Plastic
- 5.2.3. Toners and Printing Inks
- 5.2.4. Coatings
- 5.2.5. Textile Fiber
- 5.2.6. Other Applications
- 5.3. Market Analysis, Insights and Forecast - by Region
- 5.3.1. Asia Pacific
- 5.3.2. North America
- 5.3.3. Europe
- 5.3.4. South America
- 5.3.5. Middle East and Africa
- 5.1. Market Analysis, Insights and Forecast - by Process Type
- 6. Global Carbon Black Market Analysis, Insights and Forecast, 2021-2033
- 6.1. Market Analysis, Insights and Forecast - by Process Type
- 6.1.1. Furnace Black
- 6.1.2. Gas Black
- 6.1.3. Lamp Black
- 6.1.4. Thermal Black
- 6.2. Market Analysis, Insights and Forecast - by Application
- 6.2.1. Tires and Industrial Rubber Products
- 6.2.2. Plastic
- 6.2.3. Toners and Printing Inks
- 6.2.4. Coatings
- 6.2.5. Textile Fiber
- 6.2.6. Other Applications
- 6.1. Market Analysis, Insights and Forecast - by Process Type
- 7. Asia Pacific Carbon Black Market Analysis, Insights and Forecast, 2020-2032
- 7.1. Market Analysis, Insights and Forecast - by Process Type
- 7.1.1. Furnace Black
- 7.1.2. Gas Black
- 7.1.3. Lamp Black
- 7.1.4. Thermal Black
- 7.2. Market Analysis, Insights and Forecast - by Application
- 7.2.1. Tires and Industrial Rubber Products
- 7.2.2. Plastic
- 7.2.3. Toners and Printing Inks
- 7.2.4. Coatings
- 7.2.5. Textile Fiber
- 7.2.6. Other Applications
- 7.1. Market Analysis, Insights and Forecast - by Process Type
- 8. North America Carbon Black Market Analysis, Insights and Forecast, 2020-2032
- 8.1. Market Analysis, Insights and Forecast - by Process Type
- 8.1.1. Furnace Black
- 8.1.2. Gas Black
- 8.1.3. Lamp Black
- 8.1.4. Thermal Black
- 8.2. Market Analysis, Insights and Forecast - by Application
- 8.2.1. Tires and Industrial Rubber Products
- 8.2.2. Plastic
- 8.2.3. Toners and Printing Inks
- 8.2.4. Coatings
- 8.2.5. Textile Fiber
- 8.2.6. Other Applications
- 8.1. Market Analysis, Insights and Forecast - by Process Type
- 9. Europe Carbon Black Market Analysis, Insights and Forecast, 2020-2032
- 9.1. Market Analysis, Insights and Forecast - by Process Type
- 9.1.1. Furnace Black
- 9.1.2. Gas Black
- 9.1.3. Lamp Black
- 9.1.4. Thermal Black
- 9.2. Market Analysis, Insights and Forecast - by Application
- 9.2.1. Tires and Industrial Rubber Products
- 9.2.2. Plastic
- 9.2.3. Toners and Printing Inks
- 9.2.4. Coatings
- 9.2.5. Textile Fiber
- 9.2.6. Other Applications
- 9.1. Market Analysis, Insights and Forecast - by Process Type
- 10. South America Carbon Black Market Analysis, Insights and Forecast, 2020-2032
- 10.1. Market Analysis, Insights and Forecast - by Process Type
- 10.1.1. Furnace Black
- 10.1.2. Gas Black
- 10.1.3. Lamp Black
- 10.1.4. Thermal Black
- 10.2. Market Analysis, Insights and Forecast - by Application
- 10.2.1. Tires and Industrial Rubber Products
- 10.2.2. Plastic
- 10.2.3. Toners and Printing Inks
- 10.2.4. Coatings
- 10.2.5. Textile Fiber
- 10.2.6. Other Applications
- 10.1. Market Analysis, Insights and Forecast - by Process Type
- 11. Middle East and Africa Carbon Black Market Analysis, Insights and Forecast, 2020-2032
- 11.1. Market Analysis, Insights and Forecast - by Process Type
- 11.1.1. Furnace Black
- 11.1.2. Gas Black
- 11.1.3. Lamp Black
- 11.1.4. Thermal Black
- 11.2. Market Analysis, Insights and Forecast - by Application
- 11.2.1. Tires and Industrial Rubber Products
- 11.2.2. Plastic
- 11.2.3. Toners and Printing Inks
- 11.2.4. Coatings
- 11.2.5. Textile Fiber
- 11.2.6. Other Applications
- 11.1. Market Analysis, Insights and Forecast - by Process Type
- 12. Competitive Analysis
- 12.1. Company Profiles
- 12.1.1 Jiangxi Heimao Carbon Black Co Ltd
- 12.1.1.1. Company Overview
- 12.1.1.2. Products
- 12.1.1.3. Company Financials
- 12.1.1.4. SWOT Analysis
- 12.1.2 Omsk Carbon Group
- 12.1.2.1. Company Overview
- 12.1.2.2. Products
- 12.1.2.3. Company Financials
- 12.1.2.4. SWOT Analysis
- 12.1.3 Asahi Carbon Co Ltd
- 12.1.3.1. Company Overview
- 12.1.3.2. Products
- 12.1.3.3. Company Financials
- 12.1.3.4. SWOT Analysis
- 12.1.4 Mitsubishi Chemical Corporation
- 12.1.4.1. Company Overview
- 12.1.4.2. Products
- 12.1.4.3. Company Financials
- 12.1.4.4. SWOT Analysis
- 12.1.5 Cabot Corporation
- 12.1.5.1. Company Overview
- 12.1.5.2. Products
- 12.1.5.3. Company Financials
- 12.1.5.4. SWOT Analysis
- 12.1.6 Epsilon Carbon Private Limited
- 12.1.6.1. Company Overview
- 12.1.6.2. Products
- 12.1.6.3. Company Financials
- 12.1.6.4. SWOT Analysis
- 12.1.7 NNPC Limited
- 12.1.7.1. Company Overview
- 12.1.7.2. Products
- 12.1.7.3. Company Financials
- 12.1.7.4. SWOT Analysis
- 12.1.8 Himadri Speciality Chemical Ltd
- 12.1.8.1. Company Overview
- 12.1.8.2. Products
- 12.1.8.3. Company Financials
- 12.1.8.4. SWOT Analysis
- 12.1.9 ADNOC Group
- 12.1.9.1. Company Overview
- 12.1.9.2. Products
- 12.1.9.3. Company Financials
- 12.1.9.4. SWOT Analysis
- 12.1.10 Longxing Chemical Stock Co Ltd
- 12.1.10.1. Company Overview
- 12.1.10.2. Products
- 12.1.10.3. Company Financials
- 12.1.10.4. SWOT Analysis
- 12.1.11 PCBL Limited
- 12.1.11.1. Company Overview
- 12.1.11.2. Products
- 12.1.11.3. Company Financials
- 12.1.11.4. SWOT Analysis
- 12.1.12 International CSRC Investment Holdings Co Ltd
- 12.1.12.1. Company Overview
- 12.1.12.2. Products
- 12.1.12.3. Company Financials
- 12.1.12.4. SWOT Analysis
- 12.1.13 Imerys SA
- 12.1.13.1. Company Overview
- 12.1.13.2. Products
- 12.1.13.3. Company Financials
- 12.1.13.4. SWOT Analysis
- 12.1.14 Tokai Carbon Co Ltd*List Not Exhaustive
- 12.1.14.1. Company Overview
- 12.1.14.2. Products
- 12.1.14.3. Company Financials
- 12.1.14.4. SWOT Analysis
- 12.1.15 OCI Company Ltd
- 12.1.15.1. Company Overview
- 12.1.15.2. Products
- 12.1.15.3. Company Financials
- 12.1.15.4. SWOT Analysis
- 12.1.16 BKT Carbon
- 12.1.16.1. Company Overview
- 12.1.16.2. Products
- 12.1.16.3. Company Financials
- 12.1.16.4. SWOT Analysis
- 12.1.17 Orion Engineered Carbons SA
- 12.1.17.1. Company Overview
- 12.1.17.2. Products
- 12.1.17.3. Company Financials
- 12.1.17.4. SWOT Analysis
- 12.1.18 Birla Carbon (Aditya Birla Group)
- 12.1.18.1. Company Overview
- 12.1.18.2. Products
- 12.1.18.3. Company Financials
- 12.1.18.4. SWOT Analysis
- 12.1.1 Jiangxi Heimao Carbon Black Co Ltd
- 12.2. Market Entropy
- 12.2.1 Company's Key Areas Served
- 12.2.2 Recent Developments
- 12.3. Company Market Share Analysis 2025
- 12.3.1 Top 5 Companies Market Share Analysis
- 12.3.2 Top 3 Companies Market Share Analysis
- 12.4. List of Potential Customers
- 13. Research Methodology
List of Figures
- Figure 1: Global Carbon Black Market Revenue Breakdown (Million, %) by Region 2025 & 2033
- Figure 2: Asia Pacific Carbon Black Market Revenue (Million), by Process Type 2025 & 2033
- Figure 3: Asia Pacific Carbon Black Market Revenue Share (%), by Process Type 2025 & 2033
- Figure 4: Asia Pacific Carbon Black Market Revenue (Million), by Application 2025 & 2033
- Figure 5: Asia Pacific Carbon Black Market Revenue Share (%), by Application 2025 & 2033
- Figure 6: Asia Pacific Carbon Black Market Revenue (Million), by Country 2025 & 2033
- Figure 7: Asia Pacific Carbon Black Market Revenue Share (%), by Country 2025 & 2033
- Figure 8: North America Carbon Black Market Revenue (Million), by Process Type 2025 & 2033
- Figure 9: North America Carbon Black Market Revenue Share (%), by Process Type 2025 & 2033
- Figure 10: North America Carbon Black Market Revenue (Million), by Application 2025 & 2033
- Figure 11: North America Carbon Black Market Revenue Share (%), by Application 2025 & 2033
- Figure 12: North America Carbon Black Market Revenue (Million), by Country 2025 & 2033
- Figure 13: North America Carbon Black Market Revenue Share (%), by Country 2025 & 2033
- Figure 14: Europe Carbon Black Market Revenue (Million), by Process Type 2025 & 2033
- Figure 15: Europe Carbon Black Market Revenue Share (%), by Process Type 2025 & 2033
- Figure 16: Europe Carbon Black Market Revenue (Million), by Application 2025 & 2033
- Figure 17: Europe Carbon Black Market Revenue Share (%), by Application 2025 & 2033
- Figure 18: Europe Carbon Black Market Revenue (Million), by Country 2025 & 2033
- Figure 19: Europe Carbon Black Market Revenue Share (%), by Country 2025 & 2033
- Figure 20: South America Carbon Black Market Revenue (Million), by Process Type 2025 & 2033
- Figure 21: South America Carbon Black Market Revenue Share (%), by Process Type 2025 & 2033
- Figure 22: South America Carbon Black Market Revenue (Million), by Application 2025 & 2033
- Figure 23: South America Carbon Black Market Revenue Share (%), by Application 2025 & 2033
- Figure 24: South America Carbon Black Market Revenue (Million), by Country 2025 & 2033
- Figure 25: South America Carbon Black Market Revenue Share (%), by Country 2025 & 2033
- Figure 26: Middle East and Africa Carbon Black Market Revenue (Million), by Process Type 2025 & 2033
- Figure 27: Middle East and Africa Carbon Black Market Revenue Share (%), by Process Type 2025 & 2033
- Figure 28: Middle East and Africa Carbon Black Market Revenue (Million), by Application 2025 & 2033
- Figure 29: Middle East and Africa Carbon Black Market Revenue Share (%), by Application 2025 & 2033
- Figure 30: Middle East and Africa Carbon Black Market Revenue (Million), by Country 2025 & 2033
- Figure 31: Middle East and Africa Carbon Black Market Revenue Share (%), by Country 2025 & 2033
List of Tables
- Table 1: Global Carbon Black Market Revenue Million Forecast, by Process Type 2020 & 2033
- Table 2: Global Carbon Black Market Revenue Million Forecast, by Application 2020 & 2033
- Table 3: Global Carbon Black Market Revenue Million Forecast, by Region 2020 & 2033
- Table 4: Global Carbon Black Market Revenue Million Forecast, by Process Type 2020 & 2033
- Table 5: Global Carbon Black Market Revenue Million Forecast, by Application 2020 & 2033
- Table 6: Global Carbon Black Market Revenue Million Forecast, by Country 2020 & 2033
- Table 7: China Carbon Black Market Revenue (Million) Forecast, by Application 2020 & 2033
- Table 8: India Carbon Black Market Revenue (Million) Forecast, by Application 2020 & 2033
- Table 9: Japan Carbon Black Market Revenue (Million) Forecast, by Application 2020 & 2033
- Table 10: South Korea Carbon Black Market Revenue (Million) Forecast, by Application 2020 & 2033
- Table 11: Rest of Asia Pacific Carbon Black Market Revenue (Million) Forecast, by Application 2020 & 2033
- Table 12: Global Carbon Black Market Revenue Million Forecast, by Process Type 2020 & 2033
- Table 13: Global Carbon Black Market Revenue Million Forecast, by Application 2020 & 2033
- Table 14: Global Carbon Black Market Revenue Million Forecast, by Country 2020 & 2033
- Table 15: United States Carbon Black Market Revenue (Million) Forecast, by Application 2020 & 2033
- Table 16: Canada Carbon Black Market Revenue (Million) Forecast, by Application 2020 & 2033
- Table 17: Mexico Carbon Black Market Revenue (Million) Forecast, by Application 2020 & 2033
- Table 18: Global Carbon Black Market Revenue Million Forecast, by Process Type 2020 & 2033
- Table 19: Global Carbon Black Market Revenue Million Forecast, by Application 2020 & 2033
- Table 20: Global Carbon Black Market Revenue Million Forecast, by Country 2020 & 2033
- Table 21: Germany Carbon Black Market Revenue (Million) Forecast, by Application 2020 & 2033
- Table 22: United Kingdom Carbon Black Market Revenue (Million) Forecast, by Application 2020 & 2033
- Table 23: Italy Carbon Black Market Revenue (Million) Forecast, by Application 2020 & 2033
- Table 24: France Carbon Black Market Revenue (Million) Forecast, by Application 2020 & 2033
- Table 25: Rest of Europe Carbon Black Market Revenue (Million) Forecast, by Application 2020 & 2033
- Table 26: Global Carbon Black Market Revenue Million Forecast, by Process Type 2020 & 2033
- Table 27: Global Carbon Black Market Revenue Million Forecast, by Application 2020 & 2033
- Table 28: Global Carbon Black Market Revenue Million Forecast, by Country 2020 & 2033
- Table 29: Brazil Carbon Black Market Revenue (Million) Forecast, by Application 2020 & 2033
- Table 30: Argentina Carbon Black Market Revenue (Million) Forecast, by Application 2020 & 2033
- Table 31: Rest of South America Carbon Black Market Revenue (Million) Forecast, by Application 2020 & 2033
- Table 32: Global Carbon Black Market Revenue Million Forecast, by Process Type 2020 & 2033
- Table 33: Global Carbon Black Market Revenue Million Forecast, by Application 2020 & 2033
- Table 34: Global Carbon Black Market Revenue Million Forecast, by Country 2020 & 2033
- Table 35: Saudi Arabia Carbon Black Market Revenue (Million) Forecast, by Application 2020 & 2033
- Table 36: South Africa Carbon Black Market Revenue (Million) Forecast, by Application 2020 & 2033
- Table 37: United Arab Emirates Carbon Black Market Revenue (Million) Forecast, by Application 2020 & 2033
- Table 38: Rest of Middle East and Africa Carbon Black Market Revenue (Million) Forecast, by Application 2020 & 2033
Frequently Asked Questions
1. What is the projected Compound Annual Growth Rate (CAGR) of the Carbon Black Market?
The projected CAGR is approximately 5.75%.
2. Which companies are prominent players in the Carbon Black Market?
Key companies in the market include Jiangxi Heimao Carbon Black Co Ltd, Omsk Carbon Group, Asahi Carbon Co Ltd, Mitsubishi Chemical Corporation, Cabot Corporation, Epsilon Carbon Private Limited, NNPC Limited, Himadri Speciality Chemical Ltd, ADNOC Group, Longxing Chemical Stock Co Ltd, PCBL Limited, International CSRC Investment Holdings Co Ltd, Imerys SA, Tokai Carbon Co Ltd*List Not Exhaustive, OCI Company Ltd, BKT Carbon, Orion Engineered Carbons SA, Birla Carbon (Aditya Birla Group).
3. What are the main segments of the Carbon Black Market?
The market segments include Process Type, Application.
4. Can you provide details about the market size?
The market size is estimated to be USD 22.79 Million as of 2022.
5. What are some drivers contributing to market growth?
Increasing Market Penetration of Specialty Black; Growing Applications in the Batteries Segment.
6. What are the notable trends driving market growth?
Increasing Application of Tires and Industrial Rubber Products.
7. Are there any restraints impacting market growth?
Increasing Investments for Recovered Carbon Black; Volatility in Prices of Raw Materials.
8. Can you provide examples of recent developments in the market?
June 2023: PCBL Limited initiated two growth projects which incorporate the new plant expansion in Chennai, Tamil Nadu, and an existing plant project at Mundra, Gujarat. This expansion is divided into two stages, and the first stage of the specialty chemical line is expected to be put into operation by the first quarter of the fiscal year 2023-24. As a result, the overall manufacturing capacity of the company is estimated to reach 790,000 MTPA and 122 MW of renewable energy.
9. What pricing options are available for accessing the report?
Pricing options include single-user, multi-user, and enterprise licenses priced at USD 4750, USD 5250, and USD 8750 respectively.
10. Is the market size provided in terms of value or volume?
The market size is provided in terms of value, measured in Million.
11. Are there any specific market keywords associated with the report?
Yes, the market keyword associated with the report is "Carbon Black Market," which aids in identifying and referencing the specific market segment covered.
12. How do I determine which pricing option suits my needs best?
The pricing options vary based on user requirements and access needs. Individual users may opt for single-user licenses, while businesses requiring broader access may choose multi-user or enterprise licenses for cost-effective access to the report.
13. Are there any additional resources or data provided in the Carbon Black Market report?
While the report offers comprehensive insights, it's advisable to review the specific contents or supplementary materials provided to ascertain if additional resources or data are available.
14. How can I stay updated on further developments or reports in the Carbon Black Market?
To stay informed about further developments, trends, and reports in the Carbon Black Market, consider subscribing to industry newsletters, following relevant companies and organizations, or regularly checking reputable industry news sources and publications.
Methodology
Step 1 - Identification of Relevant Samples Size from Population Database


Step 2 - Approaches for Defining Global Market Size (Value, Volume* & Price*)

Note*: In applicable scenarios
Step 3 - Data Sources
Primary Research
- Web Analytics
- Survey Reports
- Research Institute
- Latest Research Reports
- Opinion Leaders
Secondary Research
- Annual Reports
- White Paper
- Latest Press Release
- Industry Association
- Paid Database
- Investor Presentations

Step 4 - Data Triangulation
Involves using different sources of information in order to increase the validity of a study
These sources are likely to be stakeholders in a program - participants, other researchers, program staff, other community members, and so on.
Then we put all data in single framework & apply various statistical tools to find out the dynamic on the market.
During the analysis stage, feedback from the stakeholder groups would be compared to determine areas of agreement as well as areas of divergence