


Key Insights
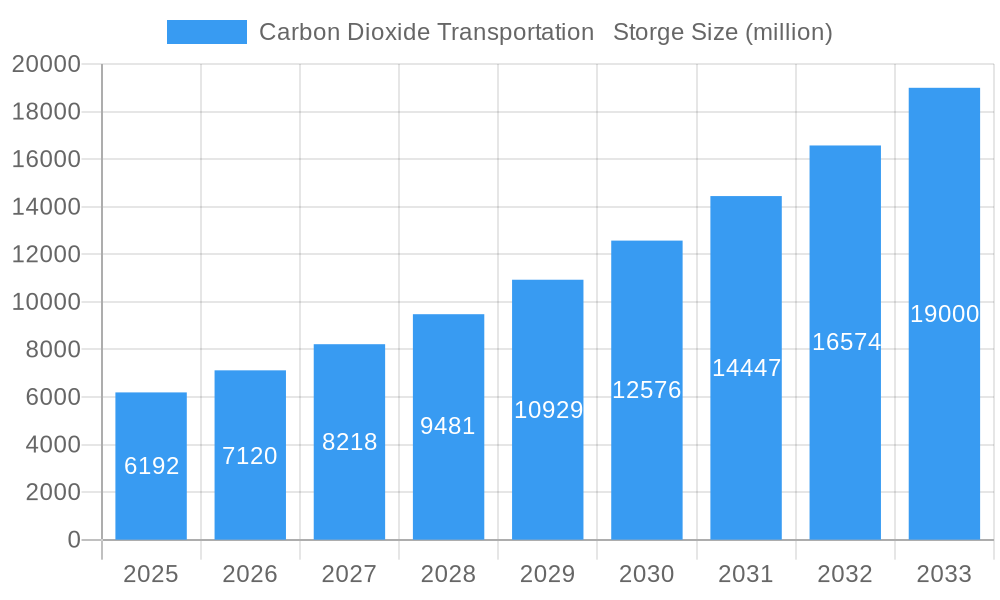
The carbon dioxide (CO2) transportation and storage market is experiencing significant growth, driven by increasing global efforts to mitigate climate change and reduce greenhouse gas emissions. With a 2025 market size of $6,192 million and a Compound Annual Growth Rate (CAGR) of 15% projected through 2033, the market is poised for substantial expansion. Key drivers include stringent government regulations promoting carbon capture, utilization, and storage (CCUS) technologies, growing corporate sustainability initiatives, and the escalating demand for low-carbon energy sources. The market is witnessing the adoption of innovative transportation methods, including pipelines, ships, and trucks, optimized for efficient and safe CO2 handling. Furthermore, advancements in storage technologies, such as saline aquifers and depleted oil and gas reservoirs, are enhancing the market’s capacity to accommodate increasing CO2 volumes. Competition among major players like Baker Hughes, Chevron, and Kinder Morgan is fostering technological advancements and driving down costs, making CO2 transportation and storage increasingly viable for various industries.

Carbon Dioxide Transportation Storge Market Size (In Billion)

The market segmentation likely includes different transportation modes (pipeline, maritime, trucking), storage types (geological formations, depleted reservoirs), and industry verticals (power generation, industrial processes). Geographical variations in regulatory frameworks and resource availability will influence regional growth patterns. While challenges remain, including the high initial investment costs associated with CCUS infrastructure and potential public concerns regarding storage safety, the long-term outlook for the CO2 transportation and storage market remains positive, fueled by the global imperative to decarbonize the economy. The industry is likely to witness strategic partnerships and mergers & acquisitions as companies strive to secure market share and develop integrated solutions spanning the entire CO2 value chain, from capture to transport and permanent storage.
Carbon Dioxide Transportation Storge Company Market Share
This comprehensive report provides an in-depth analysis of the Carbon Dioxide (CO2) Transportation & Storage market, offering invaluable insights for industry stakeholders, investors, and strategic decision-makers. Covering the period from 2019 to 2033, with a focus on 2025, this report meticulously examines market dynamics, technological advancements, and key players shaping this rapidly evolving sector. The study period encompasses historical data (2019-2024), the base year (2025), and a detailed forecast (2025-2033).
Carbon Dioxide Transportation & Storage Market Concentration & Innovation
This section analyzes the competitive landscape of the CO2 Transportation & Storage market, focusing on market concentration, innovation drivers, regulatory influences, and mergers & acquisitions (M&A) activity. The report explores the market share held by key players like Baker Hughes, Chevron Corporation, Kinder Morgan, and others, providing a clear picture of market dominance. Analysis includes the impact of regulatory frameworks on market growth, the role of product substitutes, evolving end-user trends, and the financial implications of significant M&A deals valued in millions of dollars. For example, xx million was invested in infrastructure upgrades in 2024, while M&A activity in 2023 totaled approximately xx million. The report identifies key innovation drivers such as advancements in CO2 capture technologies and pipeline infrastructure, analyzing their influence on market expansion.
Carbon Dioxide Transportation & Storage Industry Trends & Insights
This section delves into the prevailing trends and insights shaping the CO2 Transportation & Storage market. It examines the market's compound annual growth rate (CAGR) and market penetration rates, detailing the factors driving growth, including increased regulatory pressure for carbon emission reduction and the rising adoption of carbon capture, utilization, and storage (CCUS) technologies. The report explores technological disruptions, such as the development of novel transportation methods and storage solutions, and analyses their impact on market dynamics. Further analysis encompasses shifts in consumer preferences regarding environmentally friendly practices and the competitive dynamics among major players, focusing on their strategic moves and market positioning. The estimated market size in 2025 is projected at xx million, with a projected CAGR of xx% during the forecast period.
Dominant Markets & Segments in Carbon Dioxide Transportation & Storage
This section identifies the leading geographical regions and market segments within the CO2 Transportation & Storage market. Detailed analysis will pinpoint the dominant region/country based on factors such as favorable government policies, robust infrastructure, and significant industrial activity.
- Key Drivers (Examples):
- Favorable economic policies incentivizing CO2 storage projects.
- Existing extensive pipeline infrastructure.
- High concentration of industrial emitters.
- Government subsidies and tax benefits.
- Strong public-private partnerships.
The section will also identify dominant segments based on transportation methods (pipelines, ships, trucks) and storage types (geological formations, depleted oil and gas reservoirs). A comprehensive analysis explaining the reasons behind the dominance of each segment will be presented, including the impact of each factor.
Carbon Dioxide Transportation & Storage Product Developments
This section summarizes recent product innovations in CO2 transportation and storage. This includes new technologies for efficient CO2 capture, improved pipeline materials for enhanced durability and safety, and advanced monitoring systems for secure storage. The report will evaluate the competitive advantages offered by these innovations, highlighting their market fit and potential to disrupt existing technologies. The focus will be on the technological trends driving product development and their impact on market adoption.
Report Scope & Segmentation Analysis
This report segments the CO2 Transportation & Storage market based on several key factors including transportation mode (pipeline, ship, truck), storage type (onshore, offshore, depleted oil and gas reservoirs), and geographic region. Each segment will have a dedicated analysis covering market size, growth projections, and competitive landscape. For example, the pipeline segment is expected to dominate due to its cost-effectiveness for long-distance transportation. The offshore storage segment is predicted to exhibit significant growth due to the increasing availability of suitable geological formations.
Key Drivers of Carbon Dioxide Transportation & Storage Growth
The growth of the CO2 Transportation & Storage market is driven by a confluence of factors. Stringent government regulations aimed at reducing carbon emissions are a primary driver, alongside the increasing demand for CCUS technologies from various industries. Technological advancements in CO2 capture and storage are also accelerating market growth, as are economic incentives offered by governments and private investors to support large-scale CO2 storage projects.
Challenges in the Carbon Dioxide Transportation & Storage Sector
Several challenges hinder the growth of the CO2 Transportation & Storage market. Stringent regulatory approvals and permitting processes can delay project implementation. Supply chain disruptions can impact the availability of necessary materials and equipment. Furthermore, competition from alternative carbon reduction technologies and the high initial investment costs associated with CO2 transportation and storage projects pose considerable challenges.
Emerging Opportunities in Carbon Dioxide Transportation & Storage
Despite the challenges, the CO2 Transportation & Storage market presents several significant opportunities. The development of new transportation and storage technologies offers potential for improved efficiency and reduced costs. Expanding into new geographical regions with significant CO2 emission sources presents further opportunities for market growth. The increasing focus on carbon neutrality initiatives and the growing adoption of CCUS technologies in various sectors are driving further growth prospects.
Leading Players in the Carbon Dioxide Transportation & Storage Market
- Baker Hughes
- Chevron Corporation
- Kinder Morgan
- Nippon Sanso Holdings Corporation
- Enbridge Inc.
- GRTgaz
- SLB
- DNV
- Fluor Corporation
- Denbury Inc
- Larvik Shipping
- Wolf Midstream
- Summit Carbon Solutions
- OLCV (Occidental)
- TC Energy (Partner with Pembina)
- Porthos
- Dan-Unity CO2
- Northern Lights
Key Developments in Carbon Dioxide Transportation & Storage Industry
- 2023 Q4: Summit Carbon Solutions announced a major pipeline expansion project.
- 2024 Q1: Chevron Corporation invested xx million in developing a new CO2 storage facility.
- 2024 Q3: A significant merger between two CO2 transportation companies resulted in a combined market share of xx%. (Note: Specifics would need to be verified for accuracy. Using xx as placeholder until data is available)
Strategic Outlook for Carbon Dioxide Transportation & Storage Market
The future of the CO2 Transportation & Storage market is bright. Government regulations, technological advancements, and the increasing awareness of climate change are creating a favorable environment for sustained growth. The continued development of CCUS technologies, coupled with expanding infrastructure, points to a significant market expansion in the coming years, presenting significant opportunities for established players and new entrants alike. The report concludes by highlighting the key growth catalysts and providing a strategic outlook for market participants.
Carbon Dioxide Transportation Storge Segmentation
-
1. Application
- 1.1. undefined
-
2. Type
- 2.1. undefined
Carbon Dioxide Transportation Storge Segmentation By Geography
- 1. undefined
- 2. undefined
- 3. undefined
- 4. undefined
- 5. undefined

Carbon Dioxide Transportation Storge Regional Market Share
Geographic Coverage of Carbon Dioxide Transportation Storge
Carbon Dioxide Transportation Storge REPORT HIGHLIGHTS
| Aspects | Details |
|---|---|
| Study Period | 2020-2034 |
| Base Year | 2025 |
| Estimated Year | 2026 |
| Forecast Period | 2026-2034 |
| Historical Period | 2020-2025 |
| Growth Rate | CAGR of 15% from 2020-2034 |
| Segmentation |
|
Table of Contents
- 1. Introduction
- 1.1. Research Scope
- 1.2. Market Segmentation
- 1.3. Research Methodology
- 1.4. Definitions and Assumptions
- 2. Executive Summary
- 2.1. Introduction
- 3. Market Dynamics
- 3.1. Introduction
- 3.2. Market Drivers
- 3.3. Market Restrains
- 3.4. Market Trends
- 4. Market Factor Analysis
- 4.1. Porters Five Forces
- 4.2. Supply/Value Chain
- 4.3. PESTEL analysis
- 4.4. Market Entropy
- 4.5. Patent/Trademark Analysis
- 5. Global Carbon Dioxide Transportation Storge Analysis, Insights and Forecast, 2020-2032
- 5.1. Market Analysis, Insights and Forecast - by Application
- 5.1.1.
- 5.2. Market Analysis, Insights and Forecast - by Type
- 5.2.1.
- 5.3. Market Analysis, Insights and Forecast - by Region
- 5.3.1.
- 5.3.2.
- 5.3.3.
- 5.3.4.
- 5.3.5.
- 5.1. Market Analysis, Insights and Forecast - by Application
- 6. undefined Carbon Dioxide Transportation Storge Analysis, Insights and Forecast, 2020-2032
- 6.1. Market Analysis, Insights and Forecast - by Application
- 6.1.1.
- 6.2. Market Analysis, Insights and Forecast - by Type
- 6.2.1.
- 6.1. Market Analysis, Insights and Forecast - by Application
- 7. undefined Carbon Dioxide Transportation Storge Analysis, Insights and Forecast, 2020-2032
- 7.1. Market Analysis, Insights and Forecast - by Application
- 7.1.1.
- 7.2. Market Analysis, Insights and Forecast - by Type
- 7.2.1.
- 7.1. Market Analysis, Insights and Forecast - by Application
- 8. undefined Carbon Dioxide Transportation Storge Analysis, Insights and Forecast, 2020-2032
- 8.1. Market Analysis, Insights and Forecast - by Application
- 8.1.1.
- 8.2. Market Analysis, Insights and Forecast - by Type
- 8.2.1.
- 8.1. Market Analysis, Insights and Forecast - by Application
- 9. undefined Carbon Dioxide Transportation Storge Analysis, Insights and Forecast, 2020-2032
- 9.1. Market Analysis, Insights and Forecast - by Application
- 9.1.1.
- 9.2. Market Analysis, Insights and Forecast - by Type
- 9.2.1.
- 9.1. Market Analysis, Insights and Forecast - by Application
- 10. undefined Carbon Dioxide Transportation Storge Analysis, Insights and Forecast, 2020-2032
- 10.1. Market Analysis, Insights and Forecast - by Application
- 10.1.1.
- 10.2. Market Analysis, Insights and Forecast - by Type
- 10.2.1.
- 10.1. Market Analysis, Insights and Forecast - by Application
- 11. Competitive Analysis
- 11.1. Global Market Share Analysis 2025
- 11.2. Company Profiles
- 11.2.1 Baker Hughes
- 11.2.1.1. Overview
- 11.2.1.2. Products
- 11.2.1.3. SWOT Analysis
- 11.2.1.4. Recent Developments
- 11.2.1.5. Financials (Based on Availability)
- 11.2.2 Chevron Corporation
- 11.2.2.1. Overview
- 11.2.2.2. Products
- 11.2.2.3. SWOT Analysis
- 11.2.2.4. Recent Developments
- 11.2.2.5. Financials (Based on Availability)
- 11.2.3 Kinder Morgan
- 11.2.3.1. Overview
- 11.2.3.2. Products
- 11.2.3.3. SWOT Analysis
- 11.2.3.4. Recent Developments
- 11.2.3.5. Financials (Based on Availability)
- 11.2.4 Nippon Sanso Holdings Corporation
- 11.2.4.1. Overview
- 11.2.4.2. Products
- 11.2.4.3. SWOT Analysis
- 11.2.4.4. Recent Developments
- 11.2.4.5. Financials (Based on Availability)
- 11.2.5 Enbridge Inc.
- 11.2.5.1. Overview
- 11.2.5.2. Products
- 11.2.5.3. SWOT Analysis
- 11.2.5.4. Recent Developments
- 11.2.5.5. Financials (Based on Availability)
- 11.2.6 GRTgaz
- 11.2.6.1. Overview
- 11.2.6.2. Products
- 11.2.6.3. SWOT Analysis
- 11.2.6.4. Recent Developments
- 11.2.6.5. Financials (Based on Availability)
- 11.2.7 SLB
- 11.2.7.1. Overview
- 11.2.7.2. Products
- 11.2.7.3. SWOT Analysis
- 11.2.7.4. Recent Developments
- 11.2.7.5. Financials (Based on Availability)
- 11.2.8 DNV
- 11.2.8.1. Overview
- 11.2.8.2. Products
- 11.2.8.3. SWOT Analysis
- 11.2.8.4. Recent Developments
- 11.2.8.5. Financials (Based on Availability)
- 11.2.9 Fluor Corporation
- 11.2.9.1. Overview
- 11.2.9.2. Products
- 11.2.9.3. SWOT Analysis
- 11.2.9.4. Recent Developments
- 11.2.9.5. Financials (Based on Availability)
- 11.2.10 Denbury Inc
- 11.2.10.1. Overview
- 11.2.10.2. Products
- 11.2.10.3. SWOT Analysis
- 11.2.10.4. Recent Developments
- 11.2.10.5. Financials (Based on Availability)
- 11.2.11 Larvik Shipping
- 11.2.11.1. Overview
- 11.2.11.2. Products
- 11.2.11.3. SWOT Analysis
- 11.2.11.4. Recent Developments
- 11.2.11.5. Financials (Based on Availability)
- 11.2.12 Wolf Midstream
- 11.2.12.1. Overview
- 11.2.12.2. Products
- 11.2.12.3. SWOT Analysis
- 11.2.12.4. Recent Developments
- 11.2.12.5. Financials (Based on Availability)
- 11.2.13 Summit Carbon Solutions
- 11.2.13.1. Overview
- 11.2.13.2. Products
- 11.2.13.3. SWOT Analysis
- 11.2.13.4. Recent Developments
- 11.2.13.5. Financials (Based on Availability)
- 11.2.14 OLCV (Occidental)
- 11.2.14.1. Overview
- 11.2.14.2. Products
- 11.2.14.3. SWOT Analysis
- 11.2.14.4. Recent Developments
- 11.2.14.5. Financials (Based on Availability)
- 11.2.15 TC Energy (Partner with Pembina)
- 11.2.15.1. Overview
- 11.2.15.2. Products
- 11.2.15.3. SWOT Analysis
- 11.2.15.4. Recent Developments
- 11.2.15.5. Financials (Based on Availability)
- 11.2.16 Porthos
- 11.2.16.1. Overview
- 11.2.16.2. Products
- 11.2.16.3. SWOT Analysis
- 11.2.16.4. Recent Developments
- 11.2.16.5. Financials (Based on Availability)
- 11.2.17 Dan-Unity CO2
- 11.2.17.1. Overview
- 11.2.17.2. Products
- 11.2.17.3. SWOT Analysis
- 11.2.17.4. Recent Developments
- 11.2.17.5. Financials (Based on Availability)
- 11.2.18 Northern Lights
- 11.2.18.1. Overview
- 11.2.18.2. Products
- 11.2.18.3. SWOT Analysis
- 11.2.18.4. Recent Developments
- 11.2.18.5. Financials (Based on Availability)
- 11.2.1 Baker Hughes
List of Figures
- Figure 1: Global Carbon Dioxide Transportation Storge Revenue Breakdown (million, %) by Region 2025 & 2033
- Figure 2: undefined Carbon Dioxide Transportation Storge Revenue (million), by Application 2025 & 2033
- Figure 3: undefined Carbon Dioxide Transportation Storge Revenue Share (%), by Application 2025 & 2033
- Figure 4: undefined Carbon Dioxide Transportation Storge Revenue (million), by Type 2025 & 2033
- Figure 5: undefined Carbon Dioxide Transportation Storge Revenue Share (%), by Type 2025 & 2033
- Figure 6: undefined Carbon Dioxide Transportation Storge Revenue (million), by Country 2025 & 2033
- Figure 7: undefined Carbon Dioxide Transportation Storge Revenue Share (%), by Country 2025 & 2033
- Figure 8: undefined Carbon Dioxide Transportation Storge Revenue (million), by Application 2025 & 2033
- Figure 9: undefined Carbon Dioxide Transportation Storge Revenue Share (%), by Application 2025 & 2033
- Figure 10: undefined Carbon Dioxide Transportation Storge Revenue (million), by Type 2025 & 2033
- Figure 11: undefined Carbon Dioxide Transportation Storge Revenue Share (%), by Type 2025 & 2033
- Figure 12: undefined Carbon Dioxide Transportation Storge Revenue (million), by Country 2025 & 2033
- Figure 13: undefined Carbon Dioxide Transportation Storge Revenue Share (%), by Country 2025 & 2033
- Figure 14: undefined Carbon Dioxide Transportation Storge Revenue (million), by Application 2025 & 2033
- Figure 15: undefined Carbon Dioxide Transportation Storge Revenue Share (%), by Application 2025 & 2033
- Figure 16: undefined Carbon Dioxide Transportation Storge Revenue (million), by Type 2025 & 2033
- Figure 17: undefined Carbon Dioxide Transportation Storge Revenue Share (%), by Type 2025 & 2033
- Figure 18: undefined Carbon Dioxide Transportation Storge Revenue (million), by Country 2025 & 2033
- Figure 19: undefined Carbon Dioxide Transportation Storge Revenue Share (%), by Country 2025 & 2033
- Figure 20: undefined Carbon Dioxide Transportation Storge Revenue (million), by Application 2025 & 2033
- Figure 21: undefined Carbon Dioxide Transportation Storge Revenue Share (%), by Application 2025 & 2033
- Figure 22: undefined Carbon Dioxide Transportation Storge Revenue (million), by Type 2025 & 2033
- Figure 23: undefined Carbon Dioxide Transportation Storge Revenue Share (%), by Type 2025 & 2033
- Figure 24: undefined Carbon Dioxide Transportation Storge Revenue (million), by Country 2025 & 2033
- Figure 25: undefined Carbon Dioxide Transportation Storge Revenue Share (%), by Country 2025 & 2033
- Figure 26: undefined Carbon Dioxide Transportation Storge Revenue (million), by Application 2025 & 2033
- Figure 27: undefined Carbon Dioxide Transportation Storge Revenue Share (%), by Application 2025 & 2033
- Figure 28: undefined Carbon Dioxide Transportation Storge Revenue (million), by Type 2025 & 2033
- Figure 29: undefined Carbon Dioxide Transportation Storge Revenue Share (%), by Type 2025 & 2033
- Figure 30: undefined Carbon Dioxide Transportation Storge Revenue (million), by Country 2025 & 2033
- Figure 31: undefined Carbon Dioxide Transportation Storge Revenue Share (%), by Country 2025 & 2033
List of Tables
- Table 1: Global Carbon Dioxide Transportation Storge Revenue million Forecast, by Application 2020 & 2033
- Table 2: Global Carbon Dioxide Transportation Storge Revenue million Forecast, by Type 2020 & 2033
- Table 3: Global Carbon Dioxide Transportation Storge Revenue million Forecast, by Region 2020 & 2033
- Table 4: Global Carbon Dioxide Transportation Storge Revenue million Forecast, by Application 2020 & 2033
- Table 5: Global Carbon Dioxide Transportation Storge Revenue million Forecast, by Type 2020 & 2033
- Table 6: Global Carbon Dioxide Transportation Storge Revenue million Forecast, by Country 2020 & 2033
- Table 7: Global Carbon Dioxide Transportation Storge Revenue million Forecast, by Application 2020 & 2033
- Table 8: Global Carbon Dioxide Transportation Storge Revenue million Forecast, by Type 2020 & 2033
- Table 9: Global Carbon Dioxide Transportation Storge Revenue million Forecast, by Country 2020 & 2033
- Table 10: Global Carbon Dioxide Transportation Storge Revenue million Forecast, by Application 2020 & 2033
- Table 11: Global Carbon Dioxide Transportation Storge Revenue million Forecast, by Type 2020 & 2033
- Table 12: Global Carbon Dioxide Transportation Storge Revenue million Forecast, by Country 2020 & 2033
- Table 13: Global Carbon Dioxide Transportation Storge Revenue million Forecast, by Application 2020 & 2033
- Table 14: Global Carbon Dioxide Transportation Storge Revenue million Forecast, by Type 2020 & 2033
- Table 15: Global Carbon Dioxide Transportation Storge Revenue million Forecast, by Country 2020 & 2033
- Table 16: Global Carbon Dioxide Transportation Storge Revenue million Forecast, by Application 2020 & 2033
- Table 17: Global Carbon Dioxide Transportation Storge Revenue million Forecast, by Type 2020 & 2033
- Table 18: Global Carbon Dioxide Transportation Storge Revenue million Forecast, by Country 2020 & 2033
Frequently Asked Questions
1. What is the projected Compound Annual Growth Rate (CAGR) of the Carbon Dioxide Transportation Storge?
The projected CAGR is approximately 15%.
2. Which companies are prominent players in the Carbon Dioxide Transportation Storge?
Key companies in the market include Baker Hughes, Chevron Corporation, Kinder Morgan, Nippon Sanso Holdings Corporation, Enbridge Inc., GRTgaz, SLB, DNV, Fluor Corporation, Denbury Inc, Larvik Shipping, Wolf Midstream, Summit Carbon Solutions, OLCV (Occidental), TC Energy (Partner with Pembina), Porthos, Dan-Unity CO2, Northern Lights.
3. What are the main segments of the Carbon Dioxide Transportation Storge?
The market segments include Application, Type.
4. Can you provide details about the market size?
The market size is estimated to be USD 6192 million as of 2022.
5. What are some drivers contributing to market growth?
N/A
6. What are the notable trends driving market growth?
N/A
7. Are there any restraints impacting market growth?
N/A
8. Can you provide examples of recent developments in the market?
N/A
9. What pricing options are available for accessing the report?
Pricing options include single-user, multi-user, and enterprise licenses priced at USD 3950.00, USD 5925.00, and USD 7900.00 respectively.
10. Is the market size provided in terms of value or volume?
The market size is provided in terms of value, measured in million.
11. Are there any specific market keywords associated with the report?
Yes, the market keyword associated with the report is "Carbon Dioxide Transportation Storge," which aids in identifying and referencing the specific market segment covered.
12. How do I determine which pricing option suits my needs best?
The pricing options vary based on user requirements and access needs. Individual users may opt for single-user licenses, while businesses requiring broader access may choose multi-user or enterprise licenses for cost-effective access to the report.
13. Are there any additional resources or data provided in the Carbon Dioxide Transportation Storge report?
While the report offers comprehensive insights, it's advisable to review the specific contents or supplementary materials provided to ascertain if additional resources or data are available.
14. How can I stay updated on further developments or reports in the Carbon Dioxide Transportation Storge?
To stay informed about further developments, trends, and reports in the Carbon Dioxide Transportation Storge, consider subscribing to industry newsletters, following relevant companies and organizations, or regularly checking reputable industry news sources and publications.
Methodology
Step 1 - Identification of Relevant Samples Size from Population Database


Step 2 - Approaches for Defining Global Market Size (Value, Volume* & Price*)

Note*: In applicable scenarios
Step 3 - Data Sources
Primary Research
- Web Analytics
- Survey Reports
- Research Institute
- Latest Research Reports
- Opinion Leaders
Secondary Research
- Annual Reports
- White Paper
- Latest Press Release
- Industry Association
- Paid Database
- Investor Presentations

Step 4 - Data Triangulation
Involves using different sources of information in order to increase the validity of a study
These sources are likely to be stakeholders in a program - participants, other researchers, program staff, other community members, and so on.
Then we put all data in single framework & apply various statistical tools to find out the dynamic on the market.
During the analysis stage, feedback from the stakeholder groups would be compared to determine areas of agreement as well as areas of divergence