

Key Insights
The global Carbonate Bath Tablet market is poised for significant expansion, projected to reach an estimated market size of approximately USD 750 million by 2025, with a robust Compound Annual Growth Rate (CAGR) of around 8.5% anticipated through 2033. This upward trajectory is primarily fueled by a growing consumer demand for enhanced self-care routines and the increasing popularity of at-home spa experiences. The convenience and efficacy of carbonate bath tablets in offering therapeutic benefits, such as muscle relaxation and stress relief, are major drivers. Furthermore, the rising disposable incomes across emerging economies, coupled with a heightened awareness of the benefits of aromatherapy and natural ingredients, are contributing to this market's growth. The market is witnessing a substantial shift towards online sales channels, driven by the ease of access, wider product variety, and competitive pricing offered by e-commerce platforms. This digital transformation is enabling manufacturers to reach a broader customer base and cater to evolving consumer purchasing habits.
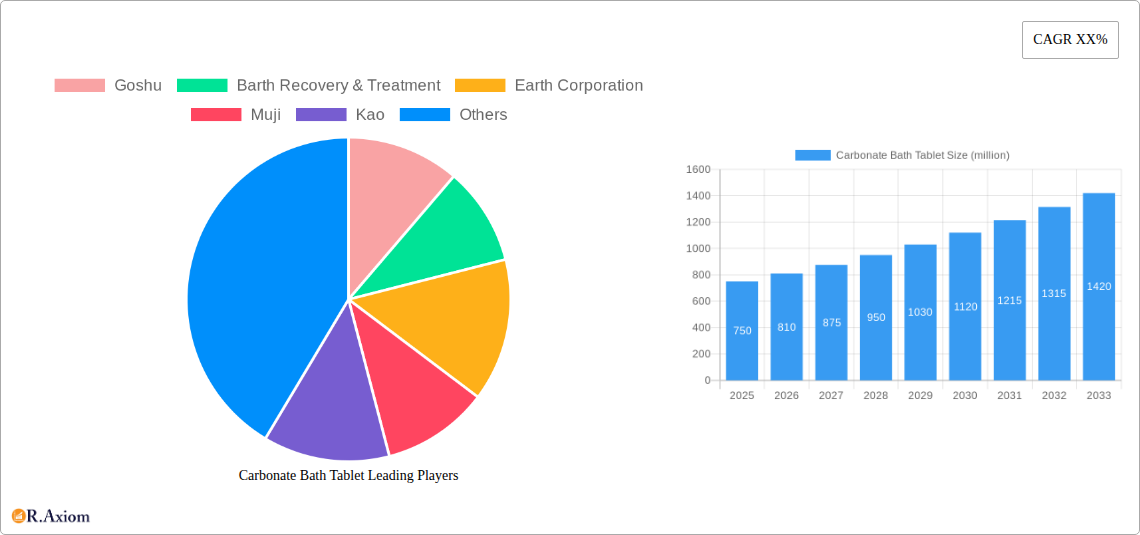
Carbonate Bath Tablet Market Size (In Million)
Key trends shaping the Carbonate Bath Tablet market include a strong emphasis on natural and organic ingredients, with consumers actively seeking products free from synthetic chemicals and artificial fragrances. The demand for specialized formulations catering to specific needs, such as detoxifying, moisturizing, or pain-relieving bath experiences, is also on the rise. Innovation in product development, focusing on unique scent profiles (floral and food flavors) and extended effervescence, is a critical factor for market players. However, challenges such as intense competition from established and emerging brands, as well as potential fluctuations in raw material costs, could pose restraints. Despite these hurdles, the market's inherent appeal in promoting wellness and relaxation, coupled with continuous product innovation and expanding distribution networks, positions the Carbonate Bath Tablet market for sustained and dynamic growth in the coming years.
Carbonate Bath Tablet Company Market Share
Carbonate Bath Tablet Market Concentration & Innovation
The global Carbonate Bath Tablet market exhibits a moderate to high concentration, with key players like Goshu, Earth Corporation, and Kao holding significant market shares estimated to be in the tens of millions of dollars. Innovation is a critical differentiator, primarily driven by the demand for natural ingredients, sustainable packaging, and novel scent profiles. Regulatory frameworks, particularly concerning cosmetic ingredients and safety standards, are increasingly stringent, impacting product formulations and market entry. The threat of product substitutes, such as bath bombs and essential oil blends, remains a constant consideration, albeit carbonate bath tablets offer unique effervescence and mineral benefits. End-user trends lean towards self-care, wellness, and personalized experiences, pushing manufacturers to develop specialized formulations. Mergers and acquisitions (M&A) activities are present, with recent deals valued in the tens of millions of dollars, aimed at consolidating market presence, acquiring innovative technologies, or expanding geographical reach. For instance, the acquisition of a specialized fragrance house by a major player, valued at xx million dollars, highlights the strategic importance of ingredient innovation.
- Market Share: Leading companies command a combined market share of over 50%, with individual shares ranging from millions to tens of millions of dollars.
- M&A Deal Value: Recent M&A transactions have ranged from xx million to xx million dollars, reflecting strategic consolidation and investment in growth.
- Innovation Drivers: Natural ingredients, sustainability, novel fragrances, and therapeutic benefits.
- Regulatory Landscape: Focus on ingredient safety, labeling compliance, and environmental impact.
- Product Substitutes: Bath bombs, Epsom salts, essential oil blends, and liquid bath additives.
Carbonate Bath Tablet Industry Trends & Insights
The Carbonate Bath Tablet industry is poised for robust growth, projected to expand at a Compound Annual Growth Rate (CAGR) of approximately xx% from 2025 to 2033, with the market size anticipated to reach hundreds of millions of dollars by the end of the forecast period. This upward trajectory is fueled by several key market growth drivers. A significant trend is the increasing consumer emphasis on self-care and wellness routines. As individuals prioritize mental and physical well-being, demand for products that enhance relaxation and rejuvenation, such as carbonate bath tablets, has surged. This is further amplified by the rising disposable incomes in developing economies, enabling a broader consumer base to invest in premium personal care products.
Technological disruptions are also playing a crucial role. Advancements in formulation science are leading to the development of carbonate bath tablets with enhanced effervescence, longer-lasting scents, and added therapeutic benefits, such as essential oil infusions and mineral enrichment. Innovations in manufacturing processes are also contributing to greater efficiency and cost-effectiveness, making these products more accessible.
Consumer preferences are evolving dynamically. There is a discernible shift towards natural, organic, and ethically sourced ingredients. Consumers are actively seeking out products free from harsh chemicals and synthetic fragrances, leading manufacturers to reformulate and highlight the natural origins of their ingredients. Furthermore, the demand for personalized and customizable products is growing, with consumers looking for unique scent combinations and specific therapeutic properties. The influence of social media and online influencers has also played a significant role in shaping consumer preferences, popularizing certain ingredients and product benefits.
Competitive dynamics within the Carbonate Bath Tablet sector are intensifying. While established players like Kao and Earth Corporation continue to dominate with their extensive distribution networks and brand recognition, new entrants are emerging, often focusing on niche markets and innovative product offerings. The market penetration of carbonate bath tablets is still relatively low in some regions, presenting a substantial opportunity for growth as awareness and adoption increase. Online sales channels have become increasingly important, with e-commerce platforms facilitating wider reach and enabling direct consumer engagement. Offline sales, through traditional retail channels like pharmacies, beauty stores, and supermarkets, remain a significant segment, catering to consumers who prefer in-person shopping experiences. The competitive landscape is characterized by strategic partnerships, product differentiation, and aggressive marketing campaigns to capture market share, with companies investing millions in research and development and marketing initiatives.
Dominant Markets & Segments in Carbonate Bath Tablet
The Carbonate Bath Tablet market is experiencing significant dominance from specific regions and segments. Geographically, North America and Europe currently represent the leading markets, driven by established wellness cultures, higher disposable incomes, and a strong consumer base actively seeking premium personal care products. Economic policies in these regions, such as supportive trade agreements and consumer protection laws, foster a stable environment for market growth. Furthermore, well-developed retail infrastructure and robust online sales platforms in these regions ensure broad accessibility to carbonate bath tablets.
Within these leading regions, the Online Sales segment is exhibiting exceptional growth, projected to capture a significant market share in the coming years, potentially reaching hundreds of millions of dollars in revenue. This dominance is attributed to the convenience, wider product selection, and competitive pricing offered by e-commerce platforms. The increasing internet penetration and smartphone usage globally further bolster the growth of online sales. Companies are investing millions in optimizing their e-commerce strategies, leveraging digital marketing, and enhancing customer experiences to capitalize on this trend.
In terms of product Types, the Floral Flavor segment holds a prominent position, appealing to a broad consumer base that appreciates soothing and aromatic bathing experiences. The inherent appeal of floral scents, associated with relaxation and natural beauty, drives consistent demand. However, there is a rapidly growing interest in Food Flavor variants, driven by novelty and the desire for unique sensory experiences. This segment, while smaller currently, is anticipated to witness significant growth as manufacturers experiment with innovative flavor profiles and consumers become more adventurous in their choices. The Original Flavor segment continues to maintain a steady market share, serving consumers who prefer simplicity and the core benefits of carbonate bath tablets. The Others segment, encompassing specialized or functional flavors (e.g., medicinal, energizing), is also gaining traction as consumers seek targeted benefits from their bath rituals.
- Dominant Regions: North America and Europe lead due to high disposable incomes, developed retail infrastructure, and strong wellness trends.
- Leading Application Segment: Online Sales are rapidly growing, driven by convenience, product variety, and digital marketing efforts. Significant investments in e-commerce are being made, amounting to millions of dollars annually.
- Key Type Segments: Floral Flavor remains dominant due to its broad appeal. Food Flavor is a rapidly emerging segment with high growth potential.
- Underlying Drivers for Dominance:
- Economic Policies: Favorable trade agreements and consumer protection in leading regions.
- Infrastructure: Well-established retail networks and advanced logistics for online sales.
- Consumer Preferences: Growing demand for self-care, natural ingredients, and unique sensory experiences.
- Technological Advancements: Innovations in formulation and e-commerce capabilities.
Carbonate Bath Tablet Product Developments
Product development in the Carbonate Bath Tablet market is characterized by a focus on enhanced sensory experiences and therapeutic benefits. Innovations are driven by the incorporation of natural essential oils for aromatherapy, mineral-rich salts for skin nourishment, and novel, long-lasting fragrances. Companies are also investing in sustainable and eco-friendly packaging solutions, a key differentiator in today's market, with several players exploring biodegradable materials and reducing plastic usage, impacting packaging costs by millions. Product differentiation is achieved through unique effervescence technologies, color-changing effects, and the inclusion of botanicals. Competitive advantages are being built around ingredient transparency, ethical sourcing, and the ability to cater to specific consumer needs, such as stress relief, muscle relaxation, or skin hydration.
Report Scope & Segmentation Analysis
This comprehensive report delves into the global Carbonate Bath Tablet market, providing detailed analysis across various segmentations. The Application segmentation includes Online Sales and Offline Sales. Online sales are projected to experience a significant CAGR, driven by e-commerce growth and digital marketing efforts, with an estimated market size in the hundreds of millions of dollars. Offline sales, while mature, continue to hold a substantial market share through retail channels. The Types segmentation encompasses Food Flavor, Floral Flavor, Original Flavor, and Others. The Floral Flavor segment currently dominates, but the Food Flavor segment is anticipated to witness substantial growth, with market penetration expected to increase significantly. The Others segment, including specialized functional flavors, also shows promising upward potential. Each segment's growth projections, market sizes, and competitive dynamics are meticulously analyzed.
Key Drivers of Carbonate Bath Tablet Growth
The Carbonate Bath Tablet market is propelled by a confluence of powerful growth drivers. A primary catalyst is the escalating consumer focus on self-care and wellness, as individuals increasingly invest in products that promote relaxation, stress relief, and overall well-being. This trend is supported by rising disposable incomes in emerging economies, making premium personal care products more accessible. Technological advancements in formulation science are enabling the creation of innovative products with enhanced effervescence, superior scent diffusion, and added therapeutic benefits from natural ingredients. Furthermore, the growing consumer preference for natural and organic ingredients, coupled with a demand for sustainable and eco-friendly products, is pushing manufacturers to reformulate and innovate, influencing research and development budgets that can reach millions of dollars.
Challenges in the Carbonate Bath Tablet Sector
Despite its promising growth, the Carbonate Bath Tablet sector faces several significant challenges. Intense competition from established brands and a constant influx of new entrants can lead to price wars and reduced profit margins, impacting revenue streams estimated in the tens of millions of dollars. Regulatory hurdles related to cosmetic ingredient safety, labeling requirements, and environmental standards in different regions can increase compliance costs and slow down market entry. Supply chain disruptions, as witnessed in recent global events, can affect the availability and cost of raw materials, impacting production schedules and profitability. Furthermore, consumer perception and education can be a barrier, with some consumers still unaware of the full benefits or specific applications of carbonate bath tablets compared to more established bath products, potentially limiting market penetration.
Emerging Opportunities in Carbonate Bath Tablet
The Carbonate Bath Tablet market is ripe with emerging opportunities. The growing global trend towards personalized wellness experiences presents a significant avenue for growth, with opportunities for custom-blended scents, therapeutic ingredient combinations, and subscription box models, potentially generating millions in recurring revenue. The increasing demand for sustainable and eco-friendly products is driving innovation in packaging and ingredient sourcing, creating opportunities for brands that prioritize environmental responsibility. Expansion into emerging markets in Asia, Latin America, and Africa, where the middle class is growing and awareness of wellness products is on the rise, offers substantial untapped potential. Furthermore, the development of functional carbonate bath tablets with specific benefits, such as pain relief, skin repair, or sleep enhancement, taps into niche consumer needs and opens up new market segments.
Leading Players in the Carbonate Bath Tablet Market
- Goshu
- Barth Recovery & Treatment
- Earth Corporation
- Muji
- Kao
- Aratel Group
- Nutra Solution
- Holos
- Nagayu
Key Developments in Carbonate Bath Tablet Industry
- 2024: Kao launches a new line of eco-friendly carbonate bath tablets with biodegradable packaging, aiming to capture the environmentally conscious consumer segment. This initiative is supported by millions in R&D funding.
- 2024: Earth Corporation introduces innovative food-flavor infused carbonate bath tablets, expanding its product portfolio and targeting a younger demographic.
- 2023: Goshu acquires a smaller competitor specializing in aromatherapy infusions, enhancing its product offerings and market reach. The deal value was in the tens of millions of dollars.
- 2023: Nagayu patents a new effervescence technology that extends the release of active ingredients, promising longer-lasting therapeutic benefits.
- 2023: Holos expands its online sales channels through partnerships with major e-commerce platforms in Southeast Asia, projecting millions in increased revenue.
Strategic Outlook for Carbonate Bath Tablet Market
The strategic outlook for the Carbonate Bath Tablet market is exceptionally positive, driven by sustained growth catalysts. The increasing consumer demand for holistic wellness and self-care rituals will continue to be a primary growth engine, with significant investment in product innovation and marketing expected to reach hundreds of millions of dollars. The growing adoption of online sales channels and the expansion into emerging markets present substantial opportunities for market penetration and revenue growth. Companies that focus on sustainable practices, natural ingredients, and personalized product offerings will be best positioned to capture market share and achieve long-term success, solidifying their presence in a market valued in the billions of dollars.
Carbonate Bath Tablet Segmentation
-
1. Application
- 1.1. Online Sales
- 1.2. Offline Sales
-
2. Types
- 2.1. Food Flavor
- 2.2. Floral Flavor
- 2.3. Original Flavor
- 2.4. Others
Carbonate Bath Tablet Segmentation By Geography
-
1. North America
- 1.1. United States
- 1.2. Canada
- 1.3. Mexico
-
2. South America
- 2.1. Brazil
- 2.2. Argentina
- 2.3. Rest of South America
-
3. Europe
- 3.1. United Kingdom
- 3.2. Germany
- 3.3. France
- 3.4. Italy
- 3.5. Spain
- 3.6. Russia
- 3.7. Benelux
- 3.8. Nordics
- 3.9. Rest of Europe
-
4. Middle East & Africa
- 4.1. Turkey
- 4.2. Israel
- 4.3. GCC
- 4.4. North Africa
- 4.5. South Africa
- 4.6. Rest of Middle East & Africa
-
5. Asia Pacific
- 5.1. China
- 5.2. India
- 5.3. Japan
- 5.4. South Korea
- 5.5. ASEAN
- 5.6. Oceania
- 5.7. Rest of Asia Pacific
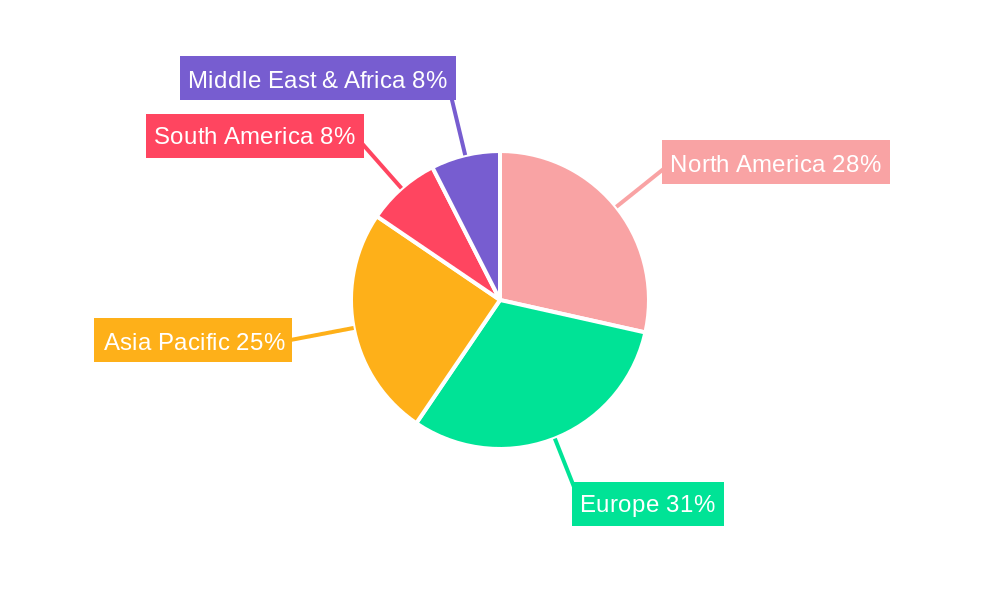
Carbonate Bath Tablet Regional Market Share
Geographic Coverage of Carbonate Bath Tablet
Carbonate Bath Tablet REPORT HIGHLIGHTS
| Aspects | Details |
|---|---|
| Study Period | 2020-2034 |
| Base Year | 2025 |
| Estimated Year | 2026 |
| Forecast Period | 2026-2034 |
| Historical Period | 2020-2025 |
| Growth Rate | CAGR of 5.8% from 2020-2034 |
| Segmentation |
|
Table of Contents
- 1. Introduction
- 1.1. Research Scope
- 1.2. Market Segmentation
- 1.3. Research Methodology
- 1.4. Definitions and Assumptions
- 2. Executive Summary
- 2.1. Introduction
- 3. Market Dynamics
- 3.1. Introduction
- 3.2. Market Drivers
- 3.3. Market Restrains
- 3.4. Market Trends
- 4. Market Factor Analysis
- 4.1. Porters Five Forces
- 4.2. Supply/Value Chain
- 4.3. PESTEL analysis
- 4.4. Market Entropy
- 4.5. Patent/Trademark Analysis
- 5. Global Carbonate Bath Tablet Analysis, Insights and Forecast, 2020-2032
- 5.1. Market Analysis, Insights and Forecast - by Application
- 5.1.1. Online Sales
- 5.1.2. Offline Sales
- 5.2. Market Analysis, Insights and Forecast - by Types
- 5.2.1. Food Flavor
- 5.2.2. Floral Flavor
- 5.2.3. Original Flavor
- 5.2.4. Others
- 5.3. Market Analysis, Insights and Forecast - by Region
- 5.3.1. North America
- 5.3.2. South America
- 5.3.3. Europe
- 5.3.4. Middle East & Africa
- 5.3.5. Asia Pacific
- 5.1. Market Analysis, Insights and Forecast - by Application
- 6. North America Carbonate Bath Tablet Analysis, Insights and Forecast, 2020-2032
- 6.1. Market Analysis, Insights and Forecast - by Application
- 6.1.1. Online Sales
- 6.1.2. Offline Sales
- 6.2. Market Analysis, Insights and Forecast - by Types
- 6.2.1. Food Flavor
- 6.2.2. Floral Flavor
- 6.2.3. Original Flavor
- 6.2.4. Others
- 6.1. Market Analysis, Insights and Forecast - by Application
- 7. South America Carbonate Bath Tablet Analysis, Insights and Forecast, 2020-2032
- 7.1. Market Analysis, Insights and Forecast - by Application
- 7.1.1. Online Sales
- 7.1.2. Offline Sales
- 7.2. Market Analysis, Insights and Forecast - by Types
- 7.2.1. Food Flavor
- 7.2.2. Floral Flavor
- 7.2.3. Original Flavor
- 7.2.4. Others
- 7.1. Market Analysis, Insights and Forecast - by Application
- 8. Europe Carbonate Bath Tablet Analysis, Insights and Forecast, 2020-2032
- 8.1. Market Analysis, Insights and Forecast - by Application
- 8.1.1. Online Sales
- 8.1.2. Offline Sales
- 8.2. Market Analysis, Insights and Forecast - by Types
- 8.2.1. Food Flavor
- 8.2.2. Floral Flavor
- 8.2.3. Original Flavor
- 8.2.4. Others
- 8.1. Market Analysis, Insights and Forecast - by Application
- 9. Middle East & Africa Carbonate Bath Tablet Analysis, Insights and Forecast, 2020-2032
- 9.1. Market Analysis, Insights and Forecast - by Application
- 9.1.1. Online Sales
- 9.1.2. Offline Sales
- 9.2. Market Analysis, Insights and Forecast - by Types
- 9.2.1. Food Flavor
- 9.2.2. Floral Flavor
- 9.2.3. Original Flavor
- 9.2.4. Others
- 9.1. Market Analysis, Insights and Forecast - by Application
- 10. Asia Pacific Carbonate Bath Tablet Analysis, Insights and Forecast, 2020-2032
- 10.1. Market Analysis, Insights and Forecast - by Application
- 10.1.1. Online Sales
- 10.1.2. Offline Sales
- 10.2. Market Analysis, Insights and Forecast - by Types
- 10.2.1. Food Flavor
- 10.2.2. Floral Flavor
- 10.2.3. Original Flavor
- 10.2.4. Others
- 10.1. Market Analysis, Insights and Forecast - by Application
- 11. Competitive Analysis
- 11.1. Global Market Share Analysis 2025
- 11.2. Company Profiles
- 11.2.1 Goshu
- 11.2.1.1. Overview
- 11.2.1.2. Products
- 11.2.1.3. SWOT Analysis
- 11.2.1.4. Recent Developments
- 11.2.1.5. Financials (Based on Availability)
- 11.2.2 Barth Recovery & Treatment
- 11.2.2.1. Overview
- 11.2.2.2. Products
- 11.2.2.3. SWOT Analysis
- 11.2.2.4. Recent Developments
- 11.2.2.5. Financials (Based on Availability)
- 11.2.3 Earth Corporation
- 11.2.3.1. Overview
- 11.2.3.2. Products
- 11.2.3.3. SWOT Analysis
- 11.2.3.4. Recent Developments
- 11.2.3.5. Financials (Based on Availability)
- 11.2.4 Muji
- 11.2.4.1. Overview
- 11.2.4.2. Products
- 11.2.4.3. SWOT Analysis
- 11.2.4.4. Recent Developments
- 11.2.4.5. Financials (Based on Availability)
- 11.2.5 Kao
- 11.2.5.1. Overview
- 11.2.5.2. Products
- 11.2.5.3. SWOT Analysis
- 11.2.5.4. Recent Developments
- 11.2.5.5. Financials (Based on Availability)
- 11.2.6 Aratel Group
- 11.2.6.1. Overview
- 11.2.6.2. Products
- 11.2.6.3. SWOT Analysis
- 11.2.6.4. Recent Developments
- 11.2.6.5. Financials (Based on Availability)
- 11.2.7 Nutra Solution
- 11.2.7.1. Overview
- 11.2.7.2. Products
- 11.2.7.3. SWOT Analysis
- 11.2.7.4. Recent Developments
- 11.2.7.5. Financials (Based on Availability)
- 11.2.8 Holos
- 11.2.8.1. Overview
- 11.2.8.2. Products
- 11.2.8.3. SWOT Analysis
- 11.2.8.4. Recent Developments
- 11.2.8.5. Financials (Based on Availability)
- 11.2.9 Nagayu
- 11.2.9.1. Overview
- 11.2.9.2. Products
- 11.2.9.3. SWOT Analysis
- 11.2.9.4. Recent Developments
- 11.2.9.5. Financials (Based on Availability)
- 11.2.1 Goshu
List of Figures
- Figure 1: Global Carbonate Bath Tablet Revenue Breakdown (undefined, %) by Region 2025 & 2033
- Figure 2: Global Carbonate Bath Tablet Volume Breakdown (K, %) by Region 2025 & 2033
- Figure 3: North America Carbonate Bath Tablet Revenue (undefined), by Application 2025 & 2033
- Figure 4: North America Carbonate Bath Tablet Volume (K), by Application 2025 & 2033
- Figure 5: North America Carbonate Bath Tablet Revenue Share (%), by Application 2025 & 2033
- Figure 6: North America Carbonate Bath Tablet Volume Share (%), by Application 2025 & 2033
- Figure 7: North America Carbonate Bath Tablet Revenue (undefined), by Types 2025 & 2033
- Figure 8: North America Carbonate Bath Tablet Volume (K), by Types 2025 & 2033
- Figure 9: North America Carbonate Bath Tablet Revenue Share (%), by Types 2025 & 2033
- Figure 10: North America Carbonate Bath Tablet Volume Share (%), by Types 2025 & 2033
- Figure 11: North America Carbonate Bath Tablet Revenue (undefined), by Country 2025 & 2033
- Figure 12: North America Carbonate Bath Tablet Volume (K), by Country 2025 & 2033
- Figure 13: North America Carbonate Bath Tablet Revenue Share (%), by Country 2025 & 2033
- Figure 14: North America Carbonate Bath Tablet Volume Share (%), by Country 2025 & 2033
- Figure 15: South America Carbonate Bath Tablet Revenue (undefined), by Application 2025 & 2033
- Figure 16: South America Carbonate Bath Tablet Volume (K), by Application 2025 & 2033
- Figure 17: South America Carbonate Bath Tablet Revenue Share (%), by Application 2025 & 2033
- Figure 18: South America Carbonate Bath Tablet Volume Share (%), by Application 2025 & 2033
- Figure 19: South America Carbonate Bath Tablet Revenue (undefined), by Types 2025 & 2033
- Figure 20: South America Carbonate Bath Tablet Volume (K), by Types 2025 & 2033
- Figure 21: South America Carbonate Bath Tablet Revenue Share (%), by Types 2025 & 2033
- Figure 22: South America Carbonate Bath Tablet Volume Share (%), by Types 2025 & 2033
- Figure 23: South America Carbonate Bath Tablet Revenue (undefined), by Country 2025 & 2033
- Figure 24: South America Carbonate Bath Tablet Volume (K), by Country 2025 & 2033
- Figure 25: South America Carbonate Bath Tablet Revenue Share (%), by Country 2025 & 2033
- Figure 26: South America Carbonate Bath Tablet Volume Share (%), by Country 2025 & 2033
- Figure 27: Europe Carbonate Bath Tablet Revenue (undefined), by Application 2025 & 2033
- Figure 28: Europe Carbonate Bath Tablet Volume (K), by Application 2025 & 2033
- Figure 29: Europe Carbonate Bath Tablet Revenue Share (%), by Application 2025 & 2033
- Figure 30: Europe Carbonate Bath Tablet Volume Share (%), by Application 2025 & 2033
- Figure 31: Europe Carbonate Bath Tablet Revenue (undefined), by Types 2025 & 2033
- Figure 32: Europe Carbonate Bath Tablet Volume (K), by Types 2025 & 2033
- Figure 33: Europe Carbonate Bath Tablet Revenue Share (%), by Types 2025 & 2033
- Figure 34: Europe Carbonate Bath Tablet Volume Share (%), by Types 2025 & 2033
- Figure 35: Europe Carbonate Bath Tablet Revenue (undefined), by Country 2025 & 2033
- Figure 36: Europe Carbonate Bath Tablet Volume (K), by Country 2025 & 2033
- Figure 37: Europe Carbonate Bath Tablet Revenue Share (%), by Country 2025 & 2033
- Figure 38: Europe Carbonate Bath Tablet Volume Share (%), by Country 2025 & 2033
- Figure 39: Middle East & Africa Carbonate Bath Tablet Revenue (undefined), by Application 2025 & 2033
- Figure 40: Middle East & Africa Carbonate Bath Tablet Volume (K), by Application 2025 & 2033
- Figure 41: Middle East & Africa Carbonate Bath Tablet Revenue Share (%), by Application 2025 & 2033
- Figure 42: Middle East & Africa Carbonate Bath Tablet Volume Share (%), by Application 2025 & 2033
- Figure 43: Middle East & Africa Carbonate Bath Tablet Revenue (undefined), by Types 2025 & 2033
- Figure 44: Middle East & Africa Carbonate Bath Tablet Volume (K), by Types 2025 & 2033
- Figure 45: Middle East & Africa Carbonate Bath Tablet Revenue Share (%), by Types 2025 & 2033
- Figure 46: Middle East & Africa Carbonate Bath Tablet Volume Share (%), by Types 2025 & 2033
- Figure 47: Middle East & Africa Carbonate Bath Tablet Revenue (undefined), by Country 2025 & 2033
- Figure 48: Middle East & Africa Carbonate Bath Tablet Volume (K), by Country 2025 & 2033
- Figure 49: Middle East & Africa Carbonate Bath Tablet Revenue Share (%), by Country 2025 & 2033
- Figure 50: Middle East & Africa Carbonate Bath Tablet Volume Share (%), by Country 2025 & 2033
- Figure 51: Asia Pacific Carbonate Bath Tablet Revenue (undefined), by Application 2025 & 2033
- Figure 52: Asia Pacific Carbonate Bath Tablet Volume (K), by Application 2025 & 2033
- Figure 53: Asia Pacific Carbonate Bath Tablet Revenue Share (%), by Application 2025 & 2033
- Figure 54: Asia Pacific Carbonate Bath Tablet Volume Share (%), by Application 2025 & 2033
- Figure 55: Asia Pacific Carbonate Bath Tablet Revenue (undefined), by Types 2025 & 2033
- Figure 56: Asia Pacific Carbonate Bath Tablet Volume (K), by Types 2025 & 2033
- Figure 57: Asia Pacific Carbonate Bath Tablet Revenue Share (%), by Types 2025 & 2033
- Figure 58: Asia Pacific Carbonate Bath Tablet Volume Share (%), by Types 2025 & 2033
- Figure 59: Asia Pacific Carbonate Bath Tablet Revenue (undefined), by Country 2025 & 2033
- Figure 60: Asia Pacific Carbonate Bath Tablet Volume (K), by Country 2025 & 2033
- Figure 61: Asia Pacific Carbonate Bath Tablet Revenue Share (%), by Country 2025 & 2033
- Figure 62: Asia Pacific Carbonate Bath Tablet Volume Share (%), by Country 2025 & 2033
List of Tables
- Table 1: Global Carbonate Bath Tablet Revenue undefined Forecast, by Application 2020 & 2033
- Table 2: Global Carbonate Bath Tablet Volume K Forecast, by Application 2020 & 2033
- Table 3: Global Carbonate Bath Tablet Revenue undefined Forecast, by Types 2020 & 2033
- Table 4: Global Carbonate Bath Tablet Volume K Forecast, by Types 2020 & 2033
- Table 5: Global Carbonate Bath Tablet Revenue undefined Forecast, by Region 2020 & 2033
- Table 6: Global Carbonate Bath Tablet Volume K Forecast, by Region 2020 & 2033
- Table 7: Global Carbonate Bath Tablet Revenue undefined Forecast, by Application 2020 & 2033
- Table 8: Global Carbonate Bath Tablet Volume K Forecast, by Application 2020 & 2033
- Table 9: Global Carbonate Bath Tablet Revenue undefined Forecast, by Types 2020 & 2033
- Table 10: Global Carbonate Bath Tablet Volume K Forecast, by Types 2020 & 2033
- Table 11: Global Carbonate Bath Tablet Revenue undefined Forecast, by Country 2020 & 2033
- Table 12: Global Carbonate Bath Tablet Volume K Forecast, by Country 2020 & 2033
- Table 13: United States Carbonate Bath Tablet Revenue (undefined) Forecast, by Application 2020 & 2033
- Table 14: United States Carbonate Bath Tablet Volume (K) Forecast, by Application 2020 & 2033
- Table 15: Canada Carbonate Bath Tablet Revenue (undefined) Forecast, by Application 2020 & 2033
- Table 16: Canada Carbonate Bath Tablet Volume (K) Forecast, by Application 2020 & 2033
- Table 17: Mexico Carbonate Bath Tablet Revenue (undefined) Forecast, by Application 2020 & 2033
- Table 18: Mexico Carbonate Bath Tablet Volume (K) Forecast, by Application 2020 & 2033
- Table 19: Global Carbonate Bath Tablet Revenue undefined Forecast, by Application 2020 & 2033
- Table 20: Global Carbonate Bath Tablet Volume K Forecast, by Application 2020 & 2033
- Table 21: Global Carbonate Bath Tablet Revenue undefined Forecast, by Types 2020 & 2033
- Table 22: Global Carbonate Bath Tablet Volume K Forecast, by Types 2020 & 2033
- Table 23: Global Carbonate Bath Tablet Revenue undefined Forecast, by Country 2020 & 2033
- Table 24: Global Carbonate Bath Tablet Volume K Forecast, by Country 2020 & 2033
- Table 25: Brazil Carbonate Bath Tablet Revenue (undefined) Forecast, by Application 2020 & 2033
- Table 26: Brazil Carbonate Bath Tablet Volume (K) Forecast, by Application 2020 & 2033
- Table 27: Argentina Carbonate Bath Tablet Revenue (undefined) Forecast, by Application 2020 & 2033
- Table 28: Argentina Carbonate Bath Tablet Volume (K) Forecast, by Application 2020 & 2033
- Table 29: Rest of South America Carbonate Bath Tablet Revenue (undefined) Forecast, by Application 2020 & 2033
- Table 30: Rest of South America Carbonate Bath Tablet Volume (K) Forecast, by Application 2020 & 2033
- Table 31: Global Carbonate Bath Tablet Revenue undefined Forecast, by Application 2020 & 2033
- Table 32: Global Carbonate Bath Tablet Volume K Forecast, by Application 2020 & 2033
- Table 33: Global Carbonate Bath Tablet Revenue undefined Forecast, by Types 2020 & 2033
- Table 34: Global Carbonate Bath Tablet Volume K Forecast, by Types 2020 & 2033
- Table 35: Global Carbonate Bath Tablet Revenue undefined Forecast, by Country 2020 & 2033
- Table 36: Global Carbonate Bath Tablet Volume K Forecast, by Country 2020 & 2033
- Table 37: United Kingdom Carbonate Bath Tablet Revenue (undefined) Forecast, by Application 2020 & 2033
- Table 38: United Kingdom Carbonate Bath Tablet Volume (K) Forecast, by Application 2020 & 2033
- Table 39: Germany Carbonate Bath Tablet Revenue (undefined) Forecast, by Application 2020 & 2033
- Table 40: Germany Carbonate Bath Tablet Volume (K) Forecast, by Application 2020 & 2033
- Table 41: France Carbonate Bath Tablet Revenue (undefined) Forecast, by Application 2020 & 2033
- Table 42: France Carbonate Bath Tablet Volume (K) Forecast, by Application 2020 & 2033
- Table 43: Italy Carbonate Bath Tablet Revenue (undefined) Forecast, by Application 2020 & 2033
- Table 44: Italy Carbonate Bath Tablet Volume (K) Forecast, by Application 2020 & 2033
- Table 45: Spain Carbonate Bath Tablet Revenue (undefined) Forecast, by Application 2020 & 2033
- Table 46: Spain Carbonate Bath Tablet Volume (K) Forecast, by Application 2020 & 2033
- Table 47: Russia Carbonate Bath Tablet Revenue (undefined) Forecast, by Application 2020 & 2033
- Table 48: Russia Carbonate Bath Tablet Volume (K) Forecast, by Application 2020 & 2033
- Table 49: Benelux Carbonate Bath Tablet Revenue (undefined) Forecast, by Application 2020 & 2033
- Table 50: Benelux Carbonate Bath Tablet Volume (K) Forecast, by Application 2020 & 2033
- Table 51: Nordics Carbonate Bath Tablet Revenue (undefined) Forecast, by Application 2020 & 2033
- Table 52: Nordics Carbonate Bath Tablet Volume (K) Forecast, by Application 2020 & 2033
- Table 53: Rest of Europe Carbonate Bath Tablet Revenue (undefined) Forecast, by Application 2020 & 2033
- Table 54: Rest of Europe Carbonate Bath Tablet Volume (K) Forecast, by Application 2020 & 2033
- Table 55: Global Carbonate Bath Tablet Revenue undefined Forecast, by Application 2020 & 2033
- Table 56: Global Carbonate Bath Tablet Volume K Forecast, by Application 2020 & 2033
- Table 57: Global Carbonate Bath Tablet Revenue undefined Forecast, by Types 2020 & 2033
- Table 58: Global Carbonate Bath Tablet Volume K Forecast, by Types 2020 & 2033
- Table 59: Global Carbonate Bath Tablet Revenue undefined Forecast, by Country 2020 & 2033
- Table 60: Global Carbonate Bath Tablet Volume K Forecast, by Country 2020 & 2033
- Table 61: Turkey Carbonate Bath Tablet Revenue (undefined) Forecast, by Application 2020 & 2033
- Table 62: Turkey Carbonate Bath Tablet Volume (K) Forecast, by Application 2020 & 2033
- Table 63: Israel Carbonate Bath Tablet Revenue (undefined) Forecast, by Application 2020 & 2033
- Table 64: Israel Carbonate Bath Tablet Volume (K) Forecast, by Application 2020 & 2033
- Table 65: GCC Carbonate Bath Tablet Revenue (undefined) Forecast, by Application 2020 & 2033
- Table 66: GCC Carbonate Bath Tablet Volume (K) Forecast, by Application 2020 & 2033
- Table 67: North Africa Carbonate Bath Tablet Revenue (undefined) Forecast, by Application 2020 & 2033
- Table 68: North Africa Carbonate Bath Tablet Volume (K) Forecast, by Application 2020 & 2033
- Table 69: South Africa Carbonate Bath Tablet Revenue (undefined) Forecast, by Application 2020 & 2033
- Table 70: South Africa Carbonate Bath Tablet Volume (K) Forecast, by Application 2020 & 2033
- Table 71: Rest of Middle East & Africa Carbonate Bath Tablet Revenue (undefined) Forecast, by Application 2020 & 2033
- Table 72: Rest of Middle East & Africa Carbonate Bath Tablet Volume (K) Forecast, by Application 2020 & 2033
- Table 73: Global Carbonate Bath Tablet Revenue undefined Forecast, by Application 2020 & 2033
- Table 74: Global Carbonate Bath Tablet Volume K Forecast, by Application 2020 & 2033
- Table 75: Global Carbonate Bath Tablet Revenue undefined Forecast, by Types 2020 & 2033
- Table 76: Global Carbonate Bath Tablet Volume K Forecast, by Types 2020 & 2033
- Table 77: Global Carbonate Bath Tablet Revenue undefined Forecast, by Country 2020 & 2033
- Table 78: Global Carbonate Bath Tablet Volume K Forecast, by Country 2020 & 2033
- Table 79: China Carbonate Bath Tablet Revenue (undefined) Forecast, by Application 2020 & 2033
- Table 80: China Carbonate Bath Tablet Volume (K) Forecast, by Application 2020 & 2033
- Table 81: India Carbonate Bath Tablet Revenue (undefined) Forecast, by Application 2020 & 2033
- Table 82: India Carbonate Bath Tablet Volume (K) Forecast, by Application 2020 & 2033
- Table 83: Japan Carbonate Bath Tablet Revenue (undefined) Forecast, by Application 2020 & 2033
- Table 84: Japan Carbonate Bath Tablet Volume (K) Forecast, by Application 2020 & 2033
- Table 85: South Korea Carbonate Bath Tablet Revenue (undefined) Forecast, by Application 2020 & 2033
- Table 86: South Korea Carbonate Bath Tablet Volume (K) Forecast, by Application 2020 & 2033
- Table 87: ASEAN Carbonate Bath Tablet Revenue (undefined) Forecast, by Application 2020 & 2033
- Table 88: ASEAN Carbonate Bath Tablet Volume (K) Forecast, by Application 2020 & 2033
- Table 89: Oceania Carbonate Bath Tablet Revenue (undefined) Forecast, by Application 2020 & 2033
- Table 90: Oceania Carbonate Bath Tablet Volume (K) Forecast, by Application 2020 & 2033
- Table 91: Rest of Asia Pacific Carbonate Bath Tablet Revenue (undefined) Forecast, by Application 2020 & 2033
- Table 92: Rest of Asia Pacific Carbonate Bath Tablet Volume (K) Forecast, by Application 2020 & 2033
Frequently Asked Questions
1. What is the projected Compound Annual Growth Rate (CAGR) of the Carbonate Bath Tablet?
The projected CAGR is approximately 5.8%.
2. Which companies are prominent players in the Carbonate Bath Tablet?
Key companies in the market include Goshu, Barth Recovery & Treatment, Earth Corporation, Muji, Kao, Aratel Group, Nutra Solution, Holos, Nagayu.
3. What are the main segments of the Carbonate Bath Tablet?
The market segments include Application, Types.
4. Can you provide details about the market size?
The market size is estimated to be USD XXX N/A as of 2022.
5. What are some drivers contributing to market growth?
N/A
6. What are the notable trends driving market growth?
N/A
7. Are there any restraints impacting market growth?
N/A
8. Can you provide examples of recent developments in the market?
N/A
9. What pricing options are available for accessing the report?
Pricing options include single-user, multi-user, and enterprise licenses priced at USD 4350.00, USD 6525.00, and USD 8700.00 respectively.
10. Is the market size provided in terms of value or volume?
The market size is provided in terms of value, measured in N/A and volume, measured in K.
11. Are there any specific market keywords associated with the report?
Yes, the market keyword associated with the report is "Carbonate Bath Tablet," which aids in identifying and referencing the specific market segment covered.
12. How do I determine which pricing option suits my needs best?
The pricing options vary based on user requirements and access needs. Individual users may opt for single-user licenses, while businesses requiring broader access may choose multi-user or enterprise licenses for cost-effective access to the report.
13. Are there any additional resources or data provided in the Carbonate Bath Tablet report?
While the report offers comprehensive insights, it's advisable to review the specific contents or supplementary materials provided to ascertain if additional resources or data are available.
14. How can I stay updated on further developments or reports in the Carbonate Bath Tablet?
To stay informed about further developments, trends, and reports in the Carbonate Bath Tablet, consider subscribing to industry newsletters, following relevant companies and organizations, or regularly checking reputable industry news sources and publications.
Methodology
Step 1 - Identification of Relevant Samples Size from Population Database


Step 2 - Approaches for Defining Global Market Size (Value, Volume* & Price*)

Note*: In applicable scenarios
Step 3 - Data Sources
Primary Research
- Web Analytics
- Survey Reports
- Research Institute
- Latest Research Reports
- Opinion Leaders
Secondary Research
- Annual Reports
- White Paper
- Latest Press Release
- Industry Association
- Paid Database
- Investor Presentations

Step 4 - Data Triangulation
Involves using different sources of information in order to increase the validity of a study
These sources are likely to be stakeholders in a program - participants, other researchers, program staff, other community members, and so on.
Then we put all data in single framework & apply various statistical tools to find out the dynamic on the market.
During the analysis stage, feedback from the stakeholder groups would be compared to determine areas of agreement as well as areas of divergence