Key Insights
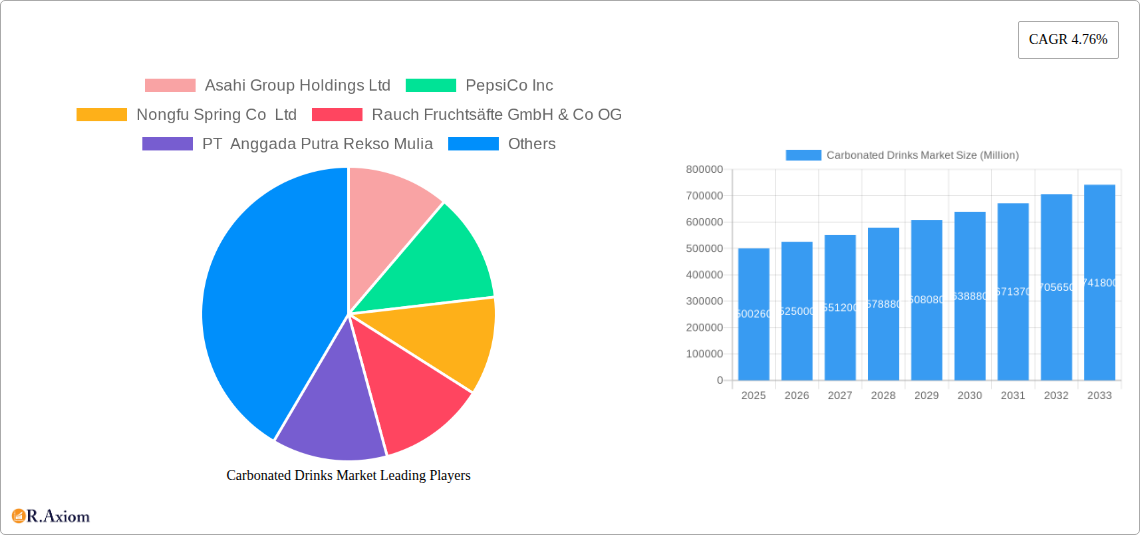
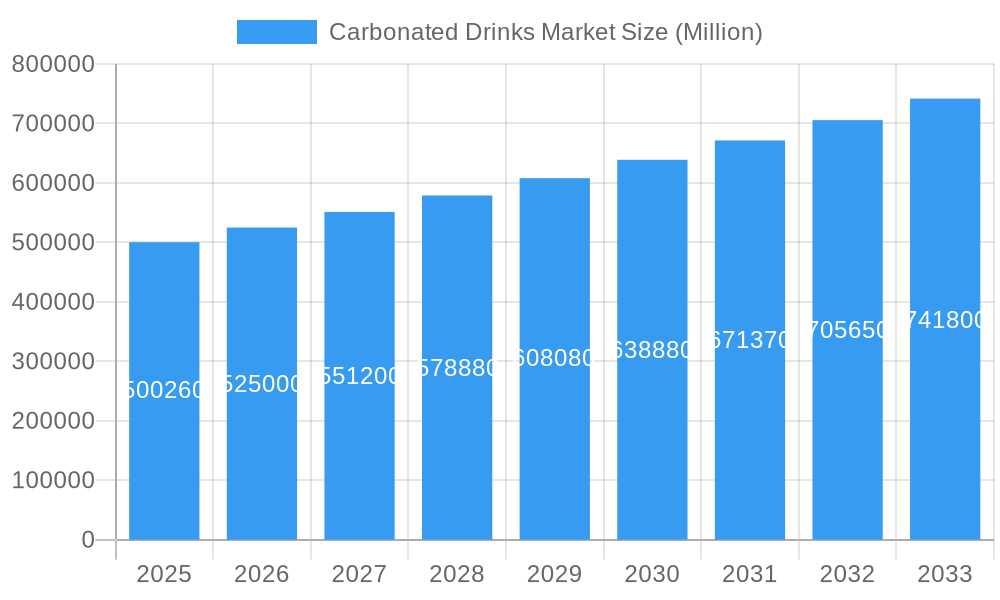
The global carbonated drinks market, valued at $500.26 billion in 2025, is projected to experience robust growth, driven by several key factors. The rising disposable incomes in emerging economies, particularly in Asia-Pacific, are fueling increased consumption of these beverages. Furthermore, continuous innovation in flavors and packaging, such as the introduction of healthier, low-sugar options and eco-friendly alternatives to plastic bottles, is attracting a broader consumer base. The dominance of established players like Coca-Cola and PepsiCo is challenged by the rise of regional brands and private labels, creating a dynamic competitive landscape. While health concerns surrounding sugar consumption pose a significant restraint, the industry is actively adapting by offering diverse product portfolios catering to evolving consumer preferences. Growth is segmented across various product types, with diet cola and fruit-flavored carbonates experiencing faster growth than standard cola, reflecting a global shift towards healthier choices. Distribution channels are also diversifying, with e-commerce platforms gaining traction alongside traditional retail outlets. The on-trade segment (restaurants, bars) is expected to recover post-pandemic, contributing to overall market expansion. Geographical variations in growth are also anticipated, with developing nations exhibiting higher growth rates compared to mature markets. The market's future hinges on the industry's ability to balance consumer demand for healthier, sustainable options with the need to maintain affordability and accessibility.
Carbonated Drinks Market Market Size (In Billion)
The forecast period (2025-2033) anticipates a continued upward trajectory, with a Compound Annual Growth Rate (CAGR) of 4.76%. This growth will be influenced by factors like targeted marketing campaigns, product diversification strategies, and strategic partnerships fostering wider distribution networks. However, regulatory pressures concerning sugar content and environmental concerns related to packaging materials will necessitate strategic adaptations. Companies are investing heavily in research and development to create innovative products that appeal to health-conscious consumers while retaining the taste and fizz that characterize carbonated drinks. The competitive landscape remains highly concentrated, with major players focused on expanding their market share through mergers, acquisitions, and product launches. Regional differences in regulatory frameworks and consumer preferences will continue to shape the market's trajectory throughout the forecast period.
Carbonated Drinks Market Company Market Share
Carbonated Drinks Market: A Comprehensive Report (2019-2033)
This in-depth report provides a comprehensive analysis of the global carbonated drinks market, covering the period from 2019 to 2033. With a focus on key industry trends, competitive dynamics, and future growth prospects, this report is an essential resource for industry stakeholders, investors, and market researchers seeking actionable insights. The report incorporates extensive data analysis, detailed segmentations, and profiles of leading players, offering a 360-degree view of this dynamic market. The base year for this report is 2025, with estimations provided for 2025 and a forecast period spanning 2025-2033.
Carbonated Drinks Market Concentration & Innovation
This section delves into the competitive landscape of the carbonated drinks market, analyzing market concentration, innovation drivers, regulatory frameworks, and key industry activities. The report examines the market share held by major players such as The Coca-Cola Company, PepsiCo Inc., and Asahi Group Holdings Ltd., assessing their strategic moves and competitive positioning. Furthermore, the analysis includes an evaluation of M&A activities, including deal values and their impact on market consolidation. The report identifies key innovation drivers such as consumer demand for healthier options (e.g., sugar-free and low-calorie drinks), sustainable packaging solutions, and technological advancements in flavor creation and production processes. The impact of regulatory frameworks on product formulations, labeling, and marketing is also critically examined. Substitution from other beverage categories, such as bottled water and functional beverages, is analyzed, together with end-user trends, shifting consumption patterns, and evolving preferences. The analysis incorporates market share data and a review of recent M&A deals, with total deal values estimated at xx Million during the study period.
Carbonated Drinks Market Industry Trends & Insights
This section offers a detailed analysis of prevailing trends and insights shaping the carbonated drinks market. The report explores market growth drivers, focusing on factors such as increasing disposable incomes, urbanization, and changing lifestyle patterns in emerging economies. Technological disruptions, such as the adoption of advanced manufacturing techniques and personalized beverage offerings, are analyzed for their impact on market dynamics. The report examines shifts in consumer preferences, with a focus on the rising demand for healthier options, including low-sugar and functional carbonated drinks. It explores the changing competitive landscape, including the emergence of new players and intensified competition among established brands. The report also presents key market metrics, including the Compound Annual Growth Rate (CAGR) and market penetration rates for different segments and regions. The predicted CAGR for the forecast period is xx%. Market penetration for various segments will be detailed within the report.
Dominant Markets & Segments in Carbonated Drinks Market
This section identifies the leading regions, countries, and segments within the carbonated drinks market. The analysis will delve into the factors contributing to the dominance of particular markets, regions, and segments.
Key Drivers:
- Economic Policies: Government regulations on taxation and trade impacting the market.
- Infrastructure: Availability of effective distribution channels and retail networks.
- Consumer Preferences: Local tastes and preferences shaping product demand.
- Cultural Factors: Traditional consumption patterns influencing market dynamics.
Dominance analysis will include detailed examination of:
- Others: On-trade: This segment's success depends on factors like restaurant density, tourism, and economic activity in key areas.
- Soft Drink Type: The standard cola segment’s dominance is challenged by the increasing popularity of fruit-flavored carbonates and diet colas, driven by health-consciousness. Market share for Diet Cola, Fruit Flavored Carbonates, and Standard Cola will be comprehensively analyzed.
- Packaging Type: The report will analyze the relative market shares of Disposable Cups, Glass Bottles, Metal Cans, and PET Bottles, considering factors such as cost, convenience, environmental concerns, and recyclability.
- Distribution Channel: The off-trade channel (e.g., supermarkets, convenience stores) holds the greater market share compared to the on-trade channel (restaurants, bars).
Carbonated Drinks Market Product Developments
This section summarizes recent product innovations, applications, and competitive advantages in the carbonated drinks market. The report highlights technological trends such as the use of artificial intelligence in flavor development (as seen with Coca-Cola Y3000), and the growing emphasis on natural ingredients and sustainable packaging. The analysis will assess how these developments are shaping the market and creating new opportunities for companies to differentiate their offerings. The focus will be on the market fit of these innovations and their competitive advantages.
Report Scope & Segmentation Analysis
This report comprehensively segments the carbonated drinks market across several parameters. The segments include Soft Drink Type (Diet Cola, Fruit Flavored Carbonates, Standard Cola, Other Types), Packaging Type (Disposable Cups, Glass Bottles, Metal Can, PET Bottles), and Distribution Channel (Off-trade, On-trade). Each segment’s analysis will include growth projections, market size (in Million), and a competitive landscape overview. The report projects xx Million growth in the total market size from 2025 to 2033.
Key Drivers of Carbonated Drinks Market Growth
The growth of the carbonated drinks market is propelled by several key factors. The rising disposable incomes in developing countries, coupled with increasing urbanization and changing lifestyles, are leading to higher consumption. Technological advancements in flavor creation, packaging, and production processes are enhancing the appeal and availability of carbonated drinks. Favorable regulatory environments in some regions also contribute to market expansion.
Challenges in the Carbonated Drinks Market Sector
The carbonated drinks market faces several challenges, including increasing health consciousness among consumers, leading to reduced demand for sugary drinks. Stringent regulations concerning sugar content and labeling are impacting product formulations and marketing strategies. Supply chain disruptions and price fluctuations in raw materials also pose significant challenges. Intense competition among established brands and the emergence of new players are further complicating market dynamics, impacting profit margins.
Emerging Opportunities in Carbonated Drinks Market
Despite challenges, significant opportunities exist within the carbonated drinks market. The growing demand for healthier options presents an opportunity for companies to innovate with low-sugar, natural, and functional carbonated drinks. Emerging markets in developing countries offer substantial growth potential. The development of sustainable packaging solutions and eco-friendly production processes is gaining traction, aligning with growing environmental concerns among consumers.
Leading Players in the Carbonated Drinks Market Market
- Asahi Group Holdings Ltd
- PepsiCo Inc
- Nongfu Spring Co Ltd
- Rauch Fruchtsäfte GmbH & Co OG
- PT Anggada Putra Rekso Mulia
- Suntory Holdings Limited
- Keurig Dr Pepper Inc
- National Beverage Corp
- Refresco Group BV
- The Coca-Cola Company
- Hangzhou Wahaha Group Co Ltd
- Kirin Holdings Company Limited
- Britvic PLC
- Tingyi (Cayman Islands) Holding Corporatio
- Thai Beverages PCL
Key Developments in Carbonated Drinks Market Industry
- January 2023: PepsiCo Inc. launched Starry, a lemon-lime flavored soda in regular and zero-sugar versions. This launch reflects the growing demand for healthier options within the carbonated drinks market.
- October 2023: Coca-Cola launched Coca-Cola Y3000, an AI-created limited-edition flavor. This highlights the innovative use of technology in flavor development and the potential to attract younger consumers.
- December 2023: Kirin launched Tokusei Ginger Ale Sour and sugar-free tea products in Japan, responding to increased health consciousness. The limited availability in Japan reflects a focused marketing strategy within a specific regional market.
Strategic Outlook for Carbonated Drinks Market Market
The future of the carbonated drinks market is shaped by evolving consumer preferences towards healthier options and sustainable practices. Companies focusing on innovation in product formulations, sustainable packaging, and targeted marketing strategies are expected to gain a competitive advantage. Emerging markets and technological advancements continue to present significant growth opportunities. The market is predicted to witness sustained growth over the forecast period, driven by these factors.
Carbonated Drinks Market Segmentation
-
1. Soft Drink Type
- 1.1. Diet Cola
- 1.2. Fruit Flavored Carbonates
- 1.3. Standard Cola
- 1.4. Other Types
-
2. Packaging Type
- 2.1. Disposable Cups
- 2.2. Glass Bottles
- 2.3. Metal Can
- 2.4. PET Bottles
-
3. Distribution Channel
-
3.1. Off-trade
- 3.1.1. Convenience Stores
- 3.1.2. Online Retail
- 3.1.3. Supermarket/Hypermarket
- 3.1.4. Others
- 3.2. On-trade
-
3.1. Off-trade
Carbonated Drinks Market Segmentation By Geography
-
1. North America
- 1.1. United States
- 1.2. Canada
- 1.3. Mexico
-
2. South America
- 2.1. Brazil
- 2.2. Argentina
- 2.3. Rest of South America
-
3. Europe
- 3.1. United Kingdom
- 3.2. Germany
- 3.3. France
- 3.4. Italy
- 3.5. Spain
- 3.6. Russia
- 3.7. Benelux
- 3.8. Nordics
- 3.9. Rest of Europe
-
4. Middle East & Africa
- 4.1. Turkey
- 4.2. Israel
- 4.3. GCC
- 4.4. North Africa
- 4.5. South Africa
- 4.6. Rest of Middle East & Africa
-
5. Asia Pacific
- 5.1. China
- 5.2. India
- 5.3. Japan
- 5.4. South Korea
- 5.5. ASEAN
- 5.6. Oceania
- 5.7. Rest of Asia Pacific
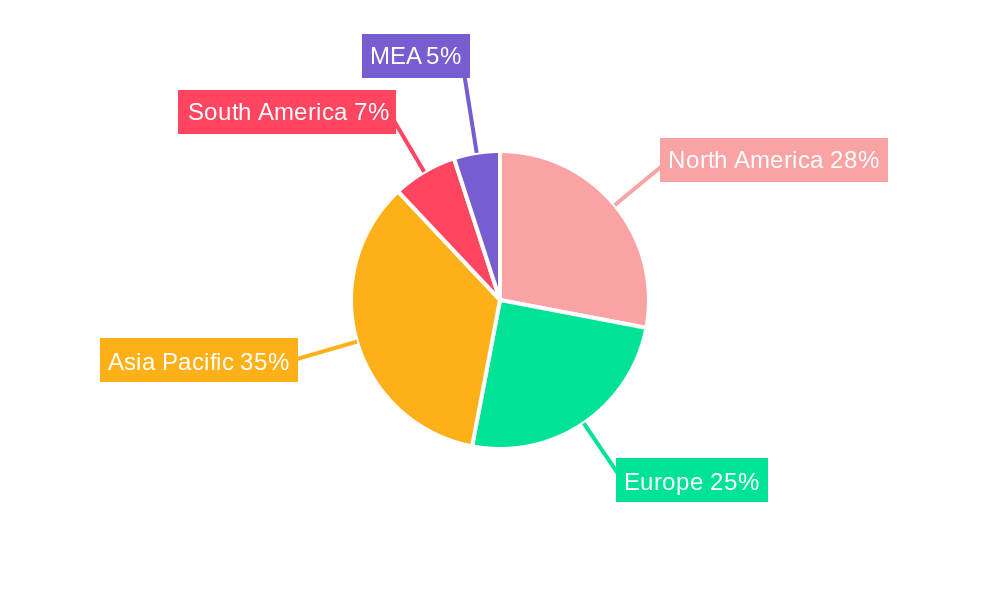
Carbonated Drinks Market Regional Market Share
Geographic Coverage of Carbonated Drinks Market
Carbonated Drinks Market REPORT HIGHLIGHTS
| Aspects | Details |
|---|---|
| Study Period | 2020-2034 |
| Base Year | 2025 |
| Estimated Year | 2026 |
| Forecast Period | 2026-2034 |
| Historical Period | 2020-2025 |
| Growth Rate | CAGR of 4.76% from 2020-2034 |
| Segmentation |
|
Table of Contents
- 1. Introduction
- 1.1. Research Scope
- 1.2. Market Segmentation
- 1.3. Research Objective
- 1.4. Definitions and Assumptions
- 2. Executive Summary
- 2.1. Market Snapshot
- 3. Market Dynamics
- 3.1. Market Drivers
- 3.2. Market Restrains
- 3.3. Market Trends
- 3.4. Market Opportunities
- 4. Market Factor Analysis
- 4.1. Porters Five Forces
- 4.1.1. Bargaining Power of Suppliers
- 4.1.2. Bargaining Power of Buyers
- 4.1.3. Threat of New Entrants
- 4.1.4. Threat of Substitutes
- 4.1.5. Competitive Rivalry
- 4.2. PESTEL analysis
- 4.3. BCG Analysis
- 4.3.1. Stars (High Growth, High Market Share)
- 4.3.2. Cash Cows (Low Growth, High Market Share)
- 4.3.3. Question Mark (High Growth, Low Market Share)
- 4.3.4. Dogs (Low Growth, Low Market Share)
- 4.4. Ansoff Matrix Analysis
- 4.5. Supply Chain Analysis
- 4.6. Regulatory Landscape
- 4.7. Current Market Potential and Opportunity Assessment (TAM–SAM–SOM Framework)
- 4.8. RAX Analyst Note
- 4.1. Porters Five Forces
- 5. Market Analysis, Insights and Forecast 2021-2033
- 5.1. Market Analysis, Insights and Forecast - by Soft Drink Type
- 5.1.1. Diet Cola
- 5.1.2. Fruit Flavored Carbonates
- 5.1.3. Standard Cola
- 5.1.4. Other Types
- 5.2. Market Analysis, Insights and Forecast - by Packaging Type
- 5.2.1. Disposable Cups
- 5.2.2. Glass Bottles
- 5.2.3. Metal Can
- 5.2.4. PET Bottles
- 5.3. Market Analysis, Insights and Forecast - by Distribution Channel
- 5.3.1. Off-trade
- 5.3.1.1. Convenience Stores
- 5.3.1.2. Online Retail
- 5.3.1.3. Supermarket/Hypermarket
- 5.3.1.4. Others
- 5.3.2. On-trade
- 5.3.1. Off-trade
- 5.4. Market Analysis, Insights and Forecast - by Region
- 5.4.1. North America
- 5.4.2. South America
- 5.4.3. Europe
- 5.4.4. Middle East & Africa
- 5.4.5. Asia Pacific
- 5.1. Market Analysis, Insights and Forecast - by Soft Drink Type
- 6. Global Carbonated Drinks Market Analysis, Insights and Forecast, 2021-2033
- 6.1. Market Analysis, Insights and Forecast - by Soft Drink Type
- 6.1.1. Diet Cola
- 6.1.2. Fruit Flavored Carbonates
- 6.1.3. Standard Cola
- 6.1.4. Other Types
- 6.2. Market Analysis, Insights and Forecast - by Packaging Type
- 6.2.1. Disposable Cups
- 6.2.2. Glass Bottles
- 6.2.3. Metal Can
- 6.2.4. PET Bottles
- 6.3. Market Analysis, Insights and Forecast - by Distribution Channel
- 6.3.1. Off-trade
- 6.3.1.1. Convenience Stores
- 6.3.1.2. Online Retail
- 6.3.1.3. Supermarket/Hypermarket
- 6.3.1.4. Others
- 6.3.2. On-trade
- 6.3.1. Off-trade
- 6.1. Market Analysis, Insights and Forecast - by Soft Drink Type
- 7. North America Carbonated Drinks Market Analysis, Insights and Forecast, 2020-2032
- 7.1. Market Analysis, Insights and Forecast - by Soft Drink Type
- 7.1.1. Diet Cola
- 7.1.2. Fruit Flavored Carbonates
- 7.1.3. Standard Cola
- 7.1.4. Other Types
- 7.2. Market Analysis, Insights and Forecast - by Packaging Type
- 7.2.1. Disposable Cups
- 7.2.2. Glass Bottles
- 7.2.3. Metal Can
- 7.2.4. PET Bottles
- 7.3. Market Analysis, Insights and Forecast - by Distribution Channel
- 7.3.1. Off-trade
- 7.3.1.1. Convenience Stores
- 7.3.1.2. Online Retail
- 7.3.1.3. Supermarket/Hypermarket
- 7.3.1.4. Others
- 7.3.2. On-trade
- 7.3.1. Off-trade
- 7.1. Market Analysis, Insights and Forecast - by Soft Drink Type
- 8. South America Carbonated Drinks Market Analysis, Insights and Forecast, 2020-2032
- 8.1. Market Analysis, Insights and Forecast - by Soft Drink Type
- 8.1.1. Diet Cola
- 8.1.2. Fruit Flavored Carbonates
- 8.1.3. Standard Cola
- 8.1.4. Other Types
- 8.2. Market Analysis, Insights and Forecast - by Packaging Type
- 8.2.1. Disposable Cups
- 8.2.2. Glass Bottles
- 8.2.3. Metal Can
- 8.2.4. PET Bottles
- 8.3. Market Analysis, Insights and Forecast - by Distribution Channel
- 8.3.1. Off-trade
- 8.3.1.1. Convenience Stores
- 8.3.1.2. Online Retail
- 8.3.1.3. Supermarket/Hypermarket
- 8.3.1.4. Others
- 8.3.2. On-trade
- 8.3.1. Off-trade
- 8.1. Market Analysis, Insights and Forecast - by Soft Drink Type
- 9. Europe Carbonated Drinks Market Analysis, Insights and Forecast, 2020-2032
- 9.1. Market Analysis, Insights and Forecast - by Soft Drink Type
- 9.1.1. Diet Cola
- 9.1.2. Fruit Flavored Carbonates
- 9.1.3. Standard Cola
- 9.1.4. Other Types
- 9.2. Market Analysis, Insights and Forecast - by Packaging Type
- 9.2.1. Disposable Cups
- 9.2.2. Glass Bottles
- 9.2.3. Metal Can
- 9.2.4. PET Bottles
- 9.3. Market Analysis, Insights and Forecast - by Distribution Channel
- 9.3.1. Off-trade
- 9.3.1.1. Convenience Stores
- 9.3.1.2. Online Retail
- 9.3.1.3. Supermarket/Hypermarket
- 9.3.1.4. Others
- 9.3.2. On-trade
- 9.3.1. Off-trade
- 9.1. Market Analysis, Insights and Forecast - by Soft Drink Type
- 10. Middle East & Africa Carbonated Drinks Market Analysis, Insights and Forecast, 2020-2032
- 10.1. Market Analysis, Insights and Forecast - by Soft Drink Type
- 10.1.1. Diet Cola
- 10.1.2. Fruit Flavored Carbonates
- 10.1.3. Standard Cola
- 10.1.4. Other Types
- 10.2. Market Analysis, Insights and Forecast - by Packaging Type
- 10.2.1. Disposable Cups
- 10.2.2. Glass Bottles
- 10.2.3. Metal Can
- 10.2.4. PET Bottles
- 10.3. Market Analysis, Insights and Forecast - by Distribution Channel
- 10.3.1. Off-trade
- 10.3.1.1. Convenience Stores
- 10.3.1.2. Online Retail
- 10.3.1.3. Supermarket/Hypermarket
- 10.3.1.4. Others
- 10.3.2. On-trade
- 10.3.1. Off-trade
- 10.1. Market Analysis, Insights and Forecast - by Soft Drink Type
- 11. Asia Pacific Carbonated Drinks Market Analysis, Insights and Forecast, 2020-2032
- 11.1. Market Analysis, Insights and Forecast - by Soft Drink Type
- 11.1.1. Diet Cola
- 11.1.2. Fruit Flavored Carbonates
- 11.1.3. Standard Cola
- 11.1.4. Other Types
- 11.2. Market Analysis, Insights and Forecast - by Packaging Type
- 11.2.1. Disposable Cups
- 11.2.2. Glass Bottles
- 11.2.3. Metal Can
- 11.2.4. PET Bottles
- 11.3. Market Analysis, Insights and Forecast - by Distribution Channel
- 11.3.1. Off-trade
- 11.3.1.1. Convenience Stores
- 11.3.1.2. Online Retail
- 11.3.1.3. Supermarket/Hypermarket
- 11.3.1.4. Others
- 11.3.2. On-trade
- 11.3.1. Off-trade
- 11.1. Market Analysis, Insights and Forecast - by Soft Drink Type
- 12. Competitive Analysis
- 12.1. Company Profiles
- 12.1.1 Asahi Group Holdings Ltd
- 12.1.1.1. Company Overview
- 12.1.1.2. Products
- 12.1.1.3. Company Financials
- 12.1.1.4. SWOT Analysis
- 12.1.2 PepsiCo Inc
- 12.1.2.1. Company Overview
- 12.1.2.2. Products
- 12.1.2.3. Company Financials
- 12.1.2.4. SWOT Analysis
- 12.1.3 Nongfu Spring Co Ltd
- 12.1.3.1. Company Overview
- 12.1.3.2. Products
- 12.1.3.3. Company Financials
- 12.1.3.4. SWOT Analysis
- 12.1.4 Rauch Fruchtsäfte GmbH & Co OG
- 12.1.4.1. Company Overview
- 12.1.4.2. Products
- 12.1.4.3. Company Financials
- 12.1.4.4. SWOT Analysis
- 12.1.5 PT Anggada Putra Rekso Mulia
- 12.1.5.1. Company Overview
- 12.1.5.2. Products
- 12.1.5.3. Company Financials
- 12.1.5.4. SWOT Analysis
- 12.1.6 Suntory Holdings Limited
- 12.1.6.1. Company Overview
- 12.1.6.2. Products
- 12.1.6.3. Company Financials
- 12.1.6.4. SWOT Analysis
- 12.1.7 Keurig Dr Pepper Inc
- 12.1.7.1. Company Overview
- 12.1.7.2. Products
- 12.1.7.3. Company Financials
- 12.1.7.4. SWOT Analysis
- 12.1.8 National Beverage Corp
- 12.1.8.1. Company Overview
- 12.1.8.2. Products
- 12.1.8.3. Company Financials
- 12.1.8.4. SWOT Analysis
- 12.1.9 Refresco Group BV
- 12.1.9.1. Company Overview
- 12.1.9.2. Products
- 12.1.9.3. Company Financials
- 12.1.9.4. SWOT Analysis
- 12.1.10 The Coca-Cola Company
- 12.1.10.1. Company Overview
- 12.1.10.2. Products
- 12.1.10.3. Company Financials
- 12.1.10.4. SWOT Analysis
- 12.1.11 Hangzhou Wahaha Group Co Ltd
- 12.1.11.1. Company Overview
- 12.1.11.2. Products
- 12.1.11.3. Company Financials
- 12.1.11.4. SWOT Analysis
- 12.1.12 Kirin Holdings Company Limited
- 12.1.12.1. Company Overview
- 12.1.12.2. Products
- 12.1.12.3. Company Financials
- 12.1.12.4. SWOT Analysis
- 12.1.13 Britvic PLC
- 12.1.13.1. Company Overview
- 12.1.13.2. Products
- 12.1.13.3. Company Financials
- 12.1.13.4. SWOT Analysis
- 12.1.14 Tingyi (Cayman Islands) Holding Corporatio
- 12.1.14.1. Company Overview
- 12.1.14.2. Products
- 12.1.14.3. Company Financials
- 12.1.14.4. SWOT Analysis
- 12.1.15 Thai Beverages PCL
- 12.1.15.1. Company Overview
- 12.1.15.2. Products
- 12.1.15.3. Company Financials
- 12.1.15.4. SWOT Analysis
- 12.1.1 Asahi Group Holdings Ltd
- 12.2. Market Entropy
- 12.2.1 Company's Key Areas Served
- 12.2.2 Recent Developments
- 12.3. Company Market Share Analysis 2025
- 12.3.1 Top 5 Companies Market Share Analysis
- 12.3.2 Top 3 Companies Market Share Analysis
- 12.4. List of Potential Customers
- 13. Research Methodology
List of Figures
- Figure 1: Global Carbonated Drinks Market Revenue Breakdown (Million, %) by Region 2025 & 2033
- Figure 2: Global Carbonated Drinks Market Volume Breakdown (liter , %) by Region 2025 & 2033
- Figure 3: North America Carbonated Drinks Market Revenue (Million), by Soft Drink Type 2025 & 2033
- Figure 4: North America Carbonated Drinks Market Volume (liter ), by Soft Drink Type 2025 & 2033
- Figure 5: North America Carbonated Drinks Market Revenue Share (%), by Soft Drink Type 2025 & 2033
- Figure 6: North America Carbonated Drinks Market Volume Share (%), by Soft Drink Type 2025 & 2033
- Figure 7: North America Carbonated Drinks Market Revenue (Million), by Packaging Type 2025 & 2033
- Figure 8: North America Carbonated Drinks Market Volume (liter ), by Packaging Type 2025 & 2033
- Figure 9: North America Carbonated Drinks Market Revenue Share (%), by Packaging Type 2025 & 2033
- Figure 10: North America Carbonated Drinks Market Volume Share (%), by Packaging Type 2025 & 2033
- Figure 11: North America Carbonated Drinks Market Revenue (Million), by Distribution Channel 2025 & 2033
- Figure 12: North America Carbonated Drinks Market Volume (liter ), by Distribution Channel 2025 & 2033
- Figure 13: North America Carbonated Drinks Market Revenue Share (%), by Distribution Channel 2025 & 2033
- Figure 14: North America Carbonated Drinks Market Volume Share (%), by Distribution Channel 2025 & 2033
- Figure 15: North America Carbonated Drinks Market Revenue (Million), by Country 2025 & 2033
- Figure 16: North America Carbonated Drinks Market Volume (liter ), by Country 2025 & 2033
- Figure 17: North America Carbonated Drinks Market Revenue Share (%), by Country 2025 & 2033
- Figure 18: North America Carbonated Drinks Market Volume Share (%), by Country 2025 & 2033
- Figure 19: South America Carbonated Drinks Market Revenue (Million), by Soft Drink Type 2025 & 2033
- Figure 20: South America Carbonated Drinks Market Volume (liter ), by Soft Drink Type 2025 & 2033
- Figure 21: South America Carbonated Drinks Market Revenue Share (%), by Soft Drink Type 2025 & 2033
- Figure 22: South America Carbonated Drinks Market Volume Share (%), by Soft Drink Type 2025 & 2033
- Figure 23: South America Carbonated Drinks Market Revenue (Million), by Packaging Type 2025 & 2033
- Figure 24: South America Carbonated Drinks Market Volume (liter ), by Packaging Type 2025 & 2033
- Figure 25: South America Carbonated Drinks Market Revenue Share (%), by Packaging Type 2025 & 2033
- Figure 26: South America Carbonated Drinks Market Volume Share (%), by Packaging Type 2025 & 2033
- Figure 27: South America Carbonated Drinks Market Revenue (Million), by Distribution Channel 2025 & 2033
- Figure 28: South America Carbonated Drinks Market Volume (liter ), by Distribution Channel 2025 & 2033
- Figure 29: South America Carbonated Drinks Market Revenue Share (%), by Distribution Channel 2025 & 2033
- Figure 30: South America Carbonated Drinks Market Volume Share (%), by Distribution Channel 2025 & 2033
- Figure 31: South America Carbonated Drinks Market Revenue (Million), by Country 2025 & 2033
- Figure 32: South America Carbonated Drinks Market Volume (liter ), by Country 2025 & 2033
- Figure 33: South America Carbonated Drinks Market Revenue Share (%), by Country 2025 & 2033
- Figure 34: South America Carbonated Drinks Market Volume Share (%), by Country 2025 & 2033
- Figure 35: Europe Carbonated Drinks Market Revenue (Million), by Soft Drink Type 2025 & 2033
- Figure 36: Europe Carbonated Drinks Market Volume (liter ), by Soft Drink Type 2025 & 2033
- Figure 37: Europe Carbonated Drinks Market Revenue Share (%), by Soft Drink Type 2025 & 2033
- Figure 38: Europe Carbonated Drinks Market Volume Share (%), by Soft Drink Type 2025 & 2033
- Figure 39: Europe Carbonated Drinks Market Revenue (Million), by Packaging Type 2025 & 2033
- Figure 40: Europe Carbonated Drinks Market Volume (liter ), by Packaging Type 2025 & 2033
- Figure 41: Europe Carbonated Drinks Market Revenue Share (%), by Packaging Type 2025 & 2033
- Figure 42: Europe Carbonated Drinks Market Volume Share (%), by Packaging Type 2025 & 2033
- Figure 43: Europe Carbonated Drinks Market Revenue (Million), by Distribution Channel 2025 & 2033
- Figure 44: Europe Carbonated Drinks Market Volume (liter ), by Distribution Channel 2025 & 2033
- Figure 45: Europe Carbonated Drinks Market Revenue Share (%), by Distribution Channel 2025 & 2033
- Figure 46: Europe Carbonated Drinks Market Volume Share (%), by Distribution Channel 2025 & 2033
- Figure 47: Europe Carbonated Drinks Market Revenue (Million), by Country 2025 & 2033
- Figure 48: Europe Carbonated Drinks Market Volume (liter ), by Country 2025 & 2033
- Figure 49: Europe Carbonated Drinks Market Revenue Share (%), by Country 2025 & 2033
- Figure 50: Europe Carbonated Drinks Market Volume Share (%), by Country 2025 & 2033
- Figure 51: Middle East & Africa Carbonated Drinks Market Revenue (Million), by Soft Drink Type 2025 & 2033
- Figure 52: Middle East & Africa Carbonated Drinks Market Volume (liter ), by Soft Drink Type 2025 & 2033
- Figure 53: Middle East & Africa Carbonated Drinks Market Revenue Share (%), by Soft Drink Type 2025 & 2033
- Figure 54: Middle East & Africa Carbonated Drinks Market Volume Share (%), by Soft Drink Type 2025 & 2033
- Figure 55: Middle East & Africa Carbonated Drinks Market Revenue (Million), by Packaging Type 2025 & 2033
- Figure 56: Middle East & Africa Carbonated Drinks Market Volume (liter ), by Packaging Type 2025 & 2033
- Figure 57: Middle East & Africa Carbonated Drinks Market Revenue Share (%), by Packaging Type 2025 & 2033
- Figure 58: Middle East & Africa Carbonated Drinks Market Volume Share (%), by Packaging Type 2025 & 2033
- Figure 59: Middle East & Africa Carbonated Drinks Market Revenue (Million), by Distribution Channel 2025 & 2033
- Figure 60: Middle East & Africa Carbonated Drinks Market Volume (liter ), by Distribution Channel 2025 & 2033
- Figure 61: Middle East & Africa Carbonated Drinks Market Revenue Share (%), by Distribution Channel 2025 & 2033
- Figure 62: Middle East & Africa Carbonated Drinks Market Volume Share (%), by Distribution Channel 2025 & 2033
- Figure 63: Middle East & Africa Carbonated Drinks Market Revenue (Million), by Country 2025 & 2033
- Figure 64: Middle East & Africa Carbonated Drinks Market Volume (liter ), by Country 2025 & 2033
- Figure 65: Middle East & Africa Carbonated Drinks Market Revenue Share (%), by Country 2025 & 2033
- Figure 66: Middle East & Africa Carbonated Drinks Market Volume Share (%), by Country 2025 & 2033
- Figure 67: Asia Pacific Carbonated Drinks Market Revenue (Million), by Soft Drink Type 2025 & 2033
- Figure 68: Asia Pacific Carbonated Drinks Market Volume (liter ), by Soft Drink Type 2025 & 2033
- Figure 69: Asia Pacific Carbonated Drinks Market Revenue Share (%), by Soft Drink Type 2025 & 2033
- Figure 70: Asia Pacific Carbonated Drinks Market Volume Share (%), by Soft Drink Type 2025 & 2033
- Figure 71: Asia Pacific Carbonated Drinks Market Revenue (Million), by Packaging Type 2025 & 2033
- Figure 72: Asia Pacific Carbonated Drinks Market Volume (liter ), by Packaging Type 2025 & 2033
- Figure 73: Asia Pacific Carbonated Drinks Market Revenue Share (%), by Packaging Type 2025 & 2033
- Figure 74: Asia Pacific Carbonated Drinks Market Volume Share (%), by Packaging Type 2025 & 2033
- Figure 75: Asia Pacific Carbonated Drinks Market Revenue (Million), by Distribution Channel 2025 & 2033
- Figure 76: Asia Pacific Carbonated Drinks Market Volume (liter ), by Distribution Channel 2025 & 2033
- Figure 77: Asia Pacific Carbonated Drinks Market Revenue Share (%), by Distribution Channel 2025 & 2033
- Figure 78: Asia Pacific Carbonated Drinks Market Volume Share (%), by Distribution Channel 2025 & 2033
- Figure 79: Asia Pacific Carbonated Drinks Market Revenue (Million), by Country 2025 & 2033
- Figure 80: Asia Pacific Carbonated Drinks Market Volume (liter ), by Country 2025 & 2033
- Figure 81: Asia Pacific Carbonated Drinks Market Revenue Share (%), by Country 2025 & 2033
- Figure 82: Asia Pacific Carbonated Drinks Market Volume Share (%), by Country 2025 & 2033
List of Tables
- Table 1: Global Carbonated Drinks Market Revenue Million Forecast, by Soft Drink Type 2020 & 2033
- Table 2: Global Carbonated Drinks Market Volume liter Forecast, by Soft Drink Type 2020 & 2033
- Table 3: Global Carbonated Drinks Market Revenue Million Forecast, by Packaging Type 2020 & 2033
- Table 4: Global Carbonated Drinks Market Volume liter Forecast, by Packaging Type 2020 & 2033
- Table 5: Global Carbonated Drinks Market Revenue Million Forecast, by Distribution Channel 2020 & 2033
- Table 6: Global Carbonated Drinks Market Volume liter Forecast, by Distribution Channel 2020 & 2033
- Table 7: Global Carbonated Drinks Market Revenue Million Forecast, by Region 2020 & 2033
- Table 8: Global Carbonated Drinks Market Volume liter Forecast, by Region 2020 & 2033
- Table 9: Global Carbonated Drinks Market Revenue Million Forecast, by Soft Drink Type 2020 & 2033
- Table 10: Global Carbonated Drinks Market Volume liter Forecast, by Soft Drink Type 2020 & 2033
- Table 11: Global Carbonated Drinks Market Revenue Million Forecast, by Packaging Type 2020 & 2033
- Table 12: Global Carbonated Drinks Market Volume liter Forecast, by Packaging Type 2020 & 2033
- Table 13: Global Carbonated Drinks Market Revenue Million Forecast, by Distribution Channel 2020 & 2033
- Table 14: Global Carbonated Drinks Market Volume liter Forecast, by Distribution Channel 2020 & 2033
- Table 15: Global Carbonated Drinks Market Revenue Million Forecast, by Country 2020 & 2033
- Table 16: Global Carbonated Drinks Market Volume liter Forecast, by Country 2020 & 2033
- Table 17: United States Carbonated Drinks Market Revenue (Million) Forecast, by Application 2020 & 2033
- Table 18: United States Carbonated Drinks Market Volume (liter ) Forecast, by Application 2020 & 2033
- Table 19: Canada Carbonated Drinks Market Revenue (Million) Forecast, by Application 2020 & 2033
- Table 20: Canada Carbonated Drinks Market Volume (liter ) Forecast, by Application 2020 & 2033
- Table 21: Mexico Carbonated Drinks Market Revenue (Million) Forecast, by Application 2020 & 2033
- Table 22: Mexico Carbonated Drinks Market Volume (liter ) Forecast, by Application 2020 & 2033
- Table 23: Global Carbonated Drinks Market Revenue Million Forecast, by Soft Drink Type 2020 & 2033
- Table 24: Global Carbonated Drinks Market Volume liter Forecast, by Soft Drink Type 2020 & 2033
- Table 25: Global Carbonated Drinks Market Revenue Million Forecast, by Packaging Type 2020 & 2033
- Table 26: Global Carbonated Drinks Market Volume liter Forecast, by Packaging Type 2020 & 2033
- Table 27: Global Carbonated Drinks Market Revenue Million Forecast, by Distribution Channel 2020 & 2033
- Table 28: Global Carbonated Drinks Market Volume liter Forecast, by Distribution Channel 2020 & 2033
- Table 29: Global Carbonated Drinks Market Revenue Million Forecast, by Country 2020 & 2033
- Table 30: Global Carbonated Drinks Market Volume liter Forecast, by Country 2020 & 2033
- Table 31: Brazil Carbonated Drinks Market Revenue (Million) Forecast, by Application 2020 & 2033
- Table 32: Brazil Carbonated Drinks Market Volume (liter ) Forecast, by Application 2020 & 2033
- Table 33: Argentina Carbonated Drinks Market Revenue (Million) Forecast, by Application 2020 & 2033
- Table 34: Argentina Carbonated Drinks Market Volume (liter ) Forecast, by Application 2020 & 2033
- Table 35: Rest of South America Carbonated Drinks Market Revenue (Million) Forecast, by Application 2020 & 2033
- Table 36: Rest of South America Carbonated Drinks Market Volume (liter ) Forecast, by Application 2020 & 2033
- Table 37: Global Carbonated Drinks Market Revenue Million Forecast, by Soft Drink Type 2020 & 2033
- Table 38: Global Carbonated Drinks Market Volume liter Forecast, by Soft Drink Type 2020 & 2033
- Table 39: Global Carbonated Drinks Market Revenue Million Forecast, by Packaging Type 2020 & 2033
- Table 40: Global Carbonated Drinks Market Volume liter Forecast, by Packaging Type 2020 & 2033
- Table 41: Global Carbonated Drinks Market Revenue Million Forecast, by Distribution Channel 2020 & 2033
- Table 42: Global Carbonated Drinks Market Volume liter Forecast, by Distribution Channel 2020 & 2033
- Table 43: Global Carbonated Drinks Market Revenue Million Forecast, by Country 2020 & 2033
- Table 44: Global Carbonated Drinks Market Volume liter Forecast, by Country 2020 & 2033
- Table 45: United Kingdom Carbonated Drinks Market Revenue (Million) Forecast, by Application 2020 & 2033
- Table 46: United Kingdom Carbonated Drinks Market Volume (liter ) Forecast, by Application 2020 & 2033
- Table 47: Germany Carbonated Drinks Market Revenue (Million) Forecast, by Application 2020 & 2033
- Table 48: Germany Carbonated Drinks Market Volume (liter ) Forecast, by Application 2020 & 2033
- Table 49: France Carbonated Drinks Market Revenue (Million) Forecast, by Application 2020 & 2033
- Table 50: France Carbonated Drinks Market Volume (liter ) Forecast, by Application 2020 & 2033
- Table 51: Italy Carbonated Drinks Market Revenue (Million) Forecast, by Application 2020 & 2033
- Table 52: Italy Carbonated Drinks Market Volume (liter ) Forecast, by Application 2020 & 2033
- Table 53: Spain Carbonated Drinks Market Revenue (Million) Forecast, by Application 2020 & 2033
- Table 54: Spain Carbonated Drinks Market Volume (liter ) Forecast, by Application 2020 & 2033
- Table 55: Russia Carbonated Drinks Market Revenue (Million) Forecast, by Application 2020 & 2033
- Table 56: Russia Carbonated Drinks Market Volume (liter ) Forecast, by Application 2020 & 2033
- Table 57: Benelux Carbonated Drinks Market Revenue (Million) Forecast, by Application 2020 & 2033
- Table 58: Benelux Carbonated Drinks Market Volume (liter ) Forecast, by Application 2020 & 2033
- Table 59: Nordics Carbonated Drinks Market Revenue (Million) Forecast, by Application 2020 & 2033
- Table 60: Nordics Carbonated Drinks Market Volume (liter ) Forecast, by Application 2020 & 2033
- Table 61: Rest of Europe Carbonated Drinks Market Revenue (Million) Forecast, by Application 2020 & 2033
- Table 62: Rest of Europe Carbonated Drinks Market Volume (liter ) Forecast, by Application 2020 & 2033
- Table 63: Global Carbonated Drinks Market Revenue Million Forecast, by Soft Drink Type 2020 & 2033
- Table 64: Global Carbonated Drinks Market Volume liter Forecast, by Soft Drink Type 2020 & 2033
- Table 65: Global Carbonated Drinks Market Revenue Million Forecast, by Packaging Type 2020 & 2033
- Table 66: Global Carbonated Drinks Market Volume liter Forecast, by Packaging Type 2020 & 2033
- Table 67: Global Carbonated Drinks Market Revenue Million Forecast, by Distribution Channel 2020 & 2033
- Table 68: Global Carbonated Drinks Market Volume liter Forecast, by Distribution Channel 2020 & 2033
- Table 69: Global Carbonated Drinks Market Revenue Million Forecast, by Country 2020 & 2033
- Table 70: Global Carbonated Drinks Market Volume liter Forecast, by Country 2020 & 2033
- Table 71: Turkey Carbonated Drinks Market Revenue (Million) Forecast, by Application 2020 & 2033
- Table 72: Turkey Carbonated Drinks Market Volume (liter ) Forecast, by Application 2020 & 2033
- Table 73: Israel Carbonated Drinks Market Revenue (Million) Forecast, by Application 2020 & 2033
- Table 74: Israel Carbonated Drinks Market Volume (liter ) Forecast, by Application 2020 & 2033
- Table 75: GCC Carbonated Drinks Market Revenue (Million) Forecast, by Application 2020 & 2033
- Table 76: GCC Carbonated Drinks Market Volume (liter ) Forecast, by Application 2020 & 2033
- Table 77: North Africa Carbonated Drinks Market Revenue (Million) Forecast, by Application 2020 & 2033
- Table 78: North Africa Carbonated Drinks Market Volume (liter ) Forecast, by Application 2020 & 2033
- Table 79: South Africa Carbonated Drinks Market Revenue (Million) Forecast, by Application 2020 & 2033
- Table 80: South Africa Carbonated Drinks Market Volume (liter ) Forecast, by Application 2020 & 2033
- Table 81: Rest of Middle East & Africa Carbonated Drinks Market Revenue (Million) Forecast, by Application 2020 & 2033
- Table 82: Rest of Middle East & Africa Carbonated Drinks Market Volume (liter ) Forecast, by Application 2020 & 2033
- Table 83: Global Carbonated Drinks Market Revenue Million Forecast, by Soft Drink Type 2020 & 2033
- Table 84: Global Carbonated Drinks Market Volume liter Forecast, by Soft Drink Type 2020 & 2033
- Table 85: Global Carbonated Drinks Market Revenue Million Forecast, by Packaging Type 2020 & 2033
- Table 86: Global Carbonated Drinks Market Volume liter Forecast, by Packaging Type 2020 & 2033
- Table 87: Global Carbonated Drinks Market Revenue Million Forecast, by Distribution Channel 2020 & 2033
- Table 88: Global Carbonated Drinks Market Volume liter Forecast, by Distribution Channel 2020 & 2033
- Table 89: Global Carbonated Drinks Market Revenue Million Forecast, by Country 2020 & 2033
- Table 90: Global Carbonated Drinks Market Volume liter Forecast, by Country 2020 & 2033
- Table 91: China Carbonated Drinks Market Revenue (Million) Forecast, by Application 2020 & 2033
- Table 92: China Carbonated Drinks Market Volume (liter ) Forecast, by Application 2020 & 2033
- Table 93: India Carbonated Drinks Market Revenue (Million) Forecast, by Application 2020 & 2033
- Table 94: India Carbonated Drinks Market Volume (liter ) Forecast, by Application 2020 & 2033
- Table 95: Japan Carbonated Drinks Market Revenue (Million) Forecast, by Application 2020 & 2033
- Table 96: Japan Carbonated Drinks Market Volume (liter ) Forecast, by Application 2020 & 2033
- Table 97: South Korea Carbonated Drinks Market Revenue (Million) Forecast, by Application 2020 & 2033
- Table 98: South Korea Carbonated Drinks Market Volume (liter ) Forecast, by Application 2020 & 2033
- Table 99: ASEAN Carbonated Drinks Market Revenue (Million) Forecast, by Application 2020 & 2033
- Table 100: ASEAN Carbonated Drinks Market Volume (liter ) Forecast, by Application 2020 & 2033
- Table 101: Oceania Carbonated Drinks Market Revenue (Million) Forecast, by Application 2020 & 2033
- Table 102: Oceania Carbonated Drinks Market Volume (liter ) Forecast, by Application 2020 & 2033
- Table 103: Rest of Asia Pacific Carbonated Drinks Market Revenue (Million) Forecast, by Application 2020 & 2033
- Table 104: Rest of Asia Pacific Carbonated Drinks Market Volume (liter ) Forecast, by Application 2020 & 2033
Frequently Asked Questions
1. What is the projected Compound Annual Growth Rate (CAGR) of the Carbonated Drinks Market?
The projected CAGR is approximately 4.76%.
2. Which companies are prominent players in the Carbonated Drinks Market?
Key companies in the market include Asahi Group Holdings Ltd, PepsiCo Inc, Nongfu Spring Co Ltd, Rauch Fruchtsäfte GmbH & Co OG, PT Anggada Putra Rekso Mulia, Suntory Holdings Limited, Keurig Dr Pepper Inc, National Beverage Corp, Refresco Group BV, The Coca-Cola Company, Hangzhou Wahaha Group Co Ltd, Kirin Holdings Company Limited, Britvic PLC, Tingyi (Cayman Islands) Holding Corporatio, Thai Beverages PCL.
3. What are the main segments of the Carbonated Drinks Market?
The market segments include Soft Drink Type, Packaging Type, Distribution Channel.
4. Can you provide details about the market size?
The market size is estimated to be USD 500260 Million as of 2022.
5. What are some drivers contributing to market growth?
Growing preference for low alcoholic beer by volume (abv) or non-alcoholic beers; Rising number of breweries leading to high prominence of craft beer.
6. What are the notable trends driving market growth?
OTHER KEY INDUSTRY TRENDS COVERED IN THE REPORT.
7. Are there any restraints impacting market growth?
Demand for other alcoholic beverages.
8. Can you provide examples of recent developments in the market?
December 2023: Kirin launched its Tokusei Ginger Ale Sour and sugar-free tea products, including black tea and Hojicha, in response to the growing demand for sugar-free beverages due to heightened health awareness in Japan. Kirin limited the availability of the Kirin Tokusei Ginger Ale Sour and sugar-free tea products to the local Japanese market as of 2023.October 2023: Coca-Cola launched Coca-Cola Y3000, the beverage is created with the help of artificial intelligence. Coca-Cola Y3000 is the latest limited-edition flavor to launch under its Coca-Cola Creations platform.January 2023: PepsiCo Inc. launched Starry, a tasting soda with a Lemon-Lime flavor. This drink is available in regular and zero-sugar versions.
9. What pricing options are available for accessing the report?
Pricing options include single-user, multi-user, and enterprise licenses priced at USD 3800, USD 4500, and USD 5800 respectively.
10. Is the market size provided in terms of value or volume?
The market size is provided in terms of value, measured in Million and volume, measured in liter .
11. Are there any specific market keywords associated with the report?
Yes, the market keyword associated with the report is "Carbonated Drinks Market," which aids in identifying and referencing the specific market segment covered.
12. How do I determine which pricing option suits my needs best?
The pricing options vary based on user requirements and access needs. Individual users may opt for single-user licenses, while businesses requiring broader access may choose multi-user or enterprise licenses for cost-effective access to the report.
13. Are there any additional resources or data provided in the Carbonated Drinks Market report?
While the report offers comprehensive insights, it's advisable to review the specific contents or supplementary materials provided to ascertain if additional resources or data are available.
14. How can I stay updated on further developments or reports in the Carbonated Drinks Market?
To stay informed about further developments, trends, and reports in the Carbonated Drinks Market, consider subscribing to industry newsletters, following relevant companies and organizations, or regularly checking reputable industry news sources and publications.
Methodology
Step 1 - Identification of Relevant Samples Size from Population Database


Step 2 - Approaches for Defining Global Market Size (Value, Volume* & Price*)

Note*: In applicable scenarios
Step 3 - Data Sources
Primary Research
- Web Analytics
- Survey Reports
- Research Institute
- Latest Research Reports
- Opinion Leaders
Secondary Research
- Annual Reports
- White Paper
- Latest Press Release
- Industry Association
- Paid Database
- Investor Presentations

Step 4 - Data Triangulation
Involves using different sources of information in order to increase the validity of a study
These sources are likely to be stakeholders in a program - participants, other researchers, program staff, other community members, and so on.
Then we put all data in single framework & apply various statistical tools to find out the dynamic on the market.
During the analysis stage, feedback from the stakeholder groups would be compared to determine areas of agreement as well as areas of divergence

