

Key Insights
The global carpets and rugs market presents a significant opportunity, characterized by robust expansion. Key growth drivers include rising disposable incomes in emerging economies, driving demand for home furnishings, and the persistent popularity of interior design trends that prominently feature carpets and rugs. Advancements in materials and technology are yielding more durable, stylish, and eco-friendly products. Furthermore, the proliferation of e-commerce platforms enhances market accessibility and sales. However, challenges such as volatile raw material prices, competition from alternative flooring, and environmental concerns related to production and disposal require strategic consideration. The market is segmented by application (residential, commercial), material (wool, synthetic), and price point, offering specialized opportunities.
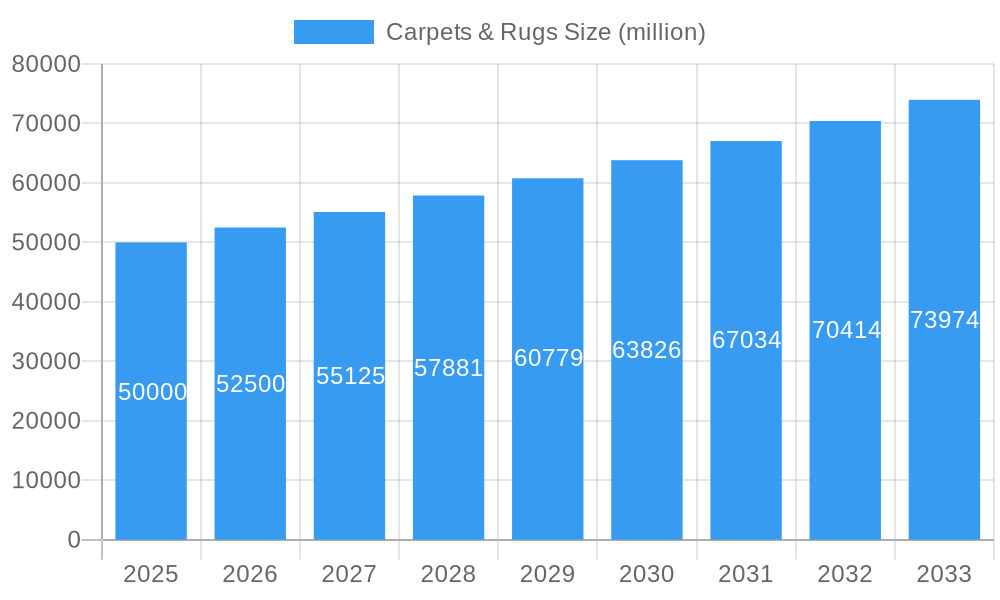
Carpets & Rugs Market Size (In Billion)
Leading companies like Mohawk Industries, Shaw Industries, and Tarkett leverage strong brand recognition and extensive distribution. Niche players are successfully carving out market share through specialized designs or sustainable practices. Future market trajectory will be shaped by evolving consumer preferences, manufacturing innovations, and a heightened emphasis on sustainability. The inherent appeal of carpets and rugs for comfort, insulation, and aesthetic versatility underpins the market's resilience, fostering a dynamic environment for both established and emerging enterprises.
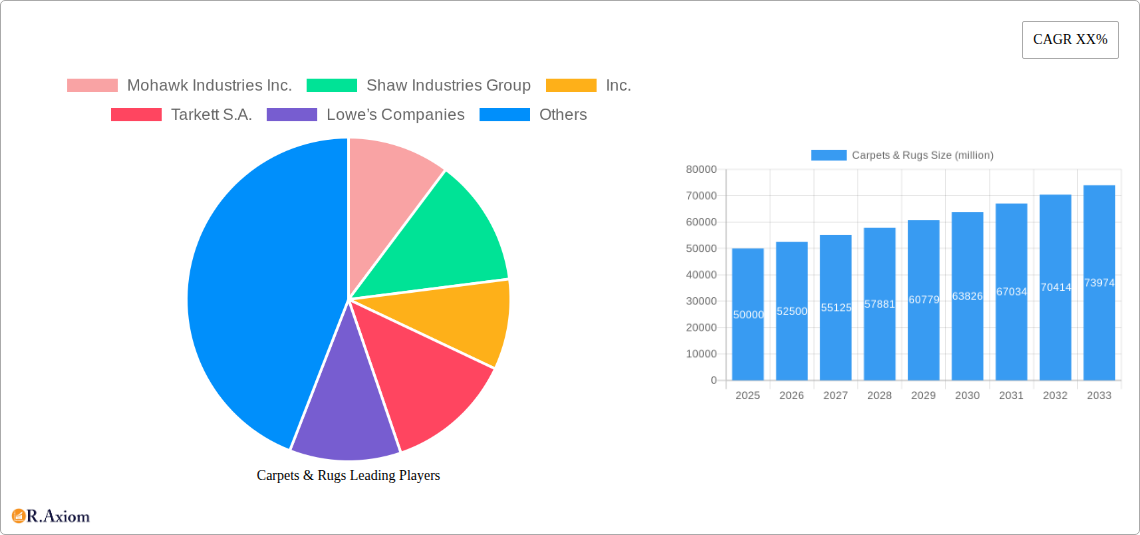
Carpets & Rugs Company Market Share
Global Carpets & Rugs Market Analysis: 2019-2033
This in-depth analysis offers critical insights into the global carpets and rugs market, covering 2019-2033 with a forecast period from 2025-2033. The market size is projected to reach 64.19 billion by 2025, with a compound annual growth rate (CAGR) of 11.08%. The base year for this analysis is 2025, and market values are presented in billions.
Carpets & Rugs Market Concentration & Innovation
The global carpets & rugs market exhibits a moderately concentrated structure, with a few major players holding significant market share. Mohawk Industries Inc., Shaw Industries Group, Inc., and Tarkett S.A. are among the leading companies, collectively accounting for approximately xx% of the global market in 2025. Market share dynamics are influenced by factors such as innovation, brand recognition, distribution networks, and strategic acquisitions. Mergers and acquisitions (M&A) have played a crucial role in shaping market concentration, with total M&A deal values exceeding $xx million in the historical period (2019-2024). Key innovation drivers include the development of sustainable materials, technologically advanced manufacturing processes, and the introduction of innovative designs and styles catering to evolving consumer preferences. Stringent regulatory frameworks regarding environmental sustainability and product safety are also shaping industry practices. The market also faces competition from alternative flooring solutions like hardwood, vinyl, and laminate. End-user trends, including a growing preference for eco-friendly and hypoallergenic carpets, are influencing product development and market segmentation.
- Market Share (2025): Mohawk Industries Inc. (xx%), Shaw Industries Group, Inc. (xx%), Tarkett S.A. (xx%), Others (xx%)
- M&A Deal Value (2019-2024): $xx million
- Key Innovation Drivers: Sustainable materials, advanced manufacturing, innovative designs.
Carpets & Rugs Industry Trends & Insights
The global carpets & rugs market is projected to experience significant growth during the forecast period (2025-2033), with a Compound Annual Growth Rate (CAGR) of xx%. This growth is fueled by several key factors, including rising disposable incomes in developing economies, increasing urbanization, and a growing preference for comfortable and aesthetically pleasing home environments. Technological disruptions, such as the adoption of advanced manufacturing techniques and the use of data analytics for optimizing supply chains, are further contributing to market expansion. Consumer preferences are evolving towards eco-friendly materials, customizable designs, and durable, low-maintenance products. Competitive dynamics are characterized by intense rivalry among established players and the emergence of new entrants offering innovative products and business models. Market penetration of innovative materials like recycled fibers is steadily increasing, reaching xx% in 2025.
Dominant Markets & Segments in Carpets & Rugs
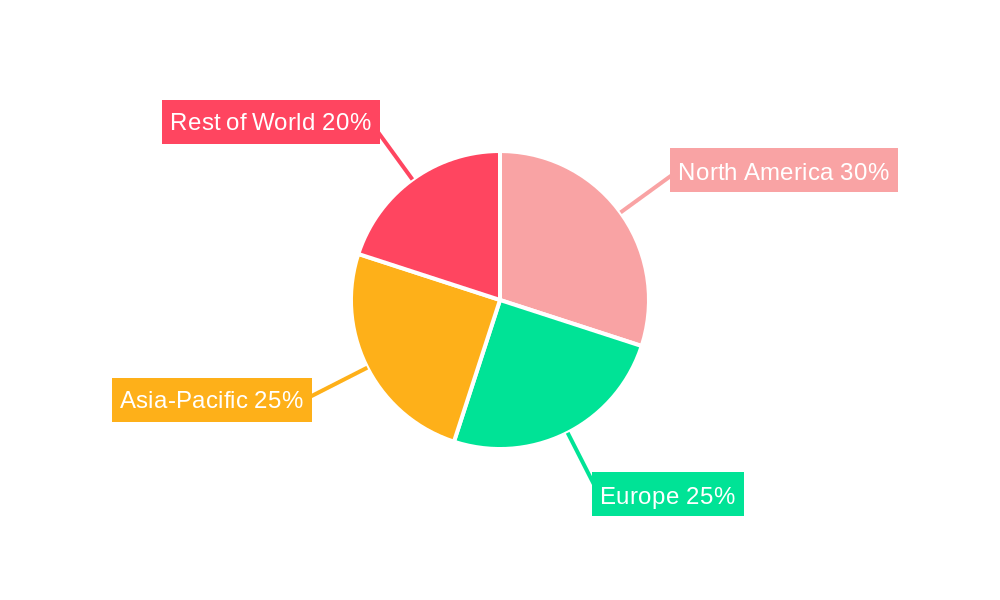
The North American region currently dominates the global carpets & rugs market, driven by strong economic growth, well-developed infrastructure, and high consumer spending on home furnishings. Within North America, the United States holds the largest market share.
- Key Drivers for North American Dominance:
- High disposable incomes
- Robust construction and renovation activities
- Strong consumer preference for carpets and rugs
Carpets & Rugs Product Developments
Recent product developments in the carpets & rugs industry focus on sustainability, durability, and design innovation. Manufacturers are increasingly using recycled and renewable materials, while technological advancements in manufacturing processes are leading to higher quality, longer-lasting products. The integration of smart technology, such as embedded heating or cooling systems, is also gaining traction. These developments enhance the appeal of carpets and rugs across various applications, including residential, commercial, and hospitality settings.
Report Scope & Segmentation Analysis
This report segments the carpets & rugs market by product type (e.g., tufted, woven, handmade), material (e.g., wool, synthetic fibers, blends), end-use (e.g., residential, commercial), and region. Each segment's growth projections, market sizes, and competitive dynamics are analyzed in detail. The xx segment is expected to witness the highest CAGR during the forecast period, driven by xx. The competitive landscape within each segment varies, with some segments exhibiting higher levels of consolidation than others.
Key Drivers of Carpets & Rugs Growth
Several key factors are driving the growth of the carpets & rugs market. These include:
- Rising disposable incomes globally leading to increased spending on home improvements.
- Growth in the construction and renovation sector, creating high demand for floor coverings.
- Government initiatives promoting sustainable building practices, leading to greater adoption of eco-friendly carpets.
Challenges in the Carpets & Rugs Sector
The carpets & rugs industry faces several challenges, including:
- Fluctuations in raw material prices, impacting manufacturing costs.
- Stringent environmental regulations, necessitating compliance investments.
- Intense competition from alternative flooring options.
Emerging Opportunities in Carpets & Rugs
Emerging opportunities in the carpets & rugs market include:
- Growth in demand for customized and personalized carpets.
- Expansion into new markets in developing economies.
- Development of innovative products with enhanced functionalities, such as antimicrobial properties or improved sound insulation.
Leading Players in the Carpets & Rugs Market
- Mohawk Industries Inc.
- Shaw Industries Group, Inc.
- Tarkett S.A.
- Lowe’s Companies, Inc.
- Interface Inc.
- Dixie Group, Inc.
- Oriental Weavers Company for Carpet.
- Tai Ping Carpets International Limited
- Victoria PLC
- The Home Depot, Inc.
- Mannington Mills, Inc.
- Beaulieu International Group
- Ikea Group
- Engineered Floors LLC
- Royalty Carpet Mills, Inc.
- Stark Carpet Corp.
- Invista
- Milliken & Company
- Kraus Carpet Mills Ltd.
- Couristan, Inc.
- ABBey Carpet & Floor
- Axminster Carpets Ltd
- Floor Coverings International
- Avalanche Flooring, Inc.
- Foamex International Inc
Key Developments in Carpets & Rugs Industry
- 2022 Q4: Mohawk Industries Inc. launched a new line of sustainable carpets made from recycled materials.
- 2023 Q1: Shaw Industries Group, Inc. announced a significant investment in its manufacturing capacity to meet growing demand.
- 2023 Q2: Tarkett S.A. acquired a smaller competitor, strengthening its market position. (Further details xx)
Strategic Outlook for Carpets & Rugs Market
The carpets & rugs market is poised for continued growth driven by increasing urbanization, rising disposable incomes, and innovation in product design and manufacturing. Opportunities exist for companies that can offer sustainable, high-quality products that meet the evolving preferences of consumers. Strategic partnerships and investments in research and development will be crucial for sustained success in this competitive market.
Carpets & Rugs Segmentation
-
1. Application
- 1.1. Residential
- 1.2. Commercial
- 1.3. Automotive
- 1.4. Others
-
2. Types
- 2.1. Tufted
- 2.2. Woven
- 2.3. Needle-punched
- 2.4. Knotted
- 2.5. Others
Carpets & Rugs Segmentation By Geography
-
1. North America
- 1.1. United States
- 1.2. Canada
- 1.3. Mexico
-
2. South America
- 2.1. Brazil
- 2.2. Argentina
- 2.3. Rest of South America
-
3. Europe
- 3.1. United Kingdom
- 3.2. Germany
- 3.3. France
- 3.4. Italy
- 3.5. Spain
- 3.6. Russia
- 3.7. Benelux
- 3.8. Nordics
- 3.9. Rest of Europe
-
4. Middle East & Africa
- 4.1. Turkey
- 4.2. Israel
- 4.3. GCC
- 4.4. North Africa
- 4.5. South Africa
- 4.6. Rest of Middle East & Africa
-
5. Asia Pacific
- 5.1. China
- 5.2. India
- 5.3. Japan
- 5.4. South Korea
- 5.5. ASEAN
- 5.6. Oceania
- 5.7. Rest of Asia Pacific
Carpets & Rugs Regional Market Share
Geographic Coverage of Carpets & Rugs
Carpets & Rugs REPORT HIGHLIGHTS
| Aspects | Details |
|---|---|
| Study Period | 2020-2034 |
| Base Year | 2025 |
| Estimated Year | 2026 |
| Forecast Period | 2026-2034 |
| Historical Period | 2020-2025 |
| Growth Rate | CAGR of 11.08% from 2020-2034 |
| Segmentation |
|
Table of Contents
- 1. Introduction
- 1.1. Research Scope
- 1.2. Market Segmentation
- 1.3. Research Objective
- 1.4. Definitions and Assumptions
- 2. Executive Summary
- 2.1. Market Snapshot
- 3. Market Dynamics
- 3.1. Market Drivers
- 3.2. Market Restrains
- 3.3. Market Trends
- 3.4. Market Opportunities
- 4. Market Factor Analysis
- 4.1. Porters Five Forces
- 4.1.1. Bargaining Power of Suppliers
- 4.1.2. Bargaining Power of Buyers
- 4.1.3. Threat of New Entrants
- 4.1.4. Threat of Substitutes
- 4.1.5. Competitive Rivalry
- 4.2. PESTEL analysis
- 4.3. BCG Analysis
- 4.3.1. Stars (High Growth, High Market Share)
- 4.3.2. Cash Cows (Low Growth, High Market Share)
- 4.3.3. Question Mark (High Growth, Low Market Share)
- 4.3.4. Dogs (Low Growth, Low Market Share)
- 4.4. Ansoff Matrix Analysis
- 4.5. Supply Chain Analysis
- 4.6. Regulatory Landscape
- 4.7. Current Market Potential and Opportunity Assessment (TAM–SAM–SOM Framework)
- 4.8. RAX Analyst Note
- 4.1. Porters Five Forces
- 5. Market Analysis, Insights and Forecast 2021-2033
- 5.1. Market Analysis, Insights and Forecast - by Application
- 5.1.1. Residential
- 5.1.2. Commercial
- 5.1.3. Automotive
- 5.1.4. Others
- 5.2. Market Analysis, Insights and Forecast - by Types
- 5.2.1. Tufted
- 5.2.2. Woven
- 5.2.3. Needle-punched
- 5.2.4. Knotted
- 5.2.5. Others
- 5.3. Market Analysis, Insights and Forecast - by Region
- 5.3.1. North America
- 5.3.2. South America
- 5.3.3. Europe
- 5.3.4. Middle East & Africa
- 5.3.5. Asia Pacific
- 5.1. Market Analysis, Insights and Forecast - by Application
- 6. Global Carpets & Rugs Analysis, Insights and Forecast, 2021-2033
- 6.1. Market Analysis, Insights and Forecast - by Application
- 6.1.1. Residential
- 6.1.2. Commercial
- 6.1.3. Automotive
- 6.1.4. Others
- 6.2. Market Analysis, Insights and Forecast - by Types
- 6.2.1. Tufted
- 6.2.2. Woven
- 6.2.3. Needle-punched
- 6.2.4. Knotted
- 6.2.5. Others
- 6.1. Market Analysis, Insights and Forecast - by Application
- 7. North America Carpets & Rugs Analysis, Insights and Forecast, 2020-2032
- 7.1. Market Analysis, Insights and Forecast - by Application
- 7.1.1. Residential
- 7.1.2. Commercial
- 7.1.3. Automotive
- 7.1.4. Others
- 7.2. Market Analysis, Insights and Forecast - by Types
- 7.2.1. Tufted
- 7.2.2. Woven
- 7.2.3. Needle-punched
- 7.2.4. Knotted
- 7.2.5. Others
- 7.1. Market Analysis, Insights and Forecast - by Application
- 8. South America Carpets & Rugs Analysis, Insights and Forecast, 2020-2032
- 8.1. Market Analysis, Insights and Forecast - by Application
- 8.1.1. Residential
- 8.1.2. Commercial
- 8.1.3. Automotive
- 8.1.4. Others
- 8.2. Market Analysis, Insights and Forecast - by Types
- 8.2.1. Tufted
- 8.2.2. Woven
- 8.2.3. Needle-punched
- 8.2.4. Knotted
- 8.2.5. Others
- 8.1. Market Analysis, Insights and Forecast - by Application
- 9. Europe Carpets & Rugs Analysis, Insights and Forecast, 2020-2032
- 9.1. Market Analysis, Insights and Forecast - by Application
- 9.1.1. Residential
- 9.1.2. Commercial
- 9.1.3. Automotive
- 9.1.4. Others
- 9.2. Market Analysis, Insights and Forecast - by Types
- 9.2.1. Tufted
- 9.2.2. Woven
- 9.2.3. Needle-punched
- 9.2.4. Knotted
- 9.2.5. Others
- 9.1. Market Analysis, Insights and Forecast - by Application
- 10. Middle East & Africa Carpets & Rugs Analysis, Insights and Forecast, 2020-2032
- 10.1. Market Analysis, Insights and Forecast - by Application
- 10.1.1. Residential
- 10.1.2. Commercial
- 10.1.3. Automotive
- 10.1.4. Others
- 10.2. Market Analysis, Insights and Forecast - by Types
- 10.2.1. Tufted
- 10.2.2. Woven
- 10.2.3. Needle-punched
- 10.2.4. Knotted
- 10.2.5. Others
- 10.1. Market Analysis, Insights and Forecast - by Application
- 11. Asia Pacific Carpets & Rugs Analysis, Insights and Forecast, 2020-2032
- 11.1. Market Analysis, Insights and Forecast - by Application
- 11.1.1. Residential
- 11.1.2. Commercial
- 11.1.3. Automotive
- 11.1.4. Others
- 11.2. Market Analysis, Insights and Forecast - by Types
- 11.2.1. Tufted
- 11.2.2. Woven
- 11.2.3. Needle-punched
- 11.2.4. Knotted
- 11.2.5. Others
- 11.1. Market Analysis, Insights and Forecast - by Application
- 12. Competitive Analysis
- 12.1. Company Profiles
- 12.1.1 Mohawk Industries Inc.
- 12.1.1.1. Company Overview
- 12.1.1.2. Products
- 12.1.1.3. Company Financials
- 12.1.1.4. SWOT Analysis
- 12.1.2 Shaw Industries Group
- 12.1.2.1. Company Overview
- 12.1.2.2. Products
- 12.1.2.3. Company Financials
- 12.1.2.4. SWOT Analysis
- 12.1.3 Inc.
- 12.1.3.1. Company Overview
- 12.1.3.2. Products
- 12.1.3.3. Company Financials
- 12.1.3.4. SWOT Analysis
- 12.1.4 Tarkett S.A.
- 12.1.4.1. Company Overview
- 12.1.4.2. Products
- 12.1.4.3. Company Financials
- 12.1.4.4. SWOT Analysis
- 12.1.5 Lowe’s Companies
- 12.1.5.1. Company Overview
- 12.1.5.2. Products
- 12.1.5.3. Company Financials
- 12.1.5.4. SWOT Analysis
- 12.1.6 Inc.
- 12.1.6.1. Company Overview
- 12.1.6.2. Products
- 12.1.6.3. Company Financials
- 12.1.6.4. SWOT Analysis
- 12.1.7 Interface Inc.
- 12.1.7.1. Company Overview
- 12.1.7.2. Products
- 12.1.7.3. Company Financials
- 12.1.7.4. SWOT Analysis
- 12.1.8 Dixie Group
- 12.1.8.1. Company Overview
- 12.1.8.2. Products
- 12.1.8.3. Company Financials
- 12.1.8.4. SWOT Analysis
- 12.1.9 Inc.
- 12.1.9.1. Company Overview
- 12.1.9.2. Products
- 12.1.9.3. Company Financials
- 12.1.9.4. SWOT Analysis
- 12.1.10 Oriental Weavers Company for Carpet.
- 12.1.10.1. Company Overview
- 12.1.10.2. Products
- 12.1.10.3. Company Financials
- 12.1.10.4. SWOT Analysis
- 12.1.11 Tai Ping Carpets International Limited
- 12.1.11.1. Company Overview
- 12.1.11.2. Products
- 12.1.11.3. Company Financials
- 12.1.11.4. SWOT Analysis
- 12.1.12 Victoria PLC
- 12.1.12.1. Company Overview
- 12.1.12.2. Products
- 12.1.12.3. Company Financials
- 12.1.12.4. SWOT Analysis
- 12.1.13 The Home Depot
- 12.1.13.1. Company Overview
- 12.1.13.2. Products
- 12.1.13.3. Company Financials
- 12.1.13.4. SWOT Analysis
- 12.1.14 Inc.
- 12.1.14.1. Company Overview
- 12.1.14.2. Products
- 12.1.14.3. Company Financials
- 12.1.14.4. SWOT Analysis
- 12.1.15 Mannington Mills
- 12.1.15.1. Company Overview
- 12.1.15.2. Products
- 12.1.15.3. Company Financials
- 12.1.15.4. SWOT Analysis
- 12.1.16 Inc.
- 12.1.16.1. Company Overview
- 12.1.16.2. Products
- 12.1.16.3. Company Financials
- 12.1.16.4. SWOT Analysis
- 12.1.17 Beaulieu International Group
- 12.1.17.1. Company Overview
- 12.1.17.2. Products
- 12.1.17.3. Company Financials
- 12.1.17.4. SWOT Analysis
- 12.1.18 Ikea Group
- 12.1.18.1. Company Overview
- 12.1.18.2. Products
- 12.1.18.3. Company Financials
- 12.1.18.4. SWOT Analysis
- 12.1.19 Engineered Floors LLC
- 12.1.19.1. Company Overview
- 12.1.19.2. Products
- 12.1.19.3. Company Financials
- 12.1.19.4. SWOT Analysis
- 12.1.20 Royalty Carpet Mills
- 12.1.20.1. Company Overview
- 12.1.20.2. Products
- 12.1.20.3. Company Financials
- 12.1.20.4. SWOT Analysis
- 12.1.21 Inc.
- 12.1.21.1. Company Overview
- 12.1.21.2. Products
- 12.1.21.3. Company Financials
- 12.1.21.4. SWOT Analysis
- 12.1.22 Stark Carpet Corp.
- 12.1.22.1. Company Overview
- 12.1.22.2. Products
- 12.1.22.3. Company Financials
- 12.1.22.4. SWOT Analysis
- 12.1.23 Invista
- 12.1.23.1. Company Overview
- 12.1.23.2. Products
- 12.1.23.3. Company Financials
- 12.1.23.4. SWOT Analysis
- 12.1.24 Milliken & Company
- 12.1.24.1. Company Overview
- 12.1.24.2. Products
- 12.1.24.3. Company Financials
- 12.1.24.4. SWOT Analysis
- 12.1.25 Kraus Carpet Mills Ltd.
- 12.1.25.1. Company Overview
- 12.1.25.2. Products
- 12.1.25.3. Company Financials
- 12.1.25.4. SWOT Analysis
- 12.1.26 Couristan
- 12.1.26.1. Company Overview
- 12.1.26.2. Products
- 12.1.26.3. Company Financials
- 12.1.26.4. SWOT Analysis
- 12.1.27 Inc.
- 12.1.27.1. Company Overview
- 12.1.27.2. Products
- 12.1.27.3. Company Financials
- 12.1.27.4. SWOT Analysis
- 12.1.28 ABBey Carpet & Floor
- 12.1.28.1. Company Overview
- 12.1.28.2. Products
- 12.1.28.3. Company Financials
- 12.1.28.4. SWOT Analysis
- 12.1.29 Axminster Carpets Ltd
- 12.1.29.1. Company Overview
- 12.1.29.2. Products
- 12.1.29.3. Company Financials
- 12.1.29.4. SWOT Analysis
- 12.1.30 Floor Coverings International
- 12.1.30.1. Company Overview
- 12.1.30.2. Products
- 12.1.30.3. Company Financials
- 12.1.30.4. SWOT Analysis
- 12.1.31 Avalanche Flooring
- 12.1.31.1. Company Overview
- 12.1.31.2. Products
- 12.1.31.3. Company Financials
- 12.1.31.4. SWOT Analysis
- 12.1.32 Inc.
- 12.1.32.1. Company Overview
- 12.1.32.2. Products
- 12.1.32.3. Company Financials
- 12.1.32.4. SWOT Analysis
- 12.1.33 Foamex International Inc
- 12.1.33.1. Company Overview
- 12.1.33.2. Products
- 12.1.33.3. Company Financials
- 12.1.33.4. SWOT Analysis
- 12.1.1 Mohawk Industries Inc.
- 12.2. Market Entropy
- 12.2.1 Company's Key Areas Served
- 12.2.2 Recent Developments
- 12.3. Company Market Share Analysis 2025
- 12.3.1 Top 5 Companies Market Share Analysis
- 12.3.2 Top 3 Companies Market Share Analysis
- 12.4. List of Potential Customers
- 13. Research Methodology
List of Figures
- Figure 1: Global Carpets & Rugs Revenue Breakdown (billion, %) by Region 2025 & 2033
- Figure 2: Global Carpets & Rugs Volume Breakdown (K, %) by Region 2025 & 2033
- Figure 3: North America Carpets & Rugs Revenue (billion), by Application 2025 & 2033
- Figure 4: North America Carpets & Rugs Volume (K), by Application 2025 & 2033
- Figure 5: North America Carpets & Rugs Revenue Share (%), by Application 2025 & 2033
- Figure 6: North America Carpets & Rugs Volume Share (%), by Application 2025 & 2033
- Figure 7: North America Carpets & Rugs Revenue (billion), by Types 2025 & 2033
- Figure 8: North America Carpets & Rugs Volume (K), by Types 2025 & 2033
- Figure 9: North America Carpets & Rugs Revenue Share (%), by Types 2025 & 2033
- Figure 10: North America Carpets & Rugs Volume Share (%), by Types 2025 & 2033
- Figure 11: North America Carpets & Rugs Revenue (billion), by Country 2025 & 2033
- Figure 12: North America Carpets & Rugs Volume (K), by Country 2025 & 2033
- Figure 13: North America Carpets & Rugs Revenue Share (%), by Country 2025 & 2033
- Figure 14: North America Carpets & Rugs Volume Share (%), by Country 2025 & 2033
- Figure 15: South America Carpets & Rugs Revenue (billion), by Application 2025 & 2033
- Figure 16: South America Carpets & Rugs Volume (K), by Application 2025 & 2033
- Figure 17: South America Carpets & Rugs Revenue Share (%), by Application 2025 & 2033
- Figure 18: South America Carpets & Rugs Volume Share (%), by Application 2025 & 2033
- Figure 19: South America Carpets & Rugs Revenue (billion), by Types 2025 & 2033
- Figure 20: South America Carpets & Rugs Volume (K), by Types 2025 & 2033
- Figure 21: South America Carpets & Rugs Revenue Share (%), by Types 2025 & 2033
- Figure 22: South America Carpets & Rugs Volume Share (%), by Types 2025 & 2033
- Figure 23: South America Carpets & Rugs Revenue (billion), by Country 2025 & 2033
- Figure 24: South America Carpets & Rugs Volume (K), by Country 2025 & 2033
- Figure 25: South America Carpets & Rugs Revenue Share (%), by Country 2025 & 2033
- Figure 26: South America Carpets & Rugs Volume Share (%), by Country 2025 & 2033
- Figure 27: Europe Carpets & Rugs Revenue (billion), by Application 2025 & 2033
- Figure 28: Europe Carpets & Rugs Volume (K), by Application 2025 & 2033
- Figure 29: Europe Carpets & Rugs Revenue Share (%), by Application 2025 & 2033
- Figure 30: Europe Carpets & Rugs Volume Share (%), by Application 2025 & 2033
- Figure 31: Europe Carpets & Rugs Revenue (billion), by Types 2025 & 2033
- Figure 32: Europe Carpets & Rugs Volume (K), by Types 2025 & 2033
- Figure 33: Europe Carpets & Rugs Revenue Share (%), by Types 2025 & 2033
- Figure 34: Europe Carpets & Rugs Volume Share (%), by Types 2025 & 2033
- Figure 35: Europe Carpets & Rugs Revenue (billion), by Country 2025 & 2033
- Figure 36: Europe Carpets & Rugs Volume (K), by Country 2025 & 2033
- Figure 37: Europe Carpets & Rugs Revenue Share (%), by Country 2025 & 2033
- Figure 38: Europe Carpets & Rugs Volume Share (%), by Country 2025 & 2033
- Figure 39: Middle East & Africa Carpets & Rugs Revenue (billion), by Application 2025 & 2033
- Figure 40: Middle East & Africa Carpets & Rugs Volume (K), by Application 2025 & 2033
- Figure 41: Middle East & Africa Carpets & Rugs Revenue Share (%), by Application 2025 & 2033
- Figure 42: Middle East & Africa Carpets & Rugs Volume Share (%), by Application 2025 & 2033
- Figure 43: Middle East & Africa Carpets & Rugs Revenue (billion), by Types 2025 & 2033
- Figure 44: Middle East & Africa Carpets & Rugs Volume (K), by Types 2025 & 2033
- Figure 45: Middle East & Africa Carpets & Rugs Revenue Share (%), by Types 2025 & 2033
- Figure 46: Middle East & Africa Carpets & Rugs Volume Share (%), by Types 2025 & 2033
- Figure 47: Middle East & Africa Carpets & Rugs Revenue (billion), by Country 2025 & 2033
- Figure 48: Middle East & Africa Carpets & Rugs Volume (K), by Country 2025 & 2033
- Figure 49: Middle East & Africa Carpets & Rugs Revenue Share (%), by Country 2025 & 2033
- Figure 50: Middle East & Africa Carpets & Rugs Volume Share (%), by Country 2025 & 2033
- Figure 51: Asia Pacific Carpets & Rugs Revenue (billion), by Application 2025 & 2033
- Figure 52: Asia Pacific Carpets & Rugs Volume (K), by Application 2025 & 2033
- Figure 53: Asia Pacific Carpets & Rugs Revenue Share (%), by Application 2025 & 2033
- Figure 54: Asia Pacific Carpets & Rugs Volume Share (%), by Application 2025 & 2033
- Figure 55: Asia Pacific Carpets & Rugs Revenue (billion), by Types 2025 & 2033
- Figure 56: Asia Pacific Carpets & Rugs Volume (K), by Types 2025 & 2033
- Figure 57: Asia Pacific Carpets & Rugs Revenue Share (%), by Types 2025 & 2033
- Figure 58: Asia Pacific Carpets & Rugs Volume Share (%), by Types 2025 & 2033
- Figure 59: Asia Pacific Carpets & Rugs Revenue (billion), by Country 2025 & 2033
- Figure 60: Asia Pacific Carpets & Rugs Volume (K), by Country 2025 & 2033
- Figure 61: Asia Pacific Carpets & Rugs Revenue Share (%), by Country 2025 & 2033
- Figure 62: Asia Pacific Carpets & Rugs Volume Share (%), by Country 2025 & 2033
List of Tables
- Table 1: Global Carpets & Rugs Revenue billion Forecast, by Application 2020 & 2033
- Table 2: Global Carpets & Rugs Volume K Forecast, by Application 2020 & 2033
- Table 3: Global Carpets & Rugs Revenue billion Forecast, by Types 2020 & 2033
- Table 4: Global Carpets & Rugs Volume K Forecast, by Types 2020 & 2033
- Table 5: Global Carpets & Rugs Revenue billion Forecast, by Region 2020 & 2033
- Table 6: Global Carpets & Rugs Volume K Forecast, by Region 2020 & 2033
- Table 7: Global Carpets & Rugs Revenue billion Forecast, by Application 2020 & 2033
- Table 8: Global Carpets & Rugs Volume K Forecast, by Application 2020 & 2033
- Table 9: Global Carpets & Rugs Revenue billion Forecast, by Types 2020 & 2033
- Table 10: Global Carpets & Rugs Volume K Forecast, by Types 2020 & 2033
- Table 11: Global Carpets & Rugs Revenue billion Forecast, by Country 2020 & 2033
- Table 12: Global Carpets & Rugs Volume K Forecast, by Country 2020 & 2033
- Table 13: United States Carpets & Rugs Revenue (billion) Forecast, by Application 2020 & 2033
- Table 14: United States Carpets & Rugs Volume (K) Forecast, by Application 2020 & 2033
- Table 15: Canada Carpets & Rugs Revenue (billion) Forecast, by Application 2020 & 2033
- Table 16: Canada Carpets & Rugs Volume (K) Forecast, by Application 2020 & 2033
- Table 17: Mexico Carpets & Rugs Revenue (billion) Forecast, by Application 2020 & 2033
- Table 18: Mexico Carpets & Rugs Volume (K) Forecast, by Application 2020 & 2033
- Table 19: Global Carpets & Rugs Revenue billion Forecast, by Application 2020 & 2033
- Table 20: Global Carpets & Rugs Volume K Forecast, by Application 2020 & 2033
- Table 21: Global Carpets & Rugs Revenue billion Forecast, by Types 2020 & 2033
- Table 22: Global Carpets & Rugs Volume K Forecast, by Types 2020 & 2033
- Table 23: Global Carpets & Rugs Revenue billion Forecast, by Country 2020 & 2033
- Table 24: Global Carpets & Rugs Volume K Forecast, by Country 2020 & 2033
- Table 25: Brazil Carpets & Rugs Revenue (billion) Forecast, by Application 2020 & 2033
- Table 26: Brazil Carpets & Rugs Volume (K) Forecast, by Application 2020 & 2033
- Table 27: Argentina Carpets & Rugs Revenue (billion) Forecast, by Application 2020 & 2033
- Table 28: Argentina Carpets & Rugs Volume (K) Forecast, by Application 2020 & 2033
- Table 29: Rest of South America Carpets & Rugs Revenue (billion) Forecast, by Application 2020 & 2033
- Table 30: Rest of South America Carpets & Rugs Volume (K) Forecast, by Application 2020 & 2033
- Table 31: Global Carpets & Rugs Revenue billion Forecast, by Application 2020 & 2033
- Table 32: Global Carpets & Rugs Volume K Forecast, by Application 2020 & 2033
- Table 33: Global Carpets & Rugs Revenue billion Forecast, by Types 2020 & 2033
- Table 34: Global Carpets & Rugs Volume K Forecast, by Types 2020 & 2033
- Table 35: Global Carpets & Rugs Revenue billion Forecast, by Country 2020 & 2033
- Table 36: Global Carpets & Rugs Volume K Forecast, by Country 2020 & 2033
- Table 37: United Kingdom Carpets & Rugs Revenue (billion) Forecast, by Application 2020 & 2033
- Table 38: United Kingdom Carpets & Rugs Volume (K) Forecast, by Application 2020 & 2033
- Table 39: Germany Carpets & Rugs Revenue (billion) Forecast, by Application 2020 & 2033
- Table 40: Germany Carpets & Rugs Volume (K) Forecast, by Application 2020 & 2033
- Table 41: France Carpets & Rugs Revenue (billion) Forecast, by Application 2020 & 2033
- Table 42: France Carpets & Rugs Volume (K) Forecast, by Application 2020 & 2033
- Table 43: Italy Carpets & Rugs Revenue (billion) Forecast, by Application 2020 & 2033
- Table 44: Italy Carpets & Rugs Volume (K) Forecast, by Application 2020 & 2033
- Table 45: Spain Carpets & Rugs Revenue (billion) Forecast, by Application 2020 & 2033
- Table 46: Spain Carpets & Rugs Volume (K) Forecast, by Application 2020 & 2033
- Table 47: Russia Carpets & Rugs Revenue (billion) Forecast, by Application 2020 & 2033
- Table 48: Russia Carpets & Rugs Volume (K) Forecast, by Application 2020 & 2033
- Table 49: Benelux Carpets & Rugs Revenue (billion) Forecast, by Application 2020 & 2033
- Table 50: Benelux Carpets & Rugs Volume (K) Forecast, by Application 2020 & 2033
- Table 51: Nordics Carpets & Rugs Revenue (billion) Forecast, by Application 2020 & 2033
- Table 52: Nordics Carpets & Rugs Volume (K) Forecast, by Application 2020 & 2033
- Table 53: Rest of Europe Carpets & Rugs Revenue (billion) Forecast, by Application 2020 & 2033
- Table 54: Rest of Europe Carpets & Rugs Volume (K) Forecast, by Application 2020 & 2033
- Table 55: Global Carpets & Rugs Revenue billion Forecast, by Application 2020 & 2033
- Table 56: Global Carpets & Rugs Volume K Forecast, by Application 2020 & 2033
- Table 57: Global Carpets & Rugs Revenue billion Forecast, by Types 2020 & 2033
- Table 58: Global Carpets & Rugs Volume K Forecast, by Types 2020 & 2033
- Table 59: Global Carpets & Rugs Revenue billion Forecast, by Country 2020 & 2033
- Table 60: Global Carpets & Rugs Volume K Forecast, by Country 2020 & 2033
- Table 61: Turkey Carpets & Rugs Revenue (billion) Forecast, by Application 2020 & 2033
- Table 62: Turkey Carpets & Rugs Volume (K) Forecast, by Application 2020 & 2033
- Table 63: Israel Carpets & Rugs Revenue (billion) Forecast, by Application 2020 & 2033
- Table 64: Israel Carpets & Rugs Volume (K) Forecast, by Application 2020 & 2033
- Table 65: GCC Carpets & Rugs Revenue (billion) Forecast, by Application 2020 & 2033
- Table 66: GCC Carpets & Rugs Volume (K) Forecast, by Application 2020 & 2033
- Table 67: North Africa Carpets & Rugs Revenue (billion) Forecast, by Application 2020 & 2033
- Table 68: North Africa Carpets & Rugs Volume (K) Forecast, by Application 2020 & 2033
- Table 69: South Africa Carpets & Rugs Revenue (billion) Forecast, by Application 2020 & 2033
- Table 70: South Africa Carpets & Rugs Volume (K) Forecast, by Application 2020 & 2033
- Table 71: Rest of Middle East & Africa Carpets & Rugs Revenue (billion) Forecast, by Application 2020 & 2033
- Table 72: Rest of Middle East & Africa Carpets & Rugs Volume (K) Forecast, by Application 2020 & 2033
- Table 73: Global Carpets & Rugs Revenue billion Forecast, by Application 2020 & 2033
- Table 74: Global Carpets & Rugs Volume K Forecast, by Application 2020 & 2033
- Table 75: Global Carpets & Rugs Revenue billion Forecast, by Types 2020 & 2033
- Table 76: Global Carpets & Rugs Volume K Forecast, by Types 2020 & 2033
- Table 77: Global Carpets & Rugs Revenue billion Forecast, by Country 2020 & 2033
- Table 78: Global Carpets & Rugs Volume K Forecast, by Country 2020 & 2033
- Table 79: China Carpets & Rugs Revenue (billion) Forecast, by Application 2020 & 2033
- Table 80: China Carpets & Rugs Volume (K) Forecast, by Application 2020 & 2033
- Table 81: India Carpets & Rugs Revenue (billion) Forecast, by Application 2020 & 2033
- Table 82: India Carpets & Rugs Volume (K) Forecast, by Application 2020 & 2033
- Table 83: Japan Carpets & Rugs Revenue (billion) Forecast, by Application 2020 & 2033
- Table 84: Japan Carpets & Rugs Volume (K) Forecast, by Application 2020 & 2033
- Table 85: South Korea Carpets & Rugs Revenue (billion) Forecast, by Application 2020 & 2033
- Table 86: South Korea Carpets & Rugs Volume (K) Forecast, by Application 2020 & 2033
- Table 87: ASEAN Carpets & Rugs Revenue (billion) Forecast, by Application 2020 & 2033
- Table 88: ASEAN Carpets & Rugs Volume (K) Forecast, by Application 2020 & 2033
- Table 89: Oceania Carpets & Rugs Revenue (billion) Forecast, by Application 2020 & 2033
- Table 90: Oceania Carpets & Rugs Volume (K) Forecast, by Application 2020 & 2033
- Table 91: Rest of Asia Pacific Carpets & Rugs Revenue (billion) Forecast, by Application 2020 & 2033
- Table 92: Rest of Asia Pacific Carpets & Rugs Volume (K) Forecast, by Application 2020 & 2033
Frequently Asked Questions
1. What is the projected Compound Annual Growth Rate (CAGR) of the Carpets & Rugs?
The projected CAGR is approximately 11.08%.
2. Which companies are prominent players in the Carpets & Rugs?
Key companies in the market include Mohawk Industries Inc., Shaw Industries Group, Inc., Tarkett S.A., Lowe’s Companies, Inc., Interface Inc., Dixie Group, Inc., Oriental Weavers Company for Carpet., Tai Ping Carpets International Limited, Victoria PLC, The Home Depot, Inc., Mannington Mills, Inc., Beaulieu International Group, Ikea Group, Engineered Floors LLC, Royalty Carpet Mills, Inc., Stark Carpet Corp., Invista, Milliken & Company, Kraus Carpet Mills Ltd., Couristan, Inc., ABBey Carpet & Floor, Axminster Carpets Ltd, Floor Coverings International, Avalanche Flooring, Inc., Foamex International Inc.
3. What are the main segments of the Carpets & Rugs?
The market segments include Application, Types.
4. Can you provide details about the market size?
The market size is estimated to be USD 64.19 billion as of 2022.
5. What are some drivers contributing to market growth?
N/A
6. What are the notable trends driving market growth?
N/A
7. Are there any restraints impacting market growth?
N/A
8. Can you provide examples of recent developments in the market?
N/A
9. What pricing options are available for accessing the report?
Pricing options include single-user, multi-user, and enterprise licenses priced at USD 3350.00, USD 5025.00, and USD 6700.00 respectively.
10. Is the market size provided in terms of value or volume?
The market size is provided in terms of value, measured in billion and volume, measured in K.
11. Are there any specific market keywords associated with the report?
Yes, the market keyword associated with the report is "Carpets & Rugs," which aids in identifying and referencing the specific market segment covered.
12. How do I determine which pricing option suits my needs best?
The pricing options vary based on user requirements and access needs. Individual users may opt for single-user licenses, while businesses requiring broader access may choose multi-user or enterprise licenses for cost-effective access to the report.
13. Are there any additional resources or data provided in the Carpets & Rugs report?
While the report offers comprehensive insights, it's advisable to review the specific contents or supplementary materials provided to ascertain if additional resources or data are available.
14. How can I stay updated on further developments or reports in the Carpets & Rugs?
To stay informed about further developments, trends, and reports in the Carpets & Rugs, consider subscribing to industry newsletters, following relevant companies and organizations, or regularly checking reputable industry news sources and publications.
Methodology
Step 1 - Identification of Relevant Samples Size from Population Database


Step 2 - Approaches for Defining Global Market Size (Value, Volume* & Price*)

Note*: In applicable scenarios
Step 3 - Data Sources
Primary Research
- Web Analytics
- Survey Reports
- Research Institute
- Latest Research Reports
- Opinion Leaders
Secondary Research
- Annual Reports
- White Paper
- Latest Press Release
- Industry Association
- Paid Database
- Investor Presentations

Step 4 - Data Triangulation
Involves using different sources of information in order to increase the validity of a study
These sources are likely to be stakeholders in a program - participants, other researchers, program staff, other community members, and so on.
Then we put all data in single framework & apply various statistical tools to find out the dynamic on the market.
During the analysis stage, feedback from the stakeholder groups would be compared to determine areas of agreement as well as areas of divergence