

Key Insights
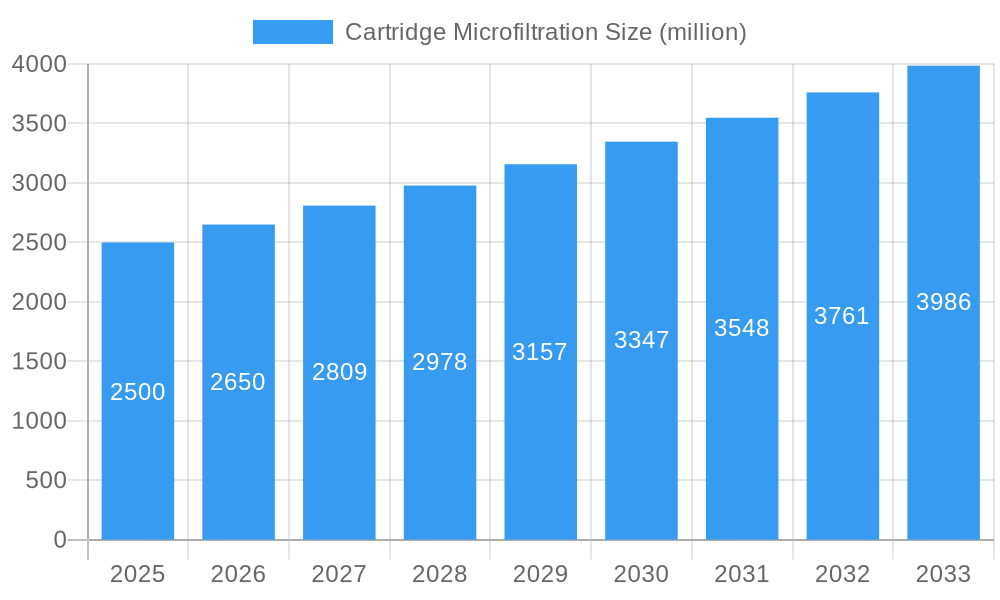
The cartridge microfiltration market is poised for significant expansion, driven by escalating demand across critical sectors. Key growth catalysts include the heightened adoption of microfiltration in pharmaceutical manufacturing for sterile filtration and purification, the imperative for purified water in food and beverage processing and wastewater treatment, and the burgeoning bioprocessing industry's need for high-purity fluid handling. Technological advancements enhancing filter efficacy, flow rates, and longevity are further propelling market dynamics. The global cartridge microfiltration market is estimated at $13.21 billion in the base year 2025, projected to grow at a compound annual growth rate (CAGR) of 7.94% through 2033.
Cartridge Microfiltration Market Size (In Billion)
Market growth faces potential headwinds from volatile raw material costs, rigorous regulatory mandates concerning filter materials and production, and intensified competition. Nevertheless, continuous innovation in membrane technology, the development of eco-friendly filter materials, and an increasing emphasis on operational efficiency are anticipated to counteract these challenges. Market segmentation is primarily based on application (pharmaceuticals, water treatment, food & beverage, etc.), filter material, and geography. Leading market participants, including Merck Millipore, Pall Corporation, and Sartorius Group, command a substantial share due to their brand equity and extensive distribution channels. Future market success hinges on sustained innovation, strategic alliances, and adaptive responses to evolving regulatory frameworks.
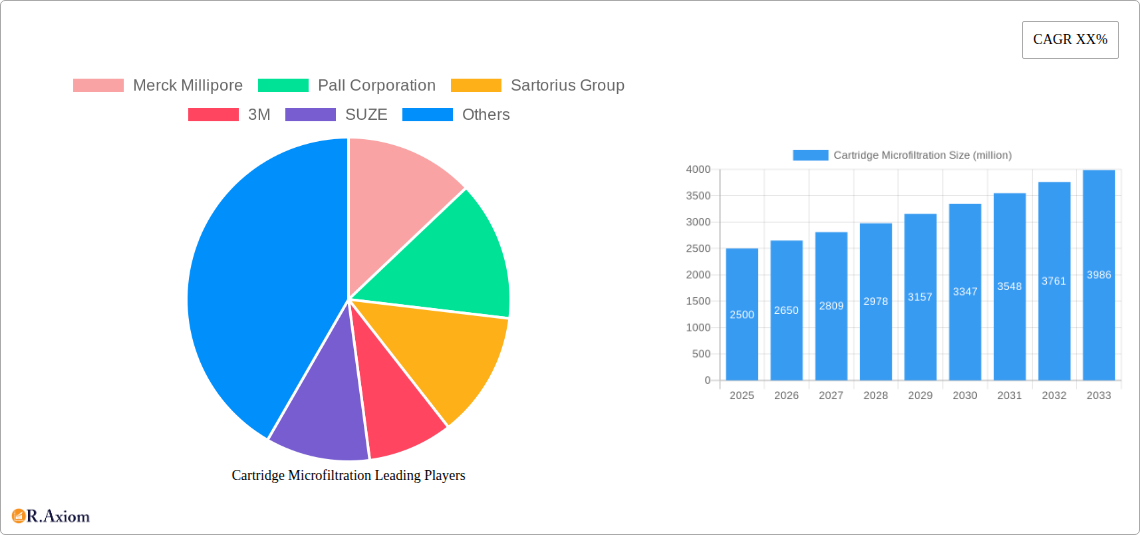
Cartridge Microfiltration Company Market Share
Cartridge Microfiltration Market Report: 2019-2033
This comprehensive report provides a detailed analysis of the global Cartridge Microfiltration market, offering invaluable insights for industry stakeholders, investors, and strategic decision-makers. Covering the period from 2019 to 2033, with a base year of 2025 and a forecast period from 2025 to 2033, this report leverages extensive data and expert analysis to illuminate market trends, opportunities, and challenges. The report projects a xx million USD market value by 2033, showcasing significant growth potential within this critical sector.
Cartridge Microfiltration Market Concentration & Innovation
The Cartridge Microfiltration market exhibits a moderately concentrated landscape, with key players such as Merck Millipore, Pall Corporation, Sartorius Group, and 3M commanding significant market share. The combined market share of the top five players is estimated at xx%, reflecting a competitive yet consolidated market structure. Innovation is a key driver, fueled by increasing demand for advanced filtration technologies across diverse applications. Regulatory frameworks, particularly concerning environmental compliance and product safety, significantly influence market dynamics. Substitute products, such as ultrafiltration and nanofiltration, pose a competitive threat, necessitating continuous technological advancements. End-user trends, including the growing adoption of cartridge microfiltration in pharmaceutical and biotechnology sectors, drive market growth. M&A activities have played a notable role in shaping market dynamics; for example, the xx million USD acquisition of [Company A] by [Company B] in [Year] reshaped competitive landscapes. Specific deal values are not consistently available and are hence indicated as xx for many instances.
- Market Share: Top 5 players: xx%
- M&A Deal Values: xx million USD (estimated average)
- Key Innovation Areas: Membrane materials, automated systems, and enhanced efficiency.
Cartridge Microfiltration Industry Trends & Insights
The global Cartridge Microfiltration market is experiencing robust growth, driven by a CAGR of xx% during the forecast period (2025-2033). This growth is attributed to several factors, including the rising demand for clean water and process fluids across various industries. Technological advancements, such as the development of novel membrane materials and improved filtration processes, enhance the efficiency and cost-effectiveness of cartridge microfiltration systems. Consumer preferences increasingly favour sustainable and energy-efficient solutions, further propelling market growth. The competitive landscape is characterized by intense rivalry among established players and emerging entrants, leading to product innovation and pricing competition. Market penetration in developing economies remains relatively low, presenting significant growth opportunities. xx million USD is expected as the market size for 2025.
Dominant Markets & Segments in Cartridge Microfiltration
The North American region holds a dominant position in the global Cartridge Microfiltration market, accounting for approximately xx% of the total market share in 2025. This dominance is primarily attributed to the strong presence of major players, robust industrial infrastructure, and high adoption rates across various end-user industries, such as pharmaceuticals and food & beverages. The European market is also significant, accounting for xx%. Asia Pacific is expected to witness the highest growth rate during the forecast period due to rapid industrialization, rising disposable incomes, and increasing awareness of water quality.
- Key Drivers of North American Dominance:
- Robust industrial base
- Stringent environmental regulations
- High adoption in pharmaceuticals
- Presence of major players.
- Key Drivers of Growth in Asia-Pacific:
- Rapid industrialization
- Growing demand for clean water
- Increased investment in infrastructure
Cartridge Microfiltration Product Developments
Recent innovations in Cartridge Microfiltration include the development of membranes with enhanced permeability and fouling resistance. This leads to improved filtration efficiency, reduced operating costs, and increased lifespan. Advanced materials and improved designs enhance compatibility with various applications and further broaden market appeal. These advancements have led to increased market penetration across multiple sectors, from water treatment to biopharmaceutical processing.
Report Scope & Segmentation Analysis
This report segments the Cartridge Microfiltration market based on several key factors: by type (e.g., depth filters, membrane filters); by application (e.g., water treatment, pharmaceuticals, food & beverages); and by region (North America, Europe, Asia-Pacific, etc.). Growth projections vary across these segments, with the pharmaceutical application segment expected to experience the highest CAGR due to stringent quality standards and rising demand. Market size projections show a significant increase across all segments, illustrating the overall growth potential of the market. Competitive dynamics vary within each segment, influencing pricing strategies and market share distribution. Each segment is projected to reach xx million USD by 2033.
Key Drivers of Cartridge Microfiltration Growth
Technological advancements, including the development of new membrane materials and improved filtration processes, are a primary driver of growth. Stringent environmental regulations mandate the use of advanced filtration technologies, fueling market demand. The increasing demand for clean water and process fluids across various industries, particularly pharmaceuticals and food & beverage manufacturing, further boosts market growth. Economic growth in developing nations is also creating opportunities for market expansion.
Challenges in the Cartridge Microfiltration Sector
The Cartridge Microfiltration sector faces several challenges, including fluctuating raw material prices, impacting production costs. Supply chain disruptions and geopolitical instability can pose significant risks. Intense competition from established and emerging players necessitates continuous innovation and cost optimization. Regulatory hurdles, varying across different regions, can create compliance complexities. These factors collectively impact market growth and profitability.
Emerging Opportunities in Cartridge Microfiltration
Emerging opportunities lie in the development of more sustainable and energy-efficient filtration technologies. The increasing demand for high-purity water in various industrial applications and growing concerns over water scarcity presents significant growth avenues. New applications, such as in the treatment of industrial wastewater, offer potential market expansion. Expanding into developing economies with less-developed infrastructure provides opportunities for market penetration.
Leading Players in the Cartridge Microfiltration Market
- Merck Millipore
- Pall Corporation
- Sartorius Group
- 3M
- SUZE
- Graver Technologies
- Parker Hannifin
- Porvair Filtration Group
- Donaldson
- BEA Technologies
- Critical Process Filtration
- EATON
- Fujifilm
- Global Filter LLC
- Wolftechnik
- Cobetter
- Pureach
- Kumar Process
Key Developments in Cartridge Microfiltration Industry
- 2022 Q3: Merck Millipore launched a new line of high-performance cartridge filters.
- 2021 Q4: Pall Corporation announced a strategic partnership with [Partner Name] to expand its market reach.
- 2020 Q2: Sartorius Group acquired [Acquired Company] to strengthen its position in the market.
- (Further key developments will be listed in the full report)
Strategic Outlook for Cartridge Microfiltration Market
The Cartridge Microfiltration market is poised for continued growth, driven by technological innovation, stringent regulations, and increasing demand across various sectors. Future market potential is significant, especially in emerging economies and new applications. Strategic partnerships, product diversification, and expansion into new markets will be crucial for success in this dynamic and competitive landscape. The market is anticipated to reach xx million USD by 2033, demonstrating strong and consistent growth throughout the forecast period.
Cartridge Microfiltration Segmentation
-
1. Application
- 1.1. Food and Beverages
- 1.2. Energy
- 1.3. Water & Wastewater
- 1.4. Chemical Industry
- 1.5. Others
-
2. Types
- 2.1. PP Type
- 2.2. PES Type
- 2.3. PTFE Type
- 2.4. Other
Cartridge Microfiltration Segmentation By Geography
-
1. North America
- 1.1. United States
- 1.2. Canada
- 1.3. Mexico
-
2. South America
- 2.1. Brazil
- 2.2. Argentina
- 2.3. Rest of South America
-
3. Europe
- 3.1. United Kingdom
- 3.2. Germany
- 3.3. France
- 3.4. Italy
- 3.5. Spain
- 3.6. Russia
- 3.7. Benelux
- 3.8. Nordics
- 3.9. Rest of Europe
-
4. Middle East & Africa
- 4.1. Turkey
- 4.2. Israel
- 4.3. GCC
- 4.4. North Africa
- 4.5. South Africa
- 4.6. Rest of Middle East & Africa
-
5. Asia Pacific
- 5.1. China
- 5.2. India
- 5.3. Japan
- 5.4. South Korea
- 5.5. ASEAN
- 5.6. Oceania
- 5.7. Rest of Asia Pacific

Cartridge Microfiltration Regional Market Share
Geographic Coverage of Cartridge Microfiltration
Cartridge Microfiltration REPORT HIGHLIGHTS
| Aspects | Details |
|---|---|
| Study Period | 2020-2034 |
| Base Year | 2025 |
| Estimated Year | 2026 |
| Forecast Period | 2026-2034 |
| Historical Period | 2020-2025 |
| Growth Rate | CAGR of 7.94% from 2020-2034 |
| Segmentation |
|
Table of Contents
- 1. Introduction
- 1.1. Research Scope
- 1.2. Market Segmentation
- 1.3. Research Methodology
- 1.4. Definitions and Assumptions
- 2. Executive Summary
- 2.1. Introduction
- 3. Market Dynamics
- 3.1. Introduction
- 3.2. Market Drivers
- 3.3. Market Restrains
- 3.4. Market Trends
- 4. Market Factor Analysis
- 4.1. Porters Five Forces
- 4.2. Supply/Value Chain
- 4.3. PESTEL analysis
- 4.4. Market Entropy
- 4.5. Patent/Trademark Analysis
- 5. Global Cartridge Microfiltration Analysis, Insights and Forecast, 2020-2032
- 5.1. Market Analysis, Insights and Forecast - by Application
- 5.1.1. Food and Beverages
- 5.1.2. Energy
- 5.1.3. Water & Wastewater
- 5.1.4. Chemical Industry
- 5.1.5. Others
- 5.2. Market Analysis, Insights and Forecast - by Types
- 5.2.1. PP Type
- 5.2.2. PES Type
- 5.2.3. PTFE Type
- 5.2.4. Other
- 5.3. Market Analysis, Insights and Forecast - by Region
- 5.3.1. North America
- 5.3.2. South America
- 5.3.3. Europe
- 5.3.4. Middle East & Africa
- 5.3.5. Asia Pacific
- 5.1. Market Analysis, Insights and Forecast - by Application
- 6. North America Cartridge Microfiltration Analysis, Insights and Forecast, 2020-2032
- 6.1. Market Analysis, Insights and Forecast - by Application
- 6.1.1. Food and Beverages
- 6.1.2. Energy
- 6.1.3. Water & Wastewater
- 6.1.4. Chemical Industry
- 6.1.5. Others
- 6.2. Market Analysis, Insights and Forecast - by Types
- 6.2.1. PP Type
- 6.2.2. PES Type
- 6.2.3. PTFE Type
- 6.2.4. Other
- 6.1. Market Analysis, Insights and Forecast - by Application
- 7. South America Cartridge Microfiltration Analysis, Insights and Forecast, 2020-2032
- 7.1. Market Analysis, Insights and Forecast - by Application
- 7.1.1. Food and Beverages
- 7.1.2. Energy
- 7.1.3. Water & Wastewater
- 7.1.4. Chemical Industry
- 7.1.5. Others
- 7.2. Market Analysis, Insights and Forecast - by Types
- 7.2.1. PP Type
- 7.2.2. PES Type
- 7.2.3. PTFE Type
- 7.2.4. Other
- 7.1. Market Analysis, Insights and Forecast - by Application
- 8. Europe Cartridge Microfiltration Analysis, Insights and Forecast, 2020-2032
- 8.1. Market Analysis, Insights and Forecast - by Application
- 8.1.1. Food and Beverages
- 8.1.2. Energy
- 8.1.3. Water & Wastewater
- 8.1.4. Chemical Industry
- 8.1.5. Others
- 8.2. Market Analysis, Insights and Forecast - by Types
- 8.2.1. PP Type
- 8.2.2. PES Type
- 8.2.3. PTFE Type
- 8.2.4. Other
- 8.1. Market Analysis, Insights and Forecast - by Application
- 9. Middle East & Africa Cartridge Microfiltration Analysis, Insights and Forecast, 2020-2032
- 9.1. Market Analysis, Insights and Forecast - by Application
- 9.1.1. Food and Beverages
- 9.1.2. Energy
- 9.1.3. Water & Wastewater
- 9.1.4. Chemical Industry
- 9.1.5. Others
- 9.2. Market Analysis, Insights and Forecast - by Types
- 9.2.1. PP Type
- 9.2.2. PES Type
- 9.2.3. PTFE Type
- 9.2.4. Other
- 9.1. Market Analysis, Insights and Forecast - by Application
- 10. Asia Pacific Cartridge Microfiltration Analysis, Insights and Forecast, 2020-2032
- 10.1. Market Analysis, Insights and Forecast - by Application
- 10.1.1. Food and Beverages
- 10.1.2. Energy
- 10.1.3. Water & Wastewater
- 10.1.4. Chemical Industry
- 10.1.5. Others
- 10.2. Market Analysis, Insights and Forecast - by Types
- 10.2.1. PP Type
- 10.2.2. PES Type
- 10.2.3. PTFE Type
- 10.2.4. Other
- 10.1. Market Analysis, Insights and Forecast - by Application
- 11. Competitive Analysis
- 11.1. Global Market Share Analysis 2025
- 11.2. Company Profiles
- 11.2.1 Merck Millipore
- 11.2.1.1. Overview
- 11.2.1.2. Products
- 11.2.1.3. SWOT Analysis
- 11.2.1.4. Recent Developments
- 11.2.1.5. Financials (Based on Availability)
- 11.2.2 Pall Corporation
- 11.2.2.1. Overview
- 11.2.2.2. Products
- 11.2.2.3. SWOT Analysis
- 11.2.2.4. Recent Developments
- 11.2.2.5. Financials (Based on Availability)
- 11.2.3 Sartorius Group
- 11.2.3.1. Overview
- 11.2.3.2. Products
- 11.2.3.3. SWOT Analysis
- 11.2.3.4. Recent Developments
- 11.2.3.5. Financials (Based on Availability)
- 11.2.4 3M
- 11.2.4.1. Overview
- 11.2.4.2. Products
- 11.2.4.3. SWOT Analysis
- 11.2.4.4. Recent Developments
- 11.2.4.5. Financials (Based on Availability)
- 11.2.5 SUZE
- 11.2.5.1. Overview
- 11.2.5.2. Products
- 11.2.5.3. SWOT Analysis
- 11.2.5.4. Recent Developments
- 11.2.5.5. Financials (Based on Availability)
- 11.2.6 Graver Technologies
- 11.2.6.1. Overview
- 11.2.6.2. Products
- 11.2.6.3. SWOT Analysis
- 11.2.6.4. Recent Developments
- 11.2.6.5. Financials (Based on Availability)
- 11.2.7 Parker Hannifin
- 11.2.7.1. Overview
- 11.2.7.2. Products
- 11.2.7.3. SWOT Analysis
- 11.2.7.4. Recent Developments
- 11.2.7.5. Financials (Based on Availability)
- 11.2.8 Porvair Filtration Group
- 11.2.8.1. Overview
- 11.2.8.2. Products
- 11.2.8.3. SWOT Analysis
- 11.2.8.4. Recent Developments
- 11.2.8.5. Financials (Based on Availability)
- 11.2.9 Donaldson
- 11.2.9.1. Overview
- 11.2.9.2. Products
- 11.2.9.3. SWOT Analysis
- 11.2.9.4. Recent Developments
- 11.2.9.5. Financials (Based on Availability)
- 11.2.10 BEA Technologies
- 11.2.10.1. Overview
- 11.2.10.2. Products
- 11.2.10.3. SWOT Analysis
- 11.2.10.4. Recent Developments
- 11.2.10.5. Financials (Based on Availability)
- 11.2.11 Critical Process Filtration
- 11.2.11.1. Overview
- 11.2.11.2. Products
- 11.2.11.3. SWOT Analysis
- 11.2.11.4. Recent Developments
- 11.2.11.5. Financials (Based on Availability)
- 11.2.12 EATON
- 11.2.12.1. Overview
- 11.2.12.2. Products
- 11.2.12.3. SWOT Analysis
- 11.2.12.4. Recent Developments
- 11.2.12.5. Financials (Based on Availability)
- 11.2.13 Fujifilm
- 11.2.13.1. Overview
- 11.2.13.2. Products
- 11.2.13.3. SWOT Analysis
- 11.2.13.4. Recent Developments
- 11.2.13.5. Financials (Based on Availability)
- 11.2.14 Global Filter LLC
- 11.2.14.1. Overview
- 11.2.14.2. Products
- 11.2.14.3. SWOT Analysis
- 11.2.14.4. Recent Developments
- 11.2.14.5. Financials (Based on Availability)
- 11.2.15 Wolftechnik
- 11.2.15.1. Overview
- 11.2.15.2. Products
- 11.2.15.3. SWOT Analysis
- 11.2.15.4. Recent Developments
- 11.2.15.5. Financials (Based on Availability)
- 11.2.16 Cobetter
- 11.2.16.1. Overview
- 11.2.16.2. Products
- 11.2.16.3. SWOT Analysis
- 11.2.16.4. Recent Developments
- 11.2.16.5. Financials (Based on Availability)
- 11.2.17 Pureach
- 11.2.17.1. Overview
- 11.2.17.2. Products
- 11.2.17.3. SWOT Analysis
- 11.2.17.4. Recent Developments
- 11.2.17.5. Financials (Based on Availability)
- 11.2.18 Kumar Process
- 11.2.18.1. Overview
- 11.2.18.2. Products
- 11.2.18.3. SWOT Analysis
- 11.2.18.4. Recent Developments
- 11.2.18.5. Financials (Based on Availability)
- 11.2.1 Merck Millipore
List of Figures
- Figure 1: Global Cartridge Microfiltration Revenue Breakdown (billion, %) by Region 2025 & 2033
- Figure 2: Global Cartridge Microfiltration Volume Breakdown (K, %) by Region 2025 & 2033
- Figure 3: North America Cartridge Microfiltration Revenue (billion), by Application 2025 & 2033
- Figure 4: North America Cartridge Microfiltration Volume (K), by Application 2025 & 2033
- Figure 5: North America Cartridge Microfiltration Revenue Share (%), by Application 2025 & 2033
- Figure 6: North America Cartridge Microfiltration Volume Share (%), by Application 2025 & 2033
- Figure 7: North America Cartridge Microfiltration Revenue (billion), by Types 2025 & 2033
- Figure 8: North America Cartridge Microfiltration Volume (K), by Types 2025 & 2033
- Figure 9: North America Cartridge Microfiltration Revenue Share (%), by Types 2025 & 2033
- Figure 10: North America Cartridge Microfiltration Volume Share (%), by Types 2025 & 2033
- Figure 11: North America Cartridge Microfiltration Revenue (billion), by Country 2025 & 2033
- Figure 12: North America Cartridge Microfiltration Volume (K), by Country 2025 & 2033
- Figure 13: North America Cartridge Microfiltration Revenue Share (%), by Country 2025 & 2033
- Figure 14: North America Cartridge Microfiltration Volume Share (%), by Country 2025 & 2033
- Figure 15: South America Cartridge Microfiltration Revenue (billion), by Application 2025 & 2033
- Figure 16: South America Cartridge Microfiltration Volume (K), by Application 2025 & 2033
- Figure 17: South America Cartridge Microfiltration Revenue Share (%), by Application 2025 & 2033
- Figure 18: South America Cartridge Microfiltration Volume Share (%), by Application 2025 & 2033
- Figure 19: South America Cartridge Microfiltration Revenue (billion), by Types 2025 & 2033
- Figure 20: South America Cartridge Microfiltration Volume (K), by Types 2025 & 2033
- Figure 21: South America Cartridge Microfiltration Revenue Share (%), by Types 2025 & 2033
- Figure 22: South America Cartridge Microfiltration Volume Share (%), by Types 2025 & 2033
- Figure 23: South America Cartridge Microfiltration Revenue (billion), by Country 2025 & 2033
- Figure 24: South America Cartridge Microfiltration Volume (K), by Country 2025 & 2033
- Figure 25: South America Cartridge Microfiltration Revenue Share (%), by Country 2025 & 2033
- Figure 26: South America Cartridge Microfiltration Volume Share (%), by Country 2025 & 2033
- Figure 27: Europe Cartridge Microfiltration Revenue (billion), by Application 2025 & 2033
- Figure 28: Europe Cartridge Microfiltration Volume (K), by Application 2025 & 2033
- Figure 29: Europe Cartridge Microfiltration Revenue Share (%), by Application 2025 & 2033
- Figure 30: Europe Cartridge Microfiltration Volume Share (%), by Application 2025 & 2033
- Figure 31: Europe Cartridge Microfiltration Revenue (billion), by Types 2025 & 2033
- Figure 32: Europe Cartridge Microfiltration Volume (K), by Types 2025 & 2033
- Figure 33: Europe Cartridge Microfiltration Revenue Share (%), by Types 2025 & 2033
- Figure 34: Europe Cartridge Microfiltration Volume Share (%), by Types 2025 & 2033
- Figure 35: Europe Cartridge Microfiltration Revenue (billion), by Country 2025 & 2033
- Figure 36: Europe Cartridge Microfiltration Volume (K), by Country 2025 & 2033
- Figure 37: Europe Cartridge Microfiltration Revenue Share (%), by Country 2025 & 2033
- Figure 38: Europe Cartridge Microfiltration Volume Share (%), by Country 2025 & 2033
- Figure 39: Middle East & Africa Cartridge Microfiltration Revenue (billion), by Application 2025 & 2033
- Figure 40: Middle East & Africa Cartridge Microfiltration Volume (K), by Application 2025 & 2033
- Figure 41: Middle East & Africa Cartridge Microfiltration Revenue Share (%), by Application 2025 & 2033
- Figure 42: Middle East & Africa Cartridge Microfiltration Volume Share (%), by Application 2025 & 2033
- Figure 43: Middle East & Africa Cartridge Microfiltration Revenue (billion), by Types 2025 & 2033
- Figure 44: Middle East & Africa Cartridge Microfiltration Volume (K), by Types 2025 & 2033
- Figure 45: Middle East & Africa Cartridge Microfiltration Revenue Share (%), by Types 2025 & 2033
- Figure 46: Middle East & Africa Cartridge Microfiltration Volume Share (%), by Types 2025 & 2033
- Figure 47: Middle East & Africa Cartridge Microfiltration Revenue (billion), by Country 2025 & 2033
- Figure 48: Middle East & Africa Cartridge Microfiltration Volume (K), by Country 2025 & 2033
- Figure 49: Middle East & Africa Cartridge Microfiltration Revenue Share (%), by Country 2025 & 2033
- Figure 50: Middle East & Africa Cartridge Microfiltration Volume Share (%), by Country 2025 & 2033
- Figure 51: Asia Pacific Cartridge Microfiltration Revenue (billion), by Application 2025 & 2033
- Figure 52: Asia Pacific Cartridge Microfiltration Volume (K), by Application 2025 & 2033
- Figure 53: Asia Pacific Cartridge Microfiltration Revenue Share (%), by Application 2025 & 2033
- Figure 54: Asia Pacific Cartridge Microfiltration Volume Share (%), by Application 2025 & 2033
- Figure 55: Asia Pacific Cartridge Microfiltration Revenue (billion), by Types 2025 & 2033
- Figure 56: Asia Pacific Cartridge Microfiltration Volume (K), by Types 2025 & 2033
- Figure 57: Asia Pacific Cartridge Microfiltration Revenue Share (%), by Types 2025 & 2033
- Figure 58: Asia Pacific Cartridge Microfiltration Volume Share (%), by Types 2025 & 2033
- Figure 59: Asia Pacific Cartridge Microfiltration Revenue (billion), by Country 2025 & 2033
- Figure 60: Asia Pacific Cartridge Microfiltration Volume (K), by Country 2025 & 2033
- Figure 61: Asia Pacific Cartridge Microfiltration Revenue Share (%), by Country 2025 & 2033
- Figure 62: Asia Pacific Cartridge Microfiltration Volume Share (%), by Country 2025 & 2033
List of Tables
- Table 1: Global Cartridge Microfiltration Revenue billion Forecast, by Application 2020 & 2033
- Table 2: Global Cartridge Microfiltration Volume K Forecast, by Application 2020 & 2033
- Table 3: Global Cartridge Microfiltration Revenue billion Forecast, by Types 2020 & 2033
- Table 4: Global Cartridge Microfiltration Volume K Forecast, by Types 2020 & 2033
- Table 5: Global Cartridge Microfiltration Revenue billion Forecast, by Region 2020 & 2033
- Table 6: Global Cartridge Microfiltration Volume K Forecast, by Region 2020 & 2033
- Table 7: Global Cartridge Microfiltration Revenue billion Forecast, by Application 2020 & 2033
- Table 8: Global Cartridge Microfiltration Volume K Forecast, by Application 2020 & 2033
- Table 9: Global Cartridge Microfiltration Revenue billion Forecast, by Types 2020 & 2033
- Table 10: Global Cartridge Microfiltration Volume K Forecast, by Types 2020 & 2033
- Table 11: Global Cartridge Microfiltration Revenue billion Forecast, by Country 2020 & 2033
- Table 12: Global Cartridge Microfiltration Volume K Forecast, by Country 2020 & 2033
- Table 13: United States Cartridge Microfiltration Revenue (billion) Forecast, by Application 2020 & 2033
- Table 14: United States Cartridge Microfiltration Volume (K) Forecast, by Application 2020 & 2033
- Table 15: Canada Cartridge Microfiltration Revenue (billion) Forecast, by Application 2020 & 2033
- Table 16: Canada Cartridge Microfiltration Volume (K) Forecast, by Application 2020 & 2033
- Table 17: Mexico Cartridge Microfiltration Revenue (billion) Forecast, by Application 2020 & 2033
- Table 18: Mexico Cartridge Microfiltration Volume (K) Forecast, by Application 2020 & 2033
- Table 19: Global Cartridge Microfiltration Revenue billion Forecast, by Application 2020 & 2033
- Table 20: Global Cartridge Microfiltration Volume K Forecast, by Application 2020 & 2033
- Table 21: Global Cartridge Microfiltration Revenue billion Forecast, by Types 2020 & 2033
- Table 22: Global Cartridge Microfiltration Volume K Forecast, by Types 2020 & 2033
- Table 23: Global Cartridge Microfiltration Revenue billion Forecast, by Country 2020 & 2033
- Table 24: Global Cartridge Microfiltration Volume K Forecast, by Country 2020 & 2033
- Table 25: Brazil Cartridge Microfiltration Revenue (billion) Forecast, by Application 2020 & 2033
- Table 26: Brazil Cartridge Microfiltration Volume (K) Forecast, by Application 2020 & 2033
- Table 27: Argentina Cartridge Microfiltration Revenue (billion) Forecast, by Application 2020 & 2033
- Table 28: Argentina Cartridge Microfiltration Volume (K) Forecast, by Application 2020 & 2033
- Table 29: Rest of South America Cartridge Microfiltration Revenue (billion) Forecast, by Application 2020 & 2033
- Table 30: Rest of South America Cartridge Microfiltration Volume (K) Forecast, by Application 2020 & 2033
- Table 31: Global Cartridge Microfiltration Revenue billion Forecast, by Application 2020 & 2033
- Table 32: Global Cartridge Microfiltration Volume K Forecast, by Application 2020 & 2033
- Table 33: Global Cartridge Microfiltration Revenue billion Forecast, by Types 2020 & 2033
- Table 34: Global Cartridge Microfiltration Volume K Forecast, by Types 2020 & 2033
- Table 35: Global Cartridge Microfiltration Revenue billion Forecast, by Country 2020 & 2033
- Table 36: Global Cartridge Microfiltration Volume K Forecast, by Country 2020 & 2033
- Table 37: United Kingdom Cartridge Microfiltration Revenue (billion) Forecast, by Application 2020 & 2033
- Table 38: United Kingdom Cartridge Microfiltration Volume (K) Forecast, by Application 2020 & 2033
- Table 39: Germany Cartridge Microfiltration Revenue (billion) Forecast, by Application 2020 & 2033
- Table 40: Germany Cartridge Microfiltration Volume (K) Forecast, by Application 2020 & 2033
- Table 41: France Cartridge Microfiltration Revenue (billion) Forecast, by Application 2020 & 2033
- Table 42: France Cartridge Microfiltration Volume (K) Forecast, by Application 2020 & 2033
- Table 43: Italy Cartridge Microfiltration Revenue (billion) Forecast, by Application 2020 & 2033
- Table 44: Italy Cartridge Microfiltration Volume (K) Forecast, by Application 2020 & 2033
- Table 45: Spain Cartridge Microfiltration Revenue (billion) Forecast, by Application 2020 & 2033
- Table 46: Spain Cartridge Microfiltration Volume (K) Forecast, by Application 2020 & 2033
- Table 47: Russia Cartridge Microfiltration Revenue (billion) Forecast, by Application 2020 & 2033
- Table 48: Russia Cartridge Microfiltration Volume (K) Forecast, by Application 2020 & 2033
- Table 49: Benelux Cartridge Microfiltration Revenue (billion) Forecast, by Application 2020 & 2033
- Table 50: Benelux Cartridge Microfiltration Volume (K) Forecast, by Application 2020 & 2033
- Table 51: Nordics Cartridge Microfiltration Revenue (billion) Forecast, by Application 2020 & 2033
- Table 52: Nordics Cartridge Microfiltration Volume (K) Forecast, by Application 2020 & 2033
- Table 53: Rest of Europe Cartridge Microfiltration Revenue (billion) Forecast, by Application 2020 & 2033
- Table 54: Rest of Europe Cartridge Microfiltration Volume (K) Forecast, by Application 2020 & 2033
- Table 55: Global Cartridge Microfiltration Revenue billion Forecast, by Application 2020 & 2033
- Table 56: Global Cartridge Microfiltration Volume K Forecast, by Application 2020 & 2033
- Table 57: Global Cartridge Microfiltration Revenue billion Forecast, by Types 2020 & 2033
- Table 58: Global Cartridge Microfiltration Volume K Forecast, by Types 2020 & 2033
- Table 59: Global Cartridge Microfiltration Revenue billion Forecast, by Country 2020 & 2033
- Table 60: Global Cartridge Microfiltration Volume K Forecast, by Country 2020 & 2033
- Table 61: Turkey Cartridge Microfiltration Revenue (billion) Forecast, by Application 2020 & 2033
- Table 62: Turkey Cartridge Microfiltration Volume (K) Forecast, by Application 2020 & 2033
- Table 63: Israel Cartridge Microfiltration Revenue (billion) Forecast, by Application 2020 & 2033
- Table 64: Israel Cartridge Microfiltration Volume (K) Forecast, by Application 2020 & 2033
- Table 65: GCC Cartridge Microfiltration Revenue (billion) Forecast, by Application 2020 & 2033
- Table 66: GCC Cartridge Microfiltration Volume (K) Forecast, by Application 2020 & 2033
- Table 67: North Africa Cartridge Microfiltration Revenue (billion) Forecast, by Application 2020 & 2033
- Table 68: North Africa Cartridge Microfiltration Volume (K) Forecast, by Application 2020 & 2033
- Table 69: South Africa Cartridge Microfiltration Revenue (billion) Forecast, by Application 2020 & 2033
- Table 70: South Africa Cartridge Microfiltration Volume (K) Forecast, by Application 2020 & 2033
- Table 71: Rest of Middle East & Africa Cartridge Microfiltration Revenue (billion) Forecast, by Application 2020 & 2033
- Table 72: Rest of Middle East & Africa Cartridge Microfiltration Volume (K) Forecast, by Application 2020 & 2033
- Table 73: Global Cartridge Microfiltration Revenue billion Forecast, by Application 2020 & 2033
- Table 74: Global Cartridge Microfiltration Volume K Forecast, by Application 2020 & 2033
- Table 75: Global Cartridge Microfiltration Revenue billion Forecast, by Types 2020 & 2033
- Table 76: Global Cartridge Microfiltration Volume K Forecast, by Types 2020 & 2033
- Table 77: Global Cartridge Microfiltration Revenue billion Forecast, by Country 2020 & 2033
- Table 78: Global Cartridge Microfiltration Volume K Forecast, by Country 2020 & 2033
- Table 79: China Cartridge Microfiltration Revenue (billion) Forecast, by Application 2020 & 2033
- Table 80: China Cartridge Microfiltration Volume (K) Forecast, by Application 2020 & 2033
- Table 81: India Cartridge Microfiltration Revenue (billion) Forecast, by Application 2020 & 2033
- Table 82: India Cartridge Microfiltration Volume (K) Forecast, by Application 2020 & 2033
- Table 83: Japan Cartridge Microfiltration Revenue (billion) Forecast, by Application 2020 & 2033
- Table 84: Japan Cartridge Microfiltration Volume (K) Forecast, by Application 2020 & 2033
- Table 85: South Korea Cartridge Microfiltration Revenue (billion) Forecast, by Application 2020 & 2033
- Table 86: South Korea Cartridge Microfiltration Volume (K) Forecast, by Application 2020 & 2033
- Table 87: ASEAN Cartridge Microfiltration Revenue (billion) Forecast, by Application 2020 & 2033
- Table 88: ASEAN Cartridge Microfiltration Volume (K) Forecast, by Application 2020 & 2033
- Table 89: Oceania Cartridge Microfiltration Revenue (billion) Forecast, by Application 2020 & 2033
- Table 90: Oceania Cartridge Microfiltration Volume (K) Forecast, by Application 2020 & 2033
- Table 91: Rest of Asia Pacific Cartridge Microfiltration Revenue (billion) Forecast, by Application 2020 & 2033
- Table 92: Rest of Asia Pacific Cartridge Microfiltration Volume (K) Forecast, by Application 2020 & 2033
Frequently Asked Questions
1. What is the projected Compound Annual Growth Rate (CAGR) of the Cartridge Microfiltration?
The projected CAGR is approximately 7.94%.
2. Which companies are prominent players in the Cartridge Microfiltration?
Key companies in the market include Merck Millipore, Pall Corporation, Sartorius Group, 3M, SUZE, Graver Technologies, Parker Hannifin, Porvair Filtration Group, Donaldson, BEA Technologies, Critical Process Filtration, EATON, Fujifilm, Global Filter LLC, Wolftechnik, Cobetter, Pureach, Kumar Process.
3. What are the main segments of the Cartridge Microfiltration?
The market segments include Application, Types.
4. Can you provide details about the market size?
The market size is estimated to be USD 13.21 billion as of 2022.
5. What are some drivers contributing to market growth?
N/A
6. What are the notable trends driving market growth?
N/A
7. Are there any restraints impacting market growth?
N/A
8. Can you provide examples of recent developments in the market?
N/A
9. What pricing options are available for accessing the report?
Pricing options include single-user, multi-user, and enterprise licenses priced at USD 3350.00, USD 5025.00, and USD 6700.00 respectively.
10. Is the market size provided in terms of value or volume?
The market size is provided in terms of value, measured in billion and volume, measured in K.
11. Are there any specific market keywords associated with the report?
Yes, the market keyword associated with the report is "Cartridge Microfiltration," which aids in identifying and referencing the specific market segment covered.
12. How do I determine which pricing option suits my needs best?
The pricing options vary based on user requirements and access needs. Individual users may opt for single-user licenses, while businesses requiring broader access may choose multi-user or enterprise licenses for cost-effective access to the report.
13. Are there any additional resources or data provided in the Cartridge Microfiltration report?
While the report offers comprehensive insights, it's advisable to review the specific contents or supplementary materials provided to ascertain if additional resources or data are available.
14. How can I stay updated on further developments or reports in the Cartridge Microfiltration?
To stay informed about further developments, trends, and reports in the Cartridge Microfiltration, consider subscribing to industry newsletters, following relevant companies and organizations, or regularly checking reputable industry news sources and publications.
Methodology
Step 1 - Identification of Relevant Samples Size from Population Database


Step 2 - Approaches for Defining Global Market Size (Value, Volume* & Price*)

Note*: In applicable scenarios
Step 3 - Data Sources
Primary Research
- Web Analytics
- Survey Reports
- Research Institute
- Latest Research Reports
- Opinion Leaders
Secondary Research
- Annual Reports
- White Paper
- Latest Press Release
- Industry Association
- Paid Database
- Investor Presentations

Step 4 - Data Triangulation
Involves using different sources of information in order to increase the validity of a study
These sources are likely to be stakeholders in a program - participants, other researchers, program staff, other community members, and so on.
Then we put all data in single framework & apply various statistical tools to find out the dynamic on the market.
During the analysis stage, feedback from the stakeholder groups would be compared to determine areas of agreement as well as areas of divergence