Key Insights
The global catalyst carrier market is experiencing robust growth, driven by the increasing demand for efficient and sustainable chemical processes across various industries. The market's Compound Annual Growth Rate (CAGR) exceeding 5.0% from 2019-2033 indicates a significant expansion, projected to reach a substantial market size. This growth is fueled by several key factors: the rising adoption of advanced catalysts in refining and petrochemical sectors, the escalating demand for environmentally friendly catalysts in pollution control, and the growing investments in research and development for new catalyst carrier materials with enhanced properties. Major players like Cabot Corporation, CeramTec, and Saint-Gobain are actively contributing to this market expansion through continuous innovation and strategic partnerships. The market is segmented based on material type (e.g., alumina, silica, zeolites), application (e.g., automotive, petroleum refining, chemical production), and geography. Competition is intense, with companies focusing on product differentiation and cost optimization to gain market share. While regulatory changes and fluctuations in raw material prices pose potential challenges, the long-term outlook remains positive, driven by the continuing global demand for efficient and sustainable catalysis.
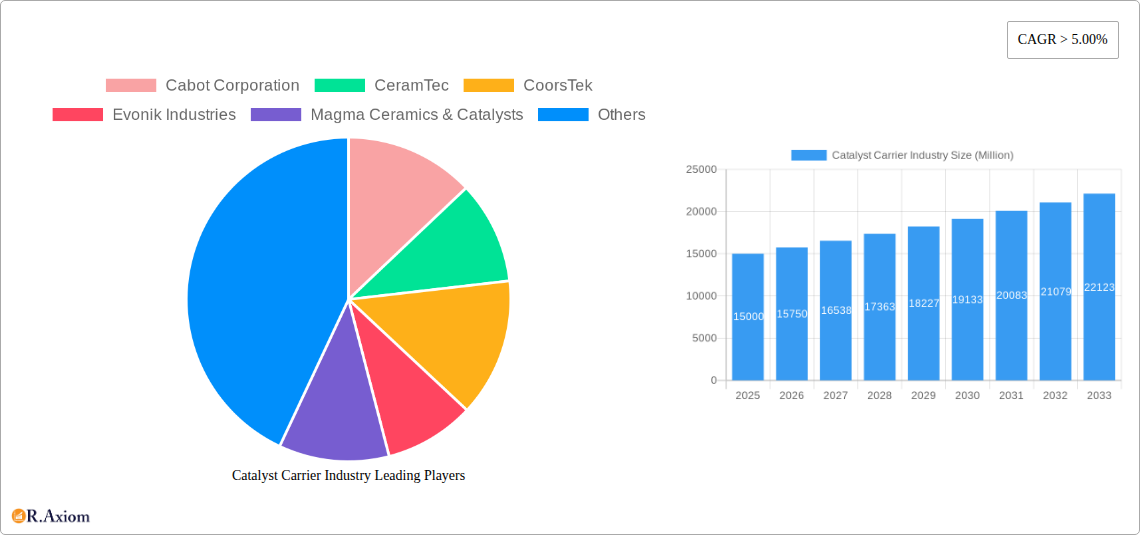
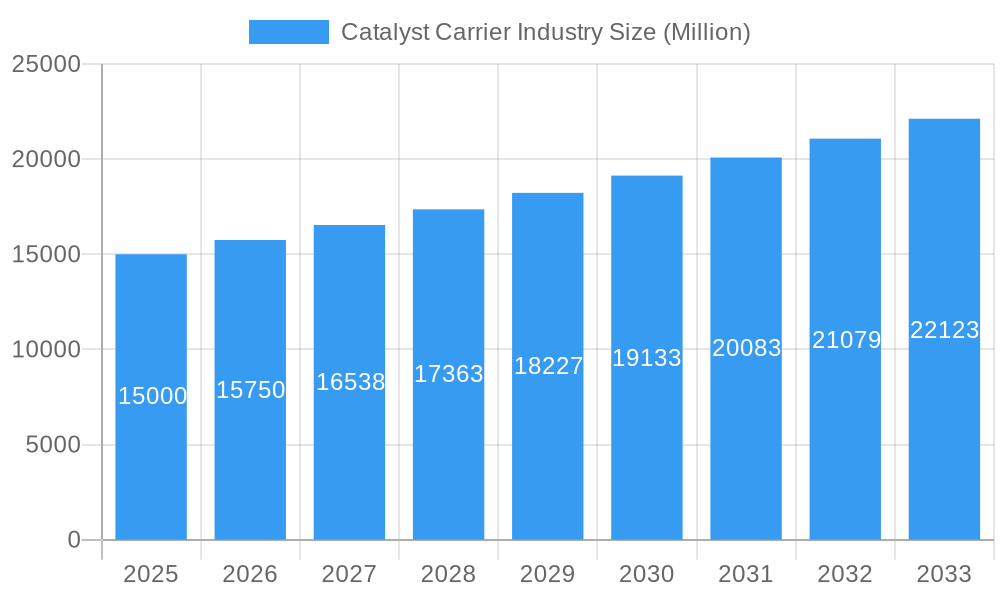
Catalyst Carrier Industry Market Size (In Billion)
The forecast period of 2025-2033 will see substantial growth in specific market segments. The increasing stringency of environmental regulations is boosting demand for high-performance catalysts in emission control applications, particularly in the automotive and energy sectors. Advancements in nanotechnology and materials science are also contributing to the development of novel catalyst carriers with improved properties such as increased surface area, enhanced thermal stability, and superior mechanical strength. Furthermore, the rising focus on circular economy principles is driving the demand for recyclable and sustainable catalyst carrier materials. This trend is likely to reshape the industry landscape, favoring manufacturers who prioritize sustainable practices and offer eco-friendly products. Regional growth is expected to be influenced by factors such as industrial development, government policies, and technological advancements in each region.
Catalyst Carrier Industry Company Market Share
Catalyst Carrier Industry Market Report: 2019-2033
This comprehensive report provides an in-depth analysis of the global Catalyst Carrier Industry, offering invaluable insights for stakeholders seeking to navigate this dynamic market. The study period spans from 2019 to 2033, with 2025 serving as both the base and estimated year. The report forecasts market trends from 2025 to 2033, leveraging data from the historical period of 2019-2024. Key players such as Cabot Corporation, CeramTec, CoorsTek, Evonik Industries, Magma Ceramics & Catalysts, Noritake Co Limited, Saint-Gobain, Sasol Performance Chemicals, ALMATIS AN OYAK GROUP COMPANY, and W R Grace & Co -Conn are analyzed, though this list is not exhaustive. The report segments the market to provide granular analysis, though specific segment details are provided within the report itself. The report projects a market value of $XX Million by 2033.
Catalyst Carrier Industry Market Concentration & Innovation
The Catalyst Carrier Industry exhibits a moderately concentrated market structure, with a few major players commanding significant market share. Cabot Corporation and Saint-Gobain, for example, collectively hold an estimated xx% market share in 2025. Innovation within the industry is driven by the need for improved catalytic efficiency, durability, and sustainability. Stringent environmental regulations are pushing manufacturers to develop more environmentally friendly catalyst carriers. Product substitutes, such as alternative catalyst support materials, pose a competitive challenge. However, the established performance and reliability of traditional catalyst carriers ensure ongoing market demand.
Key Metrics & Observations:
- Market Concentration: High, with top 5 players controlling approximately xx% of the market in 2025.
- M&A Activity: A moderate level of M&A activity has been observed in the past 5 years, with deal values totaling approximately $XX Million. These transactions primarily focused on expanding geographic reach and product portfolios.
- Innovation Focus: Enhanced catalytic activity, improved thermal stability, and reduced environmental impact.
- Regulatory Impact: Stringent emission standards are driving innovation towards more efficient and environmentally friendly catalyst carriers.
Catalyst Carrier Industry Industry Trends & Insights
The Catalyst Carrier Industry is witnessing robust growth, fueled by rising demand from key end-use sectors, including automotive, petrochemicals, and environmental remediation. The market is expected to exhibit a CAGR of xx% during the forecast period (2025-2033), reaching a projected value of $XX Million by 2033. This growth is driven by increasing industrialization, particularly in developing economies, leading to a surge in demand for catalysts across various applications. Technological advancements, such as the development of novel materials with enhanced catalytic properties, are further propelling market expansion. Growing environmental concerns are also boosting demand for catalysts that improve emission control and reduce pollution. Competitive dynamics are intensifying, with manufacturers focusing on product differentiation, technological advancements, and strategic partnerships to maintain their market positions.
Dominant Markets & Segments in Catalyst Carrier Industry
The Asia-Pacific region is currently the dominant market for catalyst carriers, driven by rapid industrialization and economic growth in countries such as China and India. This region accounts for approximately xx% of the global market in 2025. North America and Europe also represent significant markets.
Key Drivers of Dominance in Asia-Pacific:
- Rapid industrialization and urbanization.
- Significant investments in infrastructure development.
- Growing demand from the automotive and petrochemical industries.
- Favorable government policies supporting industrial growth.
Detailed Dominance Analysis: The region's substantial manufacturing base, coupled with expanding automotive and chemical sectors, fuels substantial demand for high-quality, efficient catalyst carriers. The region's strong economic growth provides a favorable environment for the expansion of the catalyst carrier market.
Catalyst Carrier Industry Product Developments
Recent innovations in catalyst carrier technology focus on improving catalytic activity, durability, and thermal stability. Advanced materials such as metal oxides, zeolites, and carbon-based materials are being explored to enhance performance. These developments cater to the growing need for highly efficient and environmentally friendly catalysts across various applications. The focus is also on developing tailored solutions to meet specific customer requirements.
Report Scope & Segmentation Analysis
The report segments the Catalyst Carrier Industry by type (e.g., alumina, silica, zeolites), application (e.g., automotive, petrochemical, environmental), and region (e.g., North America, Europe, Asia-Pacific). Each segment's growth trajectory, market size, and competitive dynamics are thoroughly examined. Growth projections vary across segments, with the automotive application expected to demonstrate significant growth due to stringent emission regulations and rising vehicle production.
Key Drivers of Catalyst Carrier Industry Growth
Several factors are driving growth in the Catalyst Carrier Industry. These include:
- Stringent environmental regulations promoting the use of emission control catalysts.
- Growing demand from the automotive, chemical, and refining industries.
- Advancements in catalyst technology leading to improved efficiency and performance.
- Expansion of industrial activities in developing economies.
Challenges in the Catalyst Carrier Industry Sector
Challenges facing the Catalyst Carrier Industry include:
- Fluctuations in raw material prices impacting production costs.
- Intense competition from existing and emerging players.
- Meeting stringent environmental regulations and standards.
- Supply chain disruptions potentially affecting production and delivery.
Emerging Opportunities in Catalyst Carrier Industry
Emerging opportunities include:
- Growing demand for catalysts in renewable energy applications.
- Development of novel catalyst carrier materials with enhanced properties.
- Expansion into new geographic markets with increasing industrialization.
- Collaboration and partnerships to develop innovative solutions.
Leading Players in the Catalyst Carrier Industry Market
- Cabot Corporation
- CeramTec
- CoorsTek
- Evonik Industries
- Magma Ceramics & Catalysts
- Noritake Co Limited
- Saint-Gobain
- Sasol Performance Chemicals
- ALMATIS AN OYAK GROUP COMPANY
- W R Grace & Co -Conn
Key Developments in Catalyst Carrier Industry Industry
- 2022 Q3: Evonik Industries launched a new line of high-performance catalyst carriers.
- 2023 Q1: Cabot Corporation announced a strategic partnership to expand its manufacturing capacity.
- 2024 Q2: A significant merger occurred in the industry, combining two leading players. (Specific details are within the full report)
Strategic Outlook for Catalyst Carrier Industry Market
The Catalyst Carrier Industry is poised for continued growth, driven by technological advancements, increasing industrial activity, and stringent environmental regulations. The focus on sustainability and the development of innovative catalyst carrier materials present significant opportunities for market expansion. Strategic partnerships, investments in R&D, and expansion into emerging markets are crucial for success in this competitive landscape.
Catalyst Carrier Industry Segmentation
-
1. Product Type
- 1.1. Ceramics
- 1.2. Activated Carbon
- 1.3. Zeolites
- 1.4. Other Product Types
-
2. Material Type
- 2.1. Alumina
- 2.2. Titania
- 2.3. Zirconia
- 2.4. Silica
- 2.5. Other Material Types
-
3. Shape
- 3.1. Sphere
- 3.2. Ring
- 3.3. Honeycomb
- 3.4. Other Shapes
-
4. End-user Industry
- 4.1. Oil and Gas
- 4.2. Chemical Manufacturing
- 4.3. Automotive
- 4.4. Pharmaceuticals
- 4.5. Other End-user Industries
Catalyst Carrier Industry Segmentation By Geography
-
1. Asia Pacific
- 1.1. China
- 1.2. India
- 1.3. Japan
- 1.4. South Korea
- 1.5. Rest of Asia Pacific
-
2. North America
- 2.1. United States
- 2.2. Canada
- 2.3. Mexico
-
3. Europe
- 3.1. Germany
- 3.2. United Kingdom
- 3.3. France
- 3.4. Italy
- 3.5. Rest of Europe
-
4. South America
- 4.1. Brazil
- 4.2. Argentina
- 4.3. Rest of South America
-
5. Middle East and Africa
- 5.1. Saudi Arabia
- 5.2. South Africa
- 5.3. Rest of Middle East and Africa
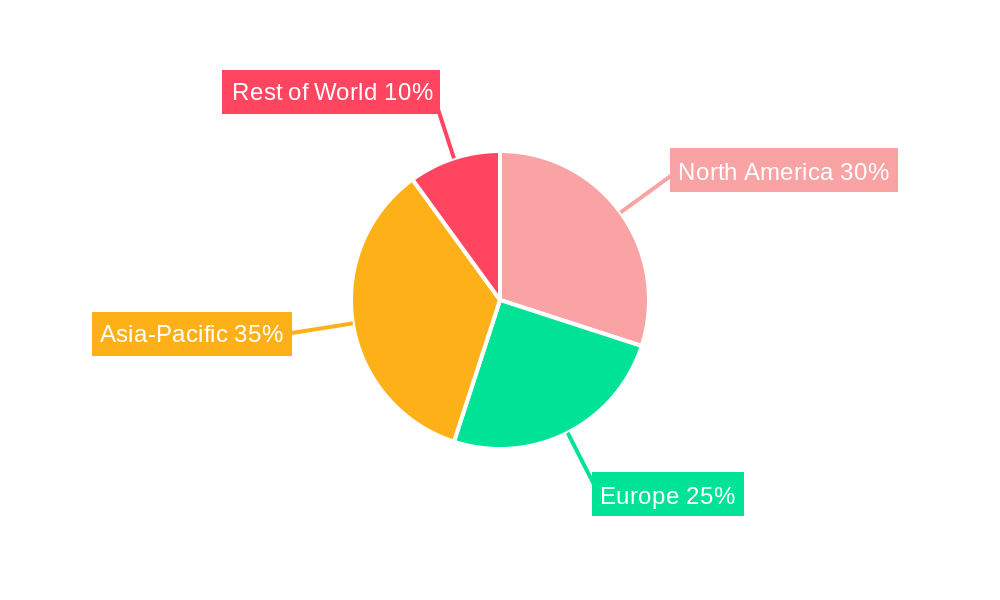
Catalyst Carrier Industry Regional Market Share
Geographic Coverage of Catalyst Carrier Industry
Catalyst Carrier Industry REPORT HIGHLIGHTS
| Aspects | Details |
|---|---|
| Study Period | 2020-2034 |
| Base Year | 2025 |
| Estimated Year | 2026 |
| Forecast Period | 2026-2034 |
| Historical Period | 2020-2025 |
| Growth Rate | CAGR of 4.8% from 2020-2034 |
| Segmentation |
|
Table of Contents
- 1. Introduction
- 1.1. Research Scope
- 1.2. Market Segmentation
- 1.3. Research Objective
- 1.4. Definitions and Assumptions
- 2. Executive Summary
- 2.1. Market Snapshot
- 3. Market Dynamics
- 3.1. Market Drivers
- 3.2. Market Restrains
- 3.3. Market Trends
- 3.4. Market Opportunities
- 4. Market Factor Analysis
- 4.1. Porters Five Forces
- 4.1.1. Bargaining Power of Suppliers
- 4.1.2. Bargaining Power of Buyers
- 4.1.3. Threat of New Entrants
- 4.1.4. Threat of Substitutes
- 4.1.5. Competitive Rivalry
- 4.2. PESTEL analysis
- 4.3. BCG Analysis
- 4.3.1. Stars (High Growth, High Market Share)
- 4.3.2. Cash Cows (Low Growth, High Market Share)
- 4.3.3. Question Mark (High Growth, Low Market Share)
- 4.3.4. Dogs (Low Growth, Low Market Share)
- 4.4. Ansoff Matrix Analysis
- 4.5. Supply Chain Analysis
- 4.6. Regulatory Landscape
- 4.7. Current Market Potential and Opportunity Assessment (TAM–SAM–SOM Framework)
- 4.8. RAX Analyst Note
- 4.1. Porters Five Forces
- 5. Market Analysis, Insights and Forecast 2021-2033
- 5.1. Market Analysis, Insights and Forecast - by Product Type
- 5.1.1. Ceramics
- 5.1.2. Activated Carbon
- 5.1.3. Zeolites
- 5.1.4. Other Product Types
- 5.2. Market Analysis, Insights and Forecast - by Material Type
- 5.2.1. Alumina
- 5.2.2. Titania
- 5.2.3. Zirconia
- 5.2.4. Silica
- 5.2.5. Other Material Types
- 5.3. Market Analysis, Insights and Forecast - by Shape
- 5.3.1. Sphere
- 5.3.2. Ring
- 5.3.3. Honeycomb
- 5.3.4. Other Shapes
- 5.4. Market Analysis, Insights and Forecast - by End-user Industry
- 5.4.1. Oil and Gas
- 5.4.2. Chemical Manufacturing
- 5.4.3. Automotive
- 5.4.4. Pharmaceuticals
- 5.4.5. Other End-user Industries
- 5.5. Market Analysis, Insights and Forecast - by Region
- 5.5.1. Asia Pacific
- 5.5.2. North America
- 5.5.3. Europe
- 5.5.4. South America
- 5.5.5. Middle East and Africa
- 5.1. Market Analysis, Insights and Forecast - by Product Type
- 6. Global Catalyst Carrier Industry Analysis, Insights and Forecast, 2021-2033
- 6.1. Market Analysis, Insights and Forecast - by Product Type
- 6.1.1. Ceramics
- 6.1.2. Activated Carbon
- 6.1.3. Zeolites
- 6.1.4. Other Product Types
- 6.2. Market Analysis, Insights and Forecast - by Material Type
- 6.2.1. Alumina
- 6.2.2. Titania
- 6.2.3. Zirconia
- 6.2.4. Silica
- 6.2.5. Other Material Types
- 6.3. Market Analysis, Insights and Forecast - by Shape
- 6.3.1. Sphere
- 6.3.2. Ring
- 6.3.3. Honeycomb
- 6.3.4. Other Shapes
- 6.4. Market Analysis, Insights and Forecast - by End-user Industry
- 6.4.1. Oil and Gas
- 6.4.2. Chemical Manufacturing
- 6.4.3. Automotive
- 6.4.4. Pharmaceuticals
- 6.4.5. Other End-user Industries
- 6.1. Market Analysis, Insights and Forecast - by Product Type
- 7. Asia Pacific Catalyst Carrier Industry Analysis, Insights and Forecast, 2020-2032
- 7.1. Market Analysis, Insights and Forecast - by Product Type
- 7.1.1. Ceramics
- 7.1.2. Activated Carbon
- 7.1.3. Zeolites
- 7.1.4. Other Product Types
- 7.2. Market Analysis, Insights and Forecast - by Material Type
- 7.2.1. Alumina
- 7.2.2. Titania
- 7.2.3. Zirconia
- 7.2.4. Silica
- 7.2.5. Other Material Types
- 7.3. Market Analysis, Insights and Forecast - by Shape
- 7.3.1. Sphere
- 7.3.2. Ring
- 7.3.3. Honeycomb
- 7.3.4. Other Shapes
- 7.4. Market Analysis, Insights and Forecast - by End-user Industry
- 7.4.1. Oil and Gas
- 7.4.2. Chemical Manufacturing
- 7.4.3. Automotive
- 7.4.4. Pharmaceuticals
- 7.4.5. Other End-user Industries
- 7.1. Market Analysis, Insights and Forecast - by Product Type
- 8. North America Catalyst Carrier Industry Analysis, Insights and Forecast, 2020-2032
- 8.1. Market Analysis, Insights and Forecast - by Product Type
- 8.1.1. Ceramics
- 8.1.2. Activated Carbon
- 8.1.3. Zeolites
- 8.1.4. Other Product Types
- 8.2. Market Analysis, Insights and Forecast - by Material Type
- 8.2.1. Alumina
- 8.2.2. Titania
- 8.2.3. Zirconia
- 8.2.4. Silica
- 8.2.5. Other Material Types
- 8.3. Market Analysis, Insights and Forecast - by Shape
- 8.3.1. Sphere
- 8.3.2. Ring
- 8.3.3. Honeycomb
- 8.3.4. Other Shapes
- 8.4. Market Analysis, Insights and Forecast - by End-user Industry
- 8.4.1. Oil and Gas
- 8.4.2. Chemical Manufacturing
- 8.4.3. Automotive
- 8.4.4. Pharmaceuticals
- 8.4.5. Other End-user Industries
- 8.1. Market Analysis, Insights and Forecast - by Product Type
- 9. Europe Catalyst Carrier Industry Analysis, Insights and Forecast, 2020-2032
- 9.1. Market Analysis, Insights and Forecast - by Product Type
- 9.1.1. Ceramics
- 9.1.2. Activated Carbon
- 9.1.3. Zeolites
- 9.1.4. Other Product Types
- 9.2. Market Analysis, Insights and Forecast - by Material Type
- 9.2.1. Alumina
- 9.2.2. Titania
- 9.2.3. Zirconia
- 9.2.4. Silica
- 9.2.5. Other Material Types
- 9.3. Market Analysis, Insights and Forecast - by Shape
- 9.3.1. Sphere
- 9.3.2. Ring
- 9.3.3. Honeycomb
- 9.3.4. Other Shapes
- 9.4. Market Analysis, Insights and Forecast - by End-user Industry
- 9.4.1. Oil and Gas
- 9.4.2. Chemical Manufacturing
- 9.4.3. Automotive
- 9.4.4. Pharmaceuticals
- 9.4.5. Other End-user Industries
- 9.1. Market Analysis, Insights and Forecast - by Product Type
- 10. South America Catalyst Carrier Industry Analysis, Insights and Forecast, 2020-2032
- 10.1. Market Analysis, Insights and Forecast - by Product Type
- 10.1.1. Ceramics
- 10.1.2. Activated Carbon
- 10.1.3. Zeolites
- 10.1.4. Other Product Types
- 10.2. Market Analysis, Insights and Forecast - by Material Type
- 10.2.1. Alumina
- 10.2.2. Titania
- 10.2.3. Zirconia
- 10.2.4. Silica
- 10.2.5. Other Material Types
- 10.3. Market Analysis, Insights and Forecast - by Shape
- 10.3.1. Sphere
- 10.3.2. Ring
- 10.3.3. Honeycomb
- 10.3.4. Other Shapes
- 10.4. Market Analysis, Insights and Forecast - by End-user Industry
- 10.4.1. Oil and Gas
- 10.4.2. Chemical Manufacturing
- 10.4.3. Automotive
- 10.4.4. Pharmaceuticals
- 10.4.5. Other End-user Industries
- 10.1. Market Analysis, Insights and Forecast - by Product Type
- 11. Middle East and Africa Catalyst Carrier Industry Analysis, Insights and Forecast, 2020-2032
- 11.1. Market Analysis, Insights and Forecast - by Product Type
- 11.1.1. Ceramics
- 11.1.2. Activated Carbon
- 11.1.3. Zeolites
- 11.1.4. Other Product Types
- 11.2. Market Analysis, Insights and Forecast - by Material Type
- 11.2.1. Alumina
- 11.2.2. Titania
- 11.2.3. Zirconia
- 11.2.4. Silica
- 11.2.5. Other Material Types
- 11.3. Market Analysis, Insights and Forecast - by Shape
- 11.3.1. Sphere
- 11.3.2. Ring
- 11.3.3. Honeycomb
- 11.3.4. Other Shapes
- 11.4. Market Analysis, Insights and Forecast - by End-user Industry
- 11.4.1. Oil and Gas
- 11.4.2. Chemical Manufacturing
- 11.4.3. Automotive
- 11.4.4. Pharmaceuticals
- 11.4.5. Other End-user Industries
- 11.1. Market Analysis, Insights and Forecast - by Product Type
- 12. Competitive Analysis
- 12.1. Company Profiles
- 12.1.1 Cabot Corporation
- 12.1.1.1. Company Overview
- 12.1.1.2. Products
- 12.1.1.3. Company Financials
- 12.1.1.4. SWOT Analysis
- 12.1.2 CeramTec
- 12.1.2.1. Company Overview
- 12.1.2.2. Products
- 12.1.2.3. Company Financials
- 12.1.2.4. SWOT Analysis
- 12.1.3 CoorsTek
- 12.1.3.1. Company Overview
- 12.1.3.2. Products
- 12.1.3.3. Company Financials
- 12.1.3.4. SWOT Analysis
- 12.1.4 Evonik Industries
- 12.1.4.1. Company Overview
- 12.1.4.2. Products
- 12.1.4.3. Company Financials
- 12.1.4.4. SWOT Analysis
- 12.1.5 Magma Ceramics & Catalysts
- 12.1.5.1. Company Overview
- 12.1.5.2. Products
- 12.1.5.3. Company Financials
- 12.1.5.4. SWOT Analysis
- 12.1.6 Noritake Co Limited
- 12.1.6.1. Company Overview
- 12.1.6.2. Products
- 12.1.6.3. Company Financials
- 12.1.6.4. SWOT Analysis
- 12.1.7 Saint-Gobain
- 12.1.7.1. Company Overview
- 12.1.7.2. Products
- 12.1.7.3. Company Financials
- 12.1.7.4. SWOT Analysis
- 12.1.8 Sasol Performance Chemicals
- 12.1.8.1. Company Overview
- 12.1.8.2. Products
- 12.1.8.3. Company Financials
- 12.1.8.4. SWOT Analysis
- 12.1.9 ALMATIS AN OYAK GROUP COMPANY
- 12.1.9.1. Company Overview
- 12.1.9.2. Products
- 12.1.9.3. Company Financials
- 12.1.9.4. SWOT Analysis
- 12.1.10 W R Grace & Co -Conn *List Not Exhaustive
- 12.1.10.1. Company Overview
- 12.1.10.2. Products
- 12.1.10.3. Company Financials
- 12.1.10.4. SWOT Analysis
- 12.1.1 Cabot Corporation
- 12.2. Market Entropy
- 12.2.1 Company's Key Areas Served
- 12.2.2 Recent Developments
- 12.3. Company Market Share Analysis 2025
- 12.3.1 Top 5 Companies Market Share Analysis
- 12.3.2 Top 3 Companies Market Share Analysis
- 12.4. List of Potential Customers
- 13. Research Methodology
List of Figures
- Figure 1: Global Catalyst Carrier Industry Revenue Breakdown (million, %) by Region 2025 & 2033
- Figure 2: Asia Pacific Catalyst Carrier Industry Revenue (million), by Product Type 2025 & 2033
- Figure 3: Asia Pacific Catalyst Carrier Industry Revenue Share (%), by Product Type 2025 & 2033
- Figure 4: Asia Pacific Catalyst Carrier Industry Revenue (million), by Material Type 2025 & 2033
- Figure 5: Asia Pacific Catalyst Carrier Industry Revenue Share (%), by Material Type 2025 & 2033
- Figure 6: Asia Pacific Catalyst Carrier Industry Revenue (million), by Shape 2025 & 2033
- Figure 7: Asia Pacific Catalyst Carrier Industry Revenue Share (%), by Shape 2025 & 2033
- Figure 8: Asia Pacific Catalyst Carrier Industry Revenue (million), by End-user Industry 2025 & 2033
- Figure 9: Asia Pacific Catalyst Carrier Industry Revenue Share (%), by End-user Industry 2025 & 2033
- Figure 10: Asia Pacific Catalyst Carrier Industry Revenue (million), by Country 2025 & 2033
- Figure 11: Asia Pacific Catalyst Carrier Industry Revenue Share (%), by Country 2025 & 2033
- Figure 12: North America Catalyst Carrier Industry Revenue (million), by Product Type 2025 & 2033
- Figure 13: North America Catalyst Carrier Industry Revenue Share (%), by Product Type 2025 & 2033
- Figure 14: North America Catalyst Carrier Industry Revenue (million), by Material Type 2025 & 2033
- Figure 15: North America Catalyst Carrier Industry Revenue Share (%), by Material Type 2025 & 2033
- Figure 16: North America Catalyst Carrier Industry Revenue (million), by Shape 2025 & 2033
- Figure 17: North America Catalyst Carrier Industry Revenue Share (%), by Shape 2025 & 2033
- Figure 18: North America Catalyst Carrier Industry Revenue (million), by End-user Industry 2025 & 2033
- Figure 19: North America Catalyst Carrier Industry Revenue Share (%), by End-user Industry 2025 & 2033
- Figure 20: North America Catalyst Carrier Industry Revenue (million), by Country 2025 & 2033
- Figure 21: North America Catalyst Carrier Industry Revenue Share (%), by Country 2025 & 2033
- Figure 22: Europe Catalyst Carrier Industry Revenue (million), by Product Type 2025 & 2033
- Figure 23: Europe Catalyst Carrier Industry Revenue Share (%), by Product Type 2025 & 2033
- Figure 24: Europe Catalyst Carrier Industry Revenue (million), by Material Type 2025 & 2033
- Figure 25: Europe Catalyst Carrier Industry Revenue Share (%), by Material Type 2025 & 2033
- Figure 26: Europe Catalyst Carrier Industry Revenue (million), by Shape 2025 & 2033
- Figure 27: Europe Catalyst Carrier Industry Revenue Share (%), by Shape 2025 & 2033
- Figure 28: Europe Catalyst Carrier Industry Revenue (million), by End-user Industry 2025 & 2033
- Figure 29: Europe Catalyst Carrier Industry Revenue Share (%), by End-user Industry 2025 & 2033
- Figure 30: Europe Catalyst Carrier Industry Revenue (million), by Country 2025 & 2033
- Figure 31: Europe Catalyst Carrier Industry Revenue Share (%), by Country 2025 & 2033
- Figure 32: South America Catalyst Carrier Industry Revenue (million), by Product Type 2025 & 2033
- Figure 33: South America Catalyst Carrier Industry Revenue Share (%), by Product Type 2025 & 2033
- Figure 34: South America Catalyst Carrier Industry Revenue (million), by Material Type 2025 & 2033
- Figure 35: South America Catalyst Carrier Industry Revenue Share (%), by Material Type 2025 & 2033
- Figure 36: South America Catalyst Carrier Industry Revenue (million), by Shape 2025 & 2033
- Figure 37: South America Catalyst Carrier Industry Revenue Share (%), by Shape 2025 & 2033
- Figure 38: South America Catalyst Carrier Industry Revenue (million), by End-user Industry 2025 & 2033
- Figure 39: South America Catalyst Carrier Industry Revenue Share (%), by End-user Industry 2025 & 2033
- Figure 40: South America Catalyst Carrier Industry Revenue (million), by Country 2025 & 2033
- Figure 41: South America Catalyst Carrier Industry Revenue Share (%), by Country 2025 & 2033
- Figure 42: Middle East and Africa Catalyst Carrier Industry Revenue (million), by Product Type 2025 & 2033
- Figure 43: Middle East and Africa Catalyst Carrier Industry Revenue Share (%), by Product Type 2025 & 2033
- Figure 44: Middle East and Africa Catalyst Carrier Industry Revenue (million), by Material Type 2025 & 2033
- Figure 45: Middle East and Africa Catalyst Carrier Industry Revenue Share (%), by Material Type 2025 & 2033
- Figure 46: Middle East and Africa Catalyst Carrier Industry Revenue (million), by Shape 2025 & 2033
- Figure 47: Middle East and Africa Catalyst Carrier Industry Revenue Share (%), by Shape 2025 & 2033
- Figure 48: Middle East and Africa Catalyst Carrier Industry Revenue (million), by End-user Industry 2025 & 2033
- Figure 49: Middle East and Africa Catalyst Carrier Industry Revenue Share (%), by End-user Industry 2025 & 2033
- Figure 50: Middle East and Africa Catalyst Carrier Industry Revenue (million), by Country 2025 & 2033
- Figure 51: Middle East and Africa Catalyst Carrier Industry Revenue Share (%), by Country 2025 & 2033
List of Tables
- Table 1: Global Catalyst Carrier Industry Revenue million Forecast, by Product Type 2020 & 2033
- Table 2: Global Catalyst Carrier Industry Revenue million Forecast, by Material Type 2020 & 2033
- Table 3: Global Catalyst Carrier Industry Revenue million Forecast, by Shape 2020 & 2033
- Table 4: Global Catalyst Carrier Industry Revenue million Forecast, by End-user Industry 2020 & 2033
- Table 5: Global Catalyst Carrier Industry Revenue million Forecast, by Region 2020 & 2033
- Table 6: Global Catalyst Carrier Industry Revenue million Forecast, by Product Type 2020 & 2033
- Table 7: Global Catalyst Carrier Industry Revenue million Forecast, by Material Type 2020 & 2033
- Table 8: Global Catalyst Carrier Industry Revenue million Forecast, by Shape 2020 & 2033
- Table 9: Global Catalyst Carrier Industry Revenue million Forecast, by End-user Industry 2020 & 2033
- Table 10: Global Catalyst Carrier Industry Revenue million Forecast, by Country 2020 & 2033
- Table 11: China Catalyst Carrier Industry Revenue (million) Forecast, by Application 2020 & 2033
- Table 12: India Catalyst Carrier Industry Revenue (million) Forecast, by Application 2020 & 2033
- Table 13: Japan Catalyst Carrier Industry Revenue (million) Forecast, by Application 2020 & 2033
- Table 14: South Korea Catalyst Carrier Industry Revenue (million) Forecast, by Application 2020 & 2033
- Table 15: Rest of Asia Pacific Catalyst Carrier Industry Revenue (million) Forecast, by Application 2020 & 2033
- Table 16: Global Catalyst Carrier Industry Revenue million Forecast, by Product Type 2020 & 2033
- Table 17: Global Catalyst Carrier Industry Revenue million Forecast, by Material Type 2020 & 2033
- Table 18: Global Catalyst Carrier Industry Revenue million Forecast, by Shape 2020 & 2033
- Table 19: Global Catalyst Carrier Industry Revenue million Forecast, by End-user Industry 2020 & 2033
- Table 20: Global Catalyst Carrier Industry Revenue million Forecast, by Country 2020 & 2033
- Table 21: United States Catalyst Carrier Industry Revenue (million) Forecast, by Application 2020 & 2033
- Table 22: Canada Catalyst Carrier Industry Revenue (million) Forecast, by Application 2020 & 2033
- Table 23: Mexico Catalyst Carrier Industry Revenue (million) Forecast, by Application 2020 & 2033
- Table 24: Global Catalyst Carrier Industry Revenue million Forecast, by Product Type 2020 & 2033
- Table 25: Global Catalyst Carrier Industry Revenue million Forecast, by Material Type 2020 & 2033
- Table 26: Global Catalyst Carrier Industry Revenue million Forecast, by Shape 2020 & 2033
- Table 27: Global Catalyst Carrier Industry Revenue million Forecast, by End-user Industry 2020 & 2033
- Table 28: Global Catalyst Carrier Industry Revenue million Forecast, by Country 2020 & 2033
- Table 29: Germany Catalyst Carrier Industry Revenue (million) Forecast, by Application 2020 & 2033
- Table 30: United Kingdom Catalyst Carrier Industry Revenue (million) Forecast, by Application 2020 & 2033
- Table 31: France Catalyst Carrier Industry Revenue (million) Forecast, by Application 2020 & 2033
- Table 32: Italy Catalyst Carrier Industry Revenue (million) Forecast, by Application 2020 & 2033
- Table 33: Rest of Europe Catalyst Carrier Industry Revenue (million) Forecast, by Application 2020 & 2033
- Table 34: Global Catalyst Carrier Industry Revenue million Forecast, by Product Type 2020 & 2033
- Table 35: Global Catalyst Carrier Industry Revenue million Forecast, by Material Type 2020 & 2033
- Table 36: Global Catalyst Carrier Industry Revenue million Forecast, by Shape 2020 & 2033
- Table 37: Global Catalyst Carrier Industry Revenue million Forecast, by End-user Industry 2020 & 2033
- Table 38: Global Catalyst Carrier Industry Revenue million Forecast, by Country 2020 & 2033
- Table 39: Brazil Catalyst Carrier Industry Revenue (million) Forecast, by Application 2020 & 2033
- Table 40: Argentina Catalyst Carrier Industry Revenue (million) Forecast, by Application 2020 & 2033
- Table 41: Rest of South America Catalyst Carrier Industry Revenue (million) Forecast, by Application 2020 & 2033
- Table 42: Global Catalyst Carrier Industry Revenue million Forecast, by Product Type 2020 & 2033
- Table 43: Global Catalyst Carrier Industry Revenue million Forecast, by Material Type 2020 & 2033
- Table 44: Global Catalyst Carrier Industry Revenue million Forecast, by Shape 2020 & 2033
- Table 45: Global Catalyst Carrier Industry Revenue million Forecast, by End-user Industry 2020 & 2033
- Table 46: Global Catalyst Carrier Industry Revenue million Forecast, by Country 2020 & 2033
- Table 47: Saudi Arabia Catalyst Carrier Industry Revenue (million) Forecast, by Application 2020 & 2033
- Table 48: South Africa Catalyst Carrier Industry Revenue (million) Forecast, by Application 2020 & 2033
- Table 49: Rest of Middle East and Africa Catalyst Carrier Industry Revenue (million) Forecast, by Application 2020 & 2033
Frequently Asked Questions
1. What is the projected Compound Annual Growth Rate (CAGR) of the Catalyst Carrier Industry?
The projected CAGR is approximately 4.8%.
2. Which companies are prominent players in the Catalyst Carrier Industry?
Key companies in the market include Cabot Corporation, CeramTec, CoorsTek, Evonik Industries, Magma Ceramics & Catalysts, Noritake Co Limited, Saint-Gobain, Sasol Performance Chemicals, ALMATIS AN OYAK GROUP COMPANY, W R Grace & Co -Conn *List Not Exhaustive.
3. What are the main segments of the Catalyst Carrier Industry?
The market segments include Product Type, Material Type, Shape, End-user Industry.
4. Can you provide details about the market size?
The market size is estimated to be USD 51.5 million as of 2022.
5. What are some drivers contributing to market growth?
; Increasing Demand from Ceramic Catalyst; Growing Consumption of Petroleum Derivatives.
6. What are the notable trends driving market growth?
Oil and Gas Industry to Dominate the Market.
7. Are there any restraints impacting market growth?
; Increasing Demand from Ceramic Catalyst; Growing Consumption of Petroleum Derivatives.
8. Can you provide examples of recent developments in the market?
N/A
9. What pricing options are available for accessing the report?
Pricing options include single-user, multi-user, and enterprise licenses priced at USD 4750, USD 5250, and USD 8750 respectively.
10. Is the market size provided in terms of value or volume?
The market size is provided in terms of value, measured in million.
11. Are there any specific market keywords associated with the report?
Yes, the market keyword associated with the report is "Catalyst Carrier Industry," which aids in identifying and referencing the specific market segment covered.
12. How do I determine which pricing option suits my needs best?
The pricing options vary based on user requirements and access needs. Individual users may opt for single-user licenses, while businesses requiring broader access may choose multi-user or enterprise licenses for cost-effective access to the report.
13. Are there any additional resources or data provided in the Catalyst Carrier Industry report?
While the report offers comprehensive insights, it's advisable to review the specific contents or supplementary materials provided to ascertain if additional resources or data are available.
14. How can I stay updated on further developments or reports in the Catalyst Carrier Industry?
To stay informed about further developments, trends, and reports in the Catalyst Carrier Industry, consider subscribing to industry newsletters, following relevant companies and organizations, or regularly checking reputable industry news sources and publications.
Methodology
Step 1 - Identification of Relevant Samples Size from Population Database


Step 2 - Approaches for Defining Global Market Size (Value, Volume* & Price*)

Note*: In applicable scenarios
Step 3 - Data Sources
Primary Research
- Web Analytics
- Survey Reports
- Research Institute
- Latest Research Reports
- Opinion Leaders
Secondary Research
- Annual Reports
- White Paper
- Latest Press Release
- Industry Association
- Paid Database
- Investor Presentations

Step 4 - Data Triangulation
Involves using different sources of information in order to increase the validity of a study
These sources are likely to be stakeholders in a program - participants, other researchers, program staff, other community members, and so on.
Then we put all data in single framework & apply various statistical tools to find out the dynamic on the market.
During the analysis stage, feedback from the stakeholder groups would be compared to determine areas of agreement as well as areas of divergence

