

Key Insights
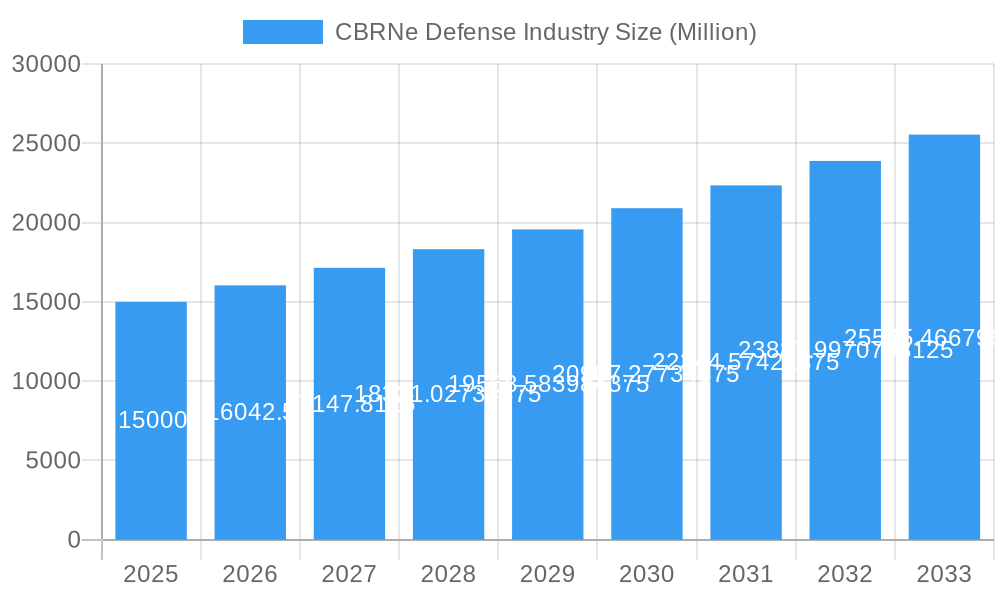
The global CBRNe (Chemical, Biological, Radiological, Nuclear, and explosive) defense market is poised for significant expansion, projected to reach approximately $XX billion by 2025 and sustain a Compound Annual Growth Rate (CAGR) of 6.90% through 2033. This robust growth is primarily fueled by escalating geopolitical tensions, the persistent threat of terrorism, and the increasing sophistication of CBRNe weapon capabilities by state and non-state actors. Governments worldwide are prioritizing homeland security and military readiness, leading to substantial investments in advanced detection systems, protective equipment, decontamination solutions, and response platforms. Emerging economies, particularly in Asia Pacific, are demonstrating a heightened focus on enhancing their CBRNe defense infrastructure, driven by rapid industrialization, growing population densities, and a rising awareness of potential threats. The market is also experiencing innovation in areas such as artificial intelligence for threat prediction, drone-based detection, and advanced materials for personal protective equipment, further propelling market dynamics.
CBRNe Defense Industry Market Size (In Billion)
The CBRNe defense market encompasses a wide array of solutions, from sophisticated early warning systems and individual soldier protection to large-scale decontamination units and specialized medical countermeasures. Key drivers include the imperative to safeguard critical infrastructure, protect civilian populations, and maintain operational readiness in complex environments. However, the market faces certain restraints, including the high cost of advanced technology development and procurement, stringent regulatory frameworks, and the need for extensive training and skilled personnel for effective deployment and operation of CBRNe defense systems. Despite these challenges, the continuous evolution of threat landscapes and the ongoing commitment to national security are expected to ensure sustained demand and innovation within the CBRNe defense sector. Companies like Leidos Inc., Chemring Group PLC, and KNDS are at the forefront, offering a diverse portfolio of solutions that address the multifaceted nature of CBRNe threats, from immediate detection to long-term recovery efforts.
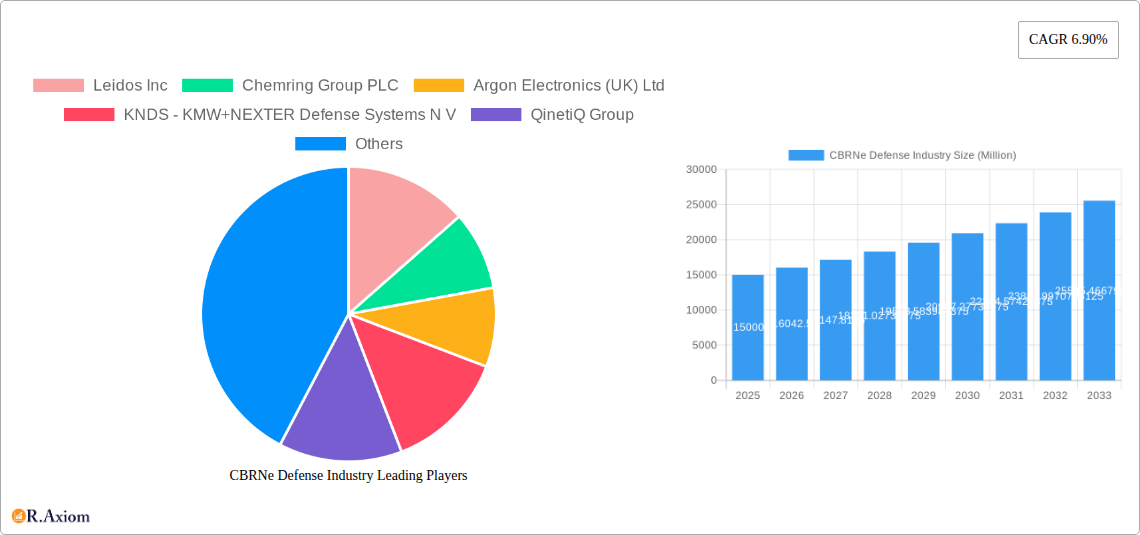
CBRNe Defense Industry Company Market Share
CBRNe Defense Industry Market Concentration & Innovation
The CBRNe (Chemical, Biological, Radiological, and Nuclear) defense industry exhibits a moderate to high level of market concentration, with a few dominant players holding significant market share in specialized areas such as detection, decontamination, and protective equipment. Innovation is a critical driver, fueled by continuous research and development into advanced sensor technologies, real-time threat assessment systems, and more effective protective gear. Regulatory frameworks, including international treaties and national security directives, play a pivotal role in shaping market dynamics and mandating the adoption of stringent safety and security standards. Product substitutes exist, particularly in broader security and defense applications, but the highly specialized nature of CBRNe threats limits direct substitution in many critical areas. End-user trends are increasingly focused on integrated solutions, autonomous systems for reconnaissance, and enhanced personal protective equipment. Merger and acquisition (M&A) activities are observed as companies seek to expand their technological portfolios and market reach, with recent M&A deal values estimated to be in the hundreds of millions of USD.
- Market Share: Leading companies in specific niches like CBRNe detection and decontamination hold market shares ranging from 10% to 25%.
- M&A Deal Values: Transactions often range from tens of millions to hundreds of millions of USD, aiming to consolidate expertise and intellectual property.
- Innovation Drivers: Advancements in nanotechnology, AI-powered analytics, miniaturized sensors, and bio-sensing technologies.
- Regulatory Frameworks: Adherence to stringent standards set by organizations like NATO, the UN, and national defense ministries.
- End-User Trends: Demand for predictive threat intelligence, rapid response capabilities, and advanced training solutions.
CBRNe Defense Industry Industry Trends & Insights
The CBRNe defense industry is poised for significant growth, driven by escalating geopolitical tensions, the persistent threat of terrorism, and the increasing likelihood of state-sponsored CBRNe attacks. The market is projected to witness a Compound Annual Growth Rate (CAGR) of approximately 6.5% over the forecast period. This growth is underpinned by substantial investments in homeland security and defense by governments worldwide, particularly in the North American and European regions. Technological disruptions are at the forefront, with a strong emphasis on artificial intelligence (AI) and machine learning (ML) for early warning systems and threat detection, as well as the integration of unmanned aerial systems (UAS) for remote reconnaissance missions. Consumer preferences, primarily driven by defense agencies and first responders, are shifting towards more agile, connected, and autonomous solutions that minimize human exposure to hazardous environments. Competitive dynamics are characterized by a mix of established defense contractors and specialized technology firms, all vying for market share through continuous innovation and strategic partnerships. The increasing awareness of CBRNe threats and the imperative for robust defense strategies are propelling market penetration across various end-use sectors.
The integration of advanced sensor technology is a key trend, enabling the detection of a wider spectrum of chemical, biological, and radiological agents with greater accuracy and speed. This includes the development of standoff detection systems that can identify threats from a safe distance. Furthermore, the evolution of protective equipment is moving towards lighter, more breathable, and highly effective materials that offer superior protection without compromising mobility or situational awareness for personnel. The demand for decontamination technologies is also rising, with a focus on faster and more efficient methods to neutralize hazardous agents and render affected areas safe. The market is also experiencing a surge in demand for integrated command and control systems that can process real-time data from multiple sources, including sensors, intelligence feeds, and situational awareness platforms, to provide a comprehensive picture of the threat landscape. Training and simulation are becoming increasingly sophisticated, utilizing virtual reality (VR) and augmented reality (AR) to provide realistic training scenarios for CBRNe response teams.
The industry is also witnessing a growing emphasis on resilience and preparedness, with an increasing number of nations and organizations developing comprehensive CBRNe defense strategies. This includes stockpiling of essential equipment, development of rapid response protocols, and enhancement of inter-agency cooperation. The private sector plays a crucial role in supporting these efforts by providing advanced technologies, specialized expertise, and tailored solutions. The evolving nature of CBRNe threats, including the potential for novel biological agents and sophisticated chemical weapons, necessitates continuous adaptation and innovation within the industry. The market penetration of advanced CBRNe defense solutions is expected to deepen as awareness and perceived threat levels continue to rise globally.
Dominant Markets & Segments in CBRNe Defense Industry
The CBRNe defense industry demonstrates significant regional and segment dominance. North America, particularly the United States, stands out as the leading region due to its substantial defense budgets, advanced technological infrastructure, and a heightened awareness of CBRNe threats. Within North America, government agencies and defense ministries are the primary consumers, driving demand for sophisticated detection, protection, and response capabilities.
Production Analysis:
- Dominant Region: North America, with the United States as the leading producer of advanced CBRNe detection and protection systems.
- Key Drivers: Significant government R&D funding, presence of major defense contractors, and a strong focus on technological innovation.
- Production Value: Estimated to exceed USD 5 Billion annually.
Consumption Analysis:
- Dominant End-User: Defense ministries and homeland security agencies.
- Key Drivers: Evolving threat landscape, geopolitical instability, and the need for robust preparedness against CBRNe incidents.
- Consumption Value: Projected to reach USD 7 Billion in 2025.
Import Market Analysis (Value & Volume):
- Leading Importers: Countries with emerging defense capabilities and those seeking to augment their existing CBRNe arsenals.
- Key Drivers: Technology transfer, specialized equipment needs, and partnerships with established defense providers.
- Import Value: Expected to grow at a CAGR of 5.8% over the forecast period.
- Import Volume: Driven by demand for specialized sensor arrays and personal protective equipment.
Export Market Analysis (Value & Volume):
- Leading Exporters: Nations with advanced technological capabilities and established defense manufacturing bases.
- Key Drivers: International collaborations, regional security pacts, and the global demand for CBRNe defense solutions.
- Export Value: Estimated at USD 4 Billion in 2025, with strong growth projected.
- Export Volume: Primarily comprises advanced detection systems, decontamination units, and protective gear.
Price Trend Analysis:
- Dominant Trend: A gradual increase in prices driven by technological advancements, high R&D costs, and stringent regulatory compliance.
- Key Drivers: Sophistication of integrated systems, demand for miniaturization, and the need for specialized materials in protective equipment.
- Price Volatility: Moderate, influenced by government procurement cycles and the introduction of new, more advanced technologies.
CBRNe Defense Industry Product Developments
Product development in the CBRNe defense industry is characterized by a relentless pursuit of enhanced detection capabilities, improved protective gear, and more efficient decontamination solutions. Innovations include the miniaturization of advanced sensors for wearable devices and unmanned systems, enabling real-time, on-site threat identification. The development of self-healing materials for personal protective equipment and the creation of rapid, broad-spectrum decontamination agents are also key areas. Furthermore, AI-powered analytics are being integrated into detection platforms for faster threat assessment and predictive capabilities, offering significant competitive advantages in rapidly evolving threat scenarios.
Report Scope & Segmentation Analysis
This report meticulously analyzes the CBRNe Defense Industry, covering a comprehensive study period from 2019 to 2033, with a base and estimated year of 2025. The analysis encompasses Production Analysis, Consumption Analysis, Import Market Analysis (Value & Volume), Export Market Analysis (Value & Volume), and Price Trend Analysis. Each segment is examined to understand market sizes, growth projections, and competitive dynamics, providing deep insights into the industry's landscape and future trajectory. The forecast period of 2025–2033 will highlight evolving market trends and technological advancements.
Key Drivers of CBRNe Defense Industry Growth
The CBRNe defense industry's growth is propelled by several critical factors. Geopolitical instability and the persistent threat of terrorism worldwide necessitate continuous investment in robust defense capabilities. Escalating military modernization programs across nations, with a focus on countering asymmetric threats, further drive demand. Technological advancements in sensor technology, artificial intelligence for threat detection, and advanced materials for protective equipment are creating new market opportunities. Additionally, stringent government regulations and international treaties mandating preparedness and response protocols play a significant role in stimulating market growth.
Challenges in the CBRNe Defense Industry Sector
The CBRNe defense industry faces significant challenges. High research and development costs associated with cutting-edge technologies can lead to extended product lifecycles and substantial upfront investments. Stringent and evolving regulatory frameworks, while essential, can also create hurdles in product approval and market entry. Supply chain complexities for specialized components and raw materials can lead to delays and increased costs. Furthermore, the competitive pressure from established players and emerging technology firms necessitates continuous innovation and cost-effectiveness to maintain market share, impacting profitability.
Emerging Opportunities in CBRNe Defense Industry
Emerging opportunities within the CBRNe defense industry are abundant. The increasing integration of AI and machine learning in threat detection and predictive analysis presents a significant growth avenue. The demand for autonomous systems, such as unmanned aerial vehicles (UAVs) for reconnaissance and sampling in hazardous zones, is expanding. Furthermore, the development of advanced, lightweight, and highly protective personal protective equipment for extended operational use is a key trend. The growing emphasis on national resilience and preparedness is also creating opportunities for integrated CBRNe response solutions and advanced training platforms.
Leading Players in the CBRNe Defense Industry Market
- Leidos Inc
- Chemring Group PLC
- Argon Electronics (UK) Ltd
- KNDS - KMW+NEXTER Defense Systems N V
- QinetiQ Group
- Smiths Group plc
- National Technology and Engineering Solutions of Sandia LLC
- Battelle
- Avon Polymer Products Limited
- OSI Systems Inc
- Saab AB
- Karcher Futuretech GmbH
- Teledyne FLIR LLC
Key Developments in CBRNe Defense Industry Industry
- April 2022: Kromek was awarded a contract worth GBP 1.7 million (USD 2.23 million) from an existing UK government-related customer to deliver CBRN (chemical, biological, radiological, and nuclear) detection services and products. The delivery of CBRN products is scheduled to be delivered through 2026.
- February 2023: Teledyne FLIR was awarded a USD 13.3 million contract by the US Department of Defense (DoD) to further expand the capabilities of its R80D SkyRaider unmanned aerial system to autonomously perform chemical, biological, radiological, and nuclear (CBRN) reconnaissance missions.
Strategic Outlook for CBRNe Defense Industry Market
The strategic outlook for the CBRNe defense industry is exceptionally positive, characterized by sustained growth driven by global security imperatives. The continuous evolution of CBRNe threats mandates ongoing investment in advanced detection, protection, and response technologies. Strategic partnerships and collaborations between established defense contractors and innovative technology providers will be crucial for developing integrated and comprehensive solutions. The increasing adoption of AI, autonomous systems, and advanced materials will redefine market offerings and create new avenues for market penetration, positioning the industry for robust expansion and enhanced global security preparedness.
CBRNe Defense Industry Segmentation
- 1. Production Analysis
- 2. Consumption Analysis
- 3. Import Market Analysis (Value & Volume)
- 4. Export Market Analysis (Value & Volume)
- 5. Price Trend Analysis
CBRNe Defense Industry Segmentation By Geography
-
1. North America
- 1.1. United States
- 1.2. Canada
- 1.3. Mexico
-
2. South America
- 2.1. Brazil
- 2.2. Argentina
- 2.3. Rest of South America
-
3. Europe
- 3.1. United Kingdom
- 3.2. Germany
- 3.3. France
- 3.4. Italy
- 3.5. Spain
- 3.6. Russia
- 3.7. Benelux
- 3.8. Nordics
- 3.9. Rest of Europe
-
4. Middle East & Africa
- 4.1. Turkey
- 4.2. Israel
- 4.3. GCC
- 4.4. North Africa
- 4.5. South Africa
- 4.6. Rest of Middle East & Africa
-
5. Asia Pacific
- 5.1. China
- 5.2. India
- 5.3. Japan
- 5.4. South Korea
- 5.5. ASEAN
- 5.6. Oceania
- 5.7. Rest of Asia Pacific
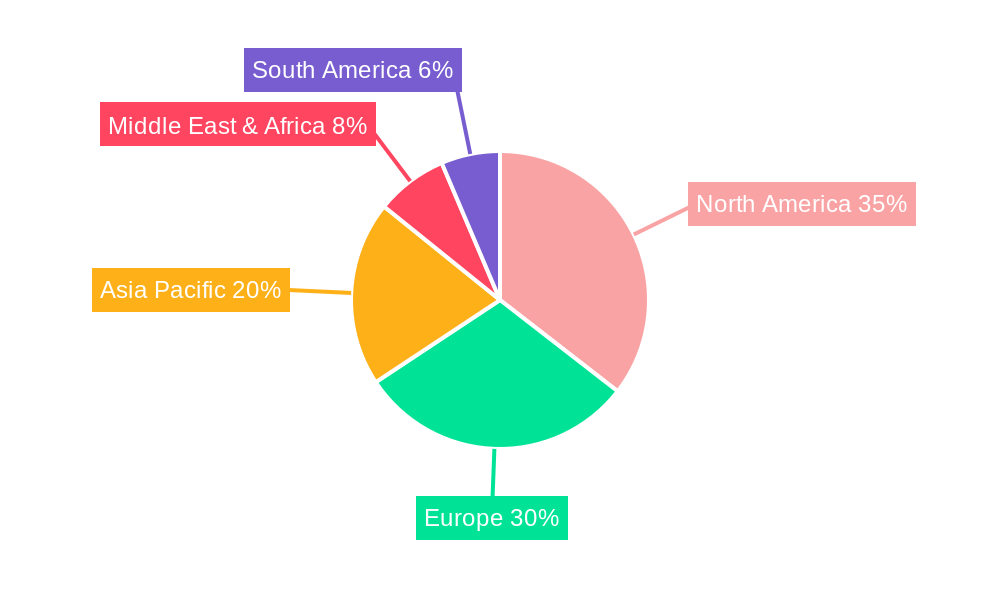
CBRNe Defense Industry Regional Market Share
Geographic Coverage of CBRNe Defense Industry
CBRNe Defense Industry REPORT HIGHLIGHTS
| Aspects | Details |
|---|---|
| Study Period | 2020-2034 |
| Base Year | 2025 |
| Estimated Year | 2026 |
| Forecast Period | 2026-2034 |
| Historical Period | 2020-2025 |
| Growth Rate | CAGR of 4.46% from 2020-2034 |
| Segmentation |
|
Table of Contents
- 1. Introduction
- 1.1. Research Scope
- 1.2. Market Segmentation
- 1.3. Research Objective
- 1.4. Definitions and Assumptions
- 2. Executive Summary
- 2.1. Market Snapshot
- 3. Market Dynamics
- 3.1. Market Drivers
- 3.2. Market Restrains
- 3.3. Market Trends
- 3.4. Market Opportunities
- 4. Market Factor Analysis
- 4.1. Porters Five Forces
- 4.1.1. Bargaining Power of Suppliers
- 4.1.2. Bargaining Power of Buyers
- 4.1.3. Threat of New Entrants
- 4.1.4. Threat of Substitutes
- 4.1.5. Competitive Rivalry
- 4.2. PESTEL analysis
- 4.3. BCG Analysis
- 4.3.1. Stars (High Growth, High Market Share)
- 4.3.2. Cash Cows (Low Growth, High Market Share)
- 4.3.3. Question Mark (High Growth, Low Market Share)
- 4.3.4. Dogs (Low Growth, Low Market Share)
- 4.4. Ansoff Matrix Analysis
- 4.5. Supply Chain Analysis
- 4.6. Regulatory Landscape
- 4.7. Current Market Potential and Opportunity Assessment (TAM–SAM–SOM Framework)
- 4.8. RAX Analyst Note
- 4.1. Porters Five Forces
- 5. Market Analysis, Insights and Forecast 2021-2033
- 5.1. Market Analysis, Insights and Forecast - by Production Analysis
- 5.2. Market Analysis, Insights and Forecast - by Consumption Analysis
- 5.3. Market Analysis, Insights and Forecast - by Import Market Analysis (Value & Volume)
- 5.4. Market Analysis, Insights and Forecast - by Export Market Analysis (Value & Volume)
- 5.5. Market Analysis, Insights and Forecast - by Price Trend Analysis
- 5.6. Market Analysis, Insights and Forecast - by Region
- 5.6.1. North America
- 5.6.2. South America
- 5.6.3. Europe
- 5.6.4. Middle East & Africa
- 5.6.5. Asia Pacific
- 6. Global CBRNe Defense Industry Analysis, Insights and Forecast, 2021-2033
- 6.1. Market Analysis, Insights and Forecast - by Production Analysis
- 6.2. Market Analysis, Insights and Forecast - by Consumption Analysis
- 6.3. Market Analysis, Insights and Forecast - by Import Market Analysis (Value & Volume)
- 6.4. Market Analysis, Insights and Forecast - by Export Market Analysis (Value & Volume)
- 6.5. Market Analysis, Insights and Forecast - by Price Trend Analysis
- 7. North America CBRNe Defense Industry Analysis, Insights and Forecast, 2020-2032
- 7.1. Market Analysis, Insights and Forecast - by Production Analysis
- 7.2. Market Analysis, Insights and Forecast - by Consumption Analysis
- 7.3. Market Analysis, Insights and Forecast - by Import Market Analysis (Value & Volume)
- 7.4. Market Analysis, Insights and Forecast - by Export Market Analysis (Value & Volume)
- 7.5. Market Analysis, Insights and Forecast - by Price Trend Analysis
- 8. South America CBRNe Defense Industry Analysis, Insights and Forecast, 2020-2032
- 8.1. Market Analysis, Insights and Forecast - by Production Analysis
- 8.2. Market Analysis, Insights and Forecast - by Consumption Analysis
- 8.3. Market Analysis, Insights and Forecast - by Import Market Analysis (Value & Volume)
- 8.4. Market Analysis, Insights and Forecast - by Export Market Analysis (Value & Volume)
- 8.5. Market Analysis, Insights and Forecast - by Price Trend Analysis
- 9. Europe CBRNe Defense Industry Analysis, Insights and Forecast, 2020-2032
- 9.1. Market Analysis, Insights and Forecast - by Production Analysis
- 9.2. Market Analysis, Insights and Forecast - by Consumption Analysis
- 9.3. Market Analysis, Insights and Forecast - by Import Market Analysis (Value & Volume)
- 9.4. Market Analysis, Insights and Forecast - by Export Market Analysis (Value & Volume)
- 9.5. Market Analysis, Insights and Forecast - by Price Trend Analysis
- 10. Middle East & Africa CBRNe Defense Industry Analysis, Insights and Forecast, 2020-2032
- 10.1. Market Analysis, Insights and Forecast - by Production Analysis
- 10.2. Market Analysis, Insights and Forecast - by Consumption Analysis
- 10.3. Market Analysis, Insights and Forecast - by Import Market Analysis (Value & Volume)
- 10.4. Market Analysis, Insights and Forecast - by Export Market Analysis (Value & Volume)
- 10.5. Market Analysis, Insights and Forecast - by Price Trend Analysis
- 11. Asia Pacific CBRNe Defense Industry Analysis, Insights and Forecast, 2020-2032
- 11.1. Market Analysis, Insights and Forecast - by Production Analysis
- 11.2. Market Analysis, Insights and Forecast - by Consumption Analysis
- 11.3. Market Analysis, Insights and Forecast - by Import Market Analysis (Value & Volume)
- 11.4. Market Analysis, Insights and Forecast - by Export Market Analysis (Value & Volume)
- 11.5. Market Analysis, Insights and Forecast - by Price Trend Analysis
- 12. Competitive Analysis
- 12.1. Company Profiles
- 12.1.1 Leidos Inc
- 12.1.1.1. Company Overview
- 12.1.1.2. Products
- 12.1.1.3. Company Financials
- 12.1.1.4. SWOT Analysis
- 12.1.2 Chemring Group PLC
- 12.1.2.1. Company Overview
- 12.1.2.2. Products
- 12.1.2.3. Company Financials
- 12.1.2.4. SWOT Analysis
- 12.1.3 Argon Electronics (UK) Ltd
- 12.1.3.1. Company Overview
- 12.1.3.2. Products
- 12.1.3.3. Company Financials
- 12.1.3.4. SWOT Analysis
- 12.1.4 KNDS - KMW+NEXTER Defense Systems N V
- 12.1.4.1. Company Overview
- 12.1.4.2. Products
- 12.1.4.3. Company Financials
- 12.1.4.4. SWOT Analysis
- 12.1.5 QinetiQ Group
- 12.1.5.1. Company Overview
- 12.1.5.2. Products
- 12.1.5.3. Company Financials
- 12.1.5.4. SWOT Analysis
- 12.1.6 Smiths Group plc
- 12.1.6.1. Company Overview
- 12.1.6.2. Products
- 12.1.6.3. Company Financials
- 12.1.6.4. SWOT Analysis
- 12.1.7 National Technology and Engineering Solutions of Sandia LLC
- 12.1.7.1. Company Overview
- 12.1.7.2. Products
- 12.1.7.3. Company Financials
- 12.1.7.4. SWOT Analysis
- 12.1.8 Battelle
- 12.1.8.1. Company Overview
- 12.1.8.2. Products
- 12.1.8.3. Company Financials
- 12.1.8.4. SWOT Analysis
- 12.1.9 Avon Polymer Products Limited
- 12.1.9.1. Company Overview
- 12.1.9.2. Products
- 12.1.9.3. Company Financials
- 12.1.9.4. SWOT Analysis
- 12.1.10 OSI Systems Inc
- 12.1.10.1. Company Overview
- 12.1.10.2. Products
- 12.1.10.3. Company Financials
- 12.1.10.4. SWOT Analysis
- 12.1.11 Saab AB
- 12.1.11.1. Company Overview
- 12.1.11.2. Products
- 12.1.11.3. Company Financials
- 12.1.11.4. SWOT Analysis
- 12.1.12 Karcher Futuretech GmbH
- 12.1.12.1. Company Overview
- 12.1.12.2. Products
- 12.1.12.3. Company Financials
- 12.1.12.4. SWOT Analysis
- 12.1.13 Teledyne FLIR LLC
- 12.1.13.1. Company Overview
- 12.1.13.2. Products
- 12.1.13.3. Company Financials
- 12.1.13.4. SWOT Analysis
- 12.1.1 Leidos Inc
- 12.2. Market Entropy
- 12.2.1 Company's Key Areas Served
- 12.2.2 Recent Developments
- 12.3. Company Market Share Analysis 2025
- 12.3.1 Top 5 Companies Market Share Analysis
- 12.3.2 Top 3 Companies Market Share Analysis
- 12.4. List of Potential Customers
- 13. Research Methodology
List of Figures
- Figure 1: Global CBRNe Defense Industry Revenue Breakdown (billion, %) by Region 2025 & 2033
- Figure 2: North America CBRNe Defense Industry Revenue (billion), by Production Analysis 2025 & 2033
- Figure 3: North America CBRNe Defense Industry Revenue Share (%), by Production Analysis 2025 & 2033
- Figure 4: North America CBRNe Defense Industry Revenue (billion), by Consumption Analysis 2025 & 2033
- Figure 5: North America CBRNe Defense Industry Revenue Share (%), by Consumption Analysis 2025 & 2033
- Figure 6: North America CBRNe Defense Industry Revenue (billion), by Import Market Analysis (Value & Volume) 2025 & 2033
- Figure 7: North America CBRNe Defense Industry Revenue Share (%), by Import Market Analysis (Value & Volume) 2025 & 2033
- Figure 8: North America CBRNe Defense Industry Revenue (billion), by Export Market Analysis (Value & Volume) 2025 & 2033
- Figure 9: North America CBRNe Defense Industry Revenue Share (%), by Export Market Analysis (Value & Volume) 2025 & 2033
- Figure 10: North America CBRNe Defense Industry Revenue (billion), by Price Trend Analysis 2025 & 2033
- Figure 11: North America CBRNe Defense Industry Revenue Share (%), by Price Trend Analysis 2025 & 2033
- Figure 12: North America CBRNe Defense Industry Revenue (billion), by Country 2025 & 2033
- Figure 13: North America CBRNe Defense Industry Revenue Share (%), by Country 2025 & 2033
- Figure 14: South America CBRNe Defense Industry Revenue (billion), by Production Analysis 2025 & 2033
- Figure 15: South America CBRNe Defense Industry Revenue Share (%), by Production Analysis 2025 & 2033
- Figure 16: South America CBRNe Defense Industry Revenue (billion), by Consumption Analysis 2025 & 2033
- Figure 17: South America CBRNe Defense Industry Revenue Share (%), by Consumption Analysis 2025 & 2033
- Figure 18: South America CBRNe Defense Industry Revenue (billion), by Import Market Analysis (Value & Volume) 2025 & 2033
- Figure 19: South America CBRNe Defense Industry Revenue Share (%), by Import Market Analysis (Value & Volume) 2025 & 2033
- Figure 20: South America CBRNe Defense Industry Revenue (billion), by Export Market Analysis (Value & Volume) 2025 & 2033
- Figure 21: South America CBRNe Defense Industry Revenue Share (%), by Export Market Analysis (Value & Volume) 2025 & 2033
- Figure 22: South America CBRNe Defense Industry Revenue (billion), by Price Trend Analysis 2025 & 2033
- Figure 23: South America CBRNe Defense Industry Revenue Share (%), by Price Trend Analysis 2025 & 2033
- Figure 24: South America CBRNe Defense Industry Revenue (billion), by Country 2025 & 2033
- Figure 25: South America CBRNe Defense Industry Revenue Share (%), by Country 2025 & 2033
- Figure 26: Europe CBRNe Defense Industry Revenue (billion), by Production Analysis 2025 & 2033
- Figure 27: Europe CBRNe Defense Industry Revenue Share (%), by Production Analysis 2025 & 2033
- Figure 28: Europe CBRNe Defense Industry Revenue (billion), by Consumption Analysis 2025 & 2033
- Figure 29: Europe CBRNe Defense Industry Revenue Share (%), by Consumption Analysis 2025 & 2033
- Figure 30: Europe CBRNe Defense Industry Revenue (billion), by Import Market Analysis (Value & Volume) 2025 & 2033
- Figure 31: Europe CBRNe Defense Industry Revenue Share (%), by Import Market Analysis (Value & Volume) 2025 & 2033
- Figure 32: Europe CBRNe Defense Industry Revenue (billion), by Export Market Analysis (Value & Volume) 2025 & 2033
- Figure 33: Europe CBRNe Defense Industry Revenue Share (%), by Export Market Analysis (Value & Volume) 2025 & 2033
- Figure 34: Europe CBRNe Defense Industry Revenue (billion), by Price Trend Analysis 2025 & 2033
- Figure 35: Europe CBRNe Defense Industry Revenue Share (%), by Price Trend Analysis 2025 & 2033
- Figure 36: Europe CBRNe Defense Industry Revenue (billion), by Country 2025 & 2033
- Figure 37: Europe CBRNe Defense Industry Revenue Share (%), by Country 2025 & 2033
- Figure 38: Middle East & Africa CBRNe Defense Industry Revenue (billion), by Production Analysis 2025 & 2033
- Figure 39: Middle East & Africa CBRNe Defense Industry Revenue Share (%), by Production Analysis 2025 & 2033
- Figure 40: Middle East & Africa CBRNe Defense Industry Revenue (billion), by Consumption Analysis 2025 & 2033
- Figure 41: Middle East & Africa CBRNe Defense Industry Revenue Share (%), by Consumption Analysis 2025 & 2033
- Figure 42: Middle East & Africa CBRNe Defense Industry Revenue (billion), by Import Market Analysis (Value & Volume) 2025 & 2033
- Figure 43: Middle East & Africa CBRNe Defense Industry Revenue Share (%), by Import Market Analysis (Value & Volume) 2025 & 2033
- Figure 44: Middle East & Africa CBRNe Defense Industry Revenue (billion), by Export Market Analysis (Value & Volume) 2025 & 2033
- Figure 45: Middle East & Africa CBRNe Defense Industry Revenue Share (%), by Export Market Analysis (Value & Volume) 2025 & 2033
- Figure 46: Middle East & Africa CBRNe Defense Industry Revenue (billion), by Price Trend Analysis 2025 & 2033
- Figure 47: Middle East & Africa CBRNe Defense Industry Revenue Share (%), by Price Trend Analysis 2025 & 2033
- Figure 48: Middle East & Africa CBRNe Defense Industry Revenue (billion), by Country 2025 & 2033
- Figure 49: Middle East & Africa CBRNe Defense Industry Revenue Share (%), by Country 2025 & 2033
- Figure 50: Asia Pacific CBRNe Defense Industry Revenue (billion), by Production Analysis 2025 & 2033
- Figure 51: Asia Pacific CBRNe Defense Industry Revenue Share (%), by Production Analysis 2025 & 2033
- Figure 52: Asia Pacific CBRNe Defense Industry Revenue (billion), by Consumption Analysis 2025 & 2033
- Figure 53: Asia Pacific CBRNe Defense Industry Revenue Share (%), by Consumption Analysis 2025 & 2033
- Figure 54: Asia Pacific CBRNe Defense Industry Revenue (billion), by Import Market Analysis (Value & Volume) 2025 & 2033
- Figure 55: Asia Pacific CBRNe Defense Industry Revenue Share (%), by Import Market Analysis (Value & Volume) 2025 & 2033
- Figure 56: Asia Pacific CBRNe Defense Industry Revenue (billion), by Export Market Analysis (Value & Volume) 2025 & 2033
- Figure 57: Asia Pacific CBRNe Defense Industry Revenue Share (%), by Export Market Analysis (Value & Volume) 2025 & 2033
- Figure 58: Asia Pacific CBRNe Defense Industry Revenue (billion), by Price Trend Analysis 2025 & 2033
- Figure 59: Asia Pacific CBRNe Defense Industry Revenue Share (%), by Price Trend Analysis 2025 & 2033
- Figure 60: Asia Pacific CBRNe Defense Industry Revenue (billion), by Country 2025 & 2033
- Figure 61: Asia Pacific CBRNe Defense Industry Revenue Share (%), by Country 2025 & 2033
List of Tables
- Table 1: Global CBRNe Defense Industry Revenue billion Forecast, by Production Analysis 2020 & 2033
- Table 2: Global CBRNe Defense Industry Revenue billion Forecast, by Consumption Analysis 2020 & 2033
- Table 3: Global CBRNe Defense Industry Revenue billion Forecast, by Import Market Analysis (Value & Volume) 2020 & 2033
- Table 4: Global CBRNe Defense Industry Revenue billion Forecast, by Export Market Analysis (Value & Volume) 2020 & 2033
- Table 5: Global CBRNe Defense Industry Revenue billion Forecast, by Price Trend Analysis 2020 & 2033
- Table 6: Global CBRNe Defense Industry Revenue billion Forecast, by Region 2020 & 2033
- Table 7: Global CBRNe Defense Industry Revenue billion Forecast, by Production Analysis 2020 & 2033
- Table 8: Global CBRNe Defense Industry Revenue billion Forecast, by Consumption Analysis 2020 & 2033
- Table 9: Global CBRNe Defense Industry Revenue billion Forecast, by Import Market Analysis (Value & Volume) 2020 & 2033
- Table 10: Global CBRNe Defense Industry Revenue billion Forecast, by Export Market Analysis (Value & Volume) 2020 & 2033
- Table 11: Global CBRNe Defense Industry Revenue billion Forecast, by Price Trend Analysis 2020 & 2033
- Table 12: Global CBRNe Defense Industry Revenue billion Forecast, by Country 2020 & 2033
- Table 13: United States CBRNe Defense Industry Revenue (billion) Forecast, by Application 2020 & 2033
- Table 14: Canada CBRNe Defense Industry Revenue (billion) Forecast, by Application 2020 & 2033
- Table 15: Mexico CBRNe Defense Industry Revenue (billion) Forecast, by Application 2020 & 2033
- Table 16: Global CBRNe Defense Industry Revenue billion Forecast, by Production Analysis 2020 & 2033
- Table 17: Global CBRNe Defense Industry Revenue billion Forecast, by Consumption Analysis 2020 & 2033
- Table 18: Global CBRNe Defense Industry Revenue billion Forecast, by Import Market Analysis (Value & Volume) 2020 & 2033
- Table 19: Global CBRNe Defense Industry Revenue billion Forecast, by Export Market Analysis (Value & Volume) 2020 & 2033
- Table 20: Global CBRNe Defense Industry Revenue billion Forecast, by Price Trend Analysis 2020 & 2033
- Table 21: Global CBRNe Defense Industry Revenue billion Forecast, by Country 2020 & 2033
- Table 22: Brazil CBRNe Defense Industry Revenue (billion) Forecast, by Application 2020 & 2033
- Table 23: Argentina CBRNe Defense Industry Revenue (billion) Forecast, by Application 2020 & 2033
- Table 24: Rest of South America CBRNe Defense Industry Revenue (billion) Forecast, by Application 2020 & 2033
- Table 25: Global CBRNe Defense Industry Revenue billion Forecast, by Production Analysis 2020 & 2033
- Table 26: Global CBRNe Defense Industry Revenue billion Forecast, by Consumption Analysis 2020 & 2033
- Table 27: Global CBRNe Defense Industry Revenue billion Forecast, by Import Market Analysis (Value & Volume) 2020 & 2033
- Table 28: Global CBRNe Defense Industry Revenue billion Forecast, by Export Market Analysis (Value & Volume) 2020 & 2033
- Table 29: Global CBRNe Defense Industry Revenue billion Forecast, by Price Trend Analysis 2020 & 2033
- Table 30: Global CBRNe Defense Industry Revenue billion Forecast, by Country 2020 & 2033
- Table 31: United Kingdom CBRNe Defense Industry Revenue (billion) Forecast, by Application 2020 & 2033
- Table 32: Germany CBRNe Defense Industry Revenue (billion) Forecast, by Application 2020 & 2033
- Table 33: France CBRNe Defense Industry Revenue (billion) Forecast, by Application 2020 & 2033
- Table 34: Italy CBRNe Defense Industry Revenue (billion) Forecast, by Application 2020 & 2033
- Table 35: Spain CBRNe Defense Industry Revenue (billion) Forecast, by Application 2020 & 2033
- Table 36: Russia CBRNe Defense Industry Revenue (billion) Forecast, by Application 2020 & 2033
- Table 37: Benelux CBRNe Defense Industry Revenue (billion) Forecast, by Application 2020 & 2033
- Table 38: Nordics CBRNe Defense Industry Revenue (billion) Forecast, by Application 2020 & 2033
- Table 39: Rest of Europe CBRNe Defense Industry Revenue (billion) Forecast, by Application 2020 & 2033
- Table 40: Global CBRNe Defense Industry Revenue billion Forecast, by Production Analysis 2020 & 2033
- Table 41: Global CBRNe Defense Industry Revenue billion Forecast, by Consumption Analysis 2020 & 2033
- Table 42: Global CBRNe Defense Industry Revenue billion Forecast, by Import Market Analysis (Value & Volume) 2020 & 2033
- Table 43: Global CBRNe Defense Industry Revenue billion Forecast, by Export Market Analysis (Value & Volume) 2020 & 2033
- Table 44: Global CBRNe Defense Industry Revenue billion Forecast, by Price Trend Analysis 2020 & 2033
- Table 45: Global CBRNe Defense Industry Revenue billion Forecast, by Country 2020 & 2033
- Table 46: Turkey CBRNe Defense Industry Revenue (billion) Forecast, by Application 2020 & 2033
- Table 47: Israel CBRNe Defense Industry Revenue (billion) Forecast, by Application 2020 & 2033
- Table 48: GCC CBRNe Defense Industry Revenue (billion) Forecast, by Application 2020 & 2033
- Table 49: North Africa CBRNe Defense Industry Revenue (billion) Forecast, by Application 2020 & 2033
- Table 50: South Africa CBRNe Defense Industry Revenue (billion) Forecast, by Application 2020 & 2033
- Table 51: Rest of Middle East & Africa CBRNe Defense Industry Revenue (billion) Forecast, by Application 2020 & 2033
- Table 52: Global CBRNe Defense Industry Revenue billion Forecast, by Production Analysis 2020 & 2033
- Table 53: Global CBRNe Defense Industry Revenue billion Forecast, by Consumption Analysis 2020 & 2033
- Table 54: Global CBRNe Defense Industry Revenue billion Forecast, by Import Market Analysis (Value & Volume) 2020 & 2033
- Table 55: Global CBRNe Defense Industry Revenue billion Forecast, by Export Market Analysis (Value & Volume) 2020 & 2033
- Table 56: Global CBRNe Defense Industry Revenue billion Forecast, by Price Trend Analysis 2020 & 2033
- Table 57: Global CBRNe Defense Industry Revenue billion Forecast, by Country 2020 & 2033
- Table 58: China CBRNe Defense Industry Revenue (billion) Forecast, by Application 2020 & 2033
- Table 59: India CBRNe Defense Industry Revenue (billion) Forecast, by Application 2020 & 2033
- Table 60: Japan CBRNe Defense Industry Revenue (billion) Forecast, by Application 2020 & 2033
- Table 61: South Korea CBRNe Defense Industry Revenue (billion) Forecast, by Application 2020 & 2033
- Table 62: ASEAN CBRNe Defense Industry Revenue (billion) Forecast, by Application 2020 & 2033
- Table 63: Oceania CBRNe Defense Industry Revenue (billion) Forecast, by Application 2020 & 2033
- Table 64: Rest of Asia Pacific CBRNe Defense Industry Revenue (billion) Forecast, by Application 2020 & 2033
Frequently Asked Questions
1. What is the projected Compound Annual Growth Rate (CAGR) of the CBRNe Defense Industry?
The projected CAGR is approximately 4.46%.
2. Which companies are prominent players in the CBRNe Defense Industry?
Key companies in the market include Leidos Inc, Chemring Group PLC, Argon Electronics (UK) Ltd, KNDS - KMW+NEXTER Defense Systems N V, QinetiQ Group, Smiths Group plc, National Technology and Engineering Solutions of Sandia LLC, Battelle, Avon Polymer Products Limited, OSI Systems Inc, Saab AB, Karcher Futuretech GmbH, Teledyne FLIR LLC.
3. What are the main segments of the CBRNe Defense Industry?
The market segments include Production Analysis, Consumption Analysis, Import Market Analysis (Value & Volume), Export Market Analysis (Value & Volume), Price Trend Analysis.
4. Can you provide details about the market size?
The market size is estimated to be USD 22.5 billion as of 2022.
5. What are some drivers contributing to market growth?
N/A
6. What are the notable trends driving market growth?
The Military Segment Accounted for Largest Market Share.
7. Are there any restraints impacting market growth?
N/A
8. Can you provide examples of recent developments in the market?
April 2022: Kromek was awarded a contract worth GBP 1.7 million (USD 2.23 million) from an existing UK government-related customer to deliver CBRN (chemical, biological, radiological, and nuclear) detection services and products. The delivery of CBRN products is scheduled to be delivered through 2026.
9. What pricing options are available for accessing the report?
Pricing options include single-user, multi-user, and enterprise licenses priced at USD 4750, USD 5250, and USD 8750 respectively.
10. Is the market size provided in terms of value or volume?
The market size is provided in terms of value, measured in billion.
11. Are there any specific market keywords associated with the report?
Yes, the market keyword associated with the report is "CBRNe Defense Industry," which aids in identifying and referencing the specific market segment covered.
12. How do I determine which pricing option suits my needs best?
The pricing options vary based on user requirements and access needs. Individual users may opt for single-user licenses, while businesses requiring broader access may choose multi-user or enterprise licenses for cost-effective access to the report.
13. Are there any additional resources or data provided in the CBRNe Defense Industry report?
While the report offers comprehensive insights, it's advisable to review the specific contents or supplementary materials provided to ascertain if additional resources or data are available.
14. How can I stay updated on further developments or reports in the CBRNe Defense Industry?
To stay informed about further developments, trends, and reports in the CBRNe Defense Industry, consider subscribing to industry newsletters, following relevant companies and organizations, or regularly checking reputable industry news sources and publications.
Methodology
Step 1 - Identification of Relevant Samples Size from Population Database


Step 2 - Approaches for Defining Global Market Size (Value, Volume* & Price*)

Note*: In applicable scenarios
Step 3 - Data Sources
Primary Research
- Web Analytics
- Survey Reports
- Research Institute
- Latest Research Reports
- Opinion Leaders
Secondary Research
- Annual Reports
- White Paper
- Latest Press Release
- Industry Association
- Paid Database
- Investor Presentations

Step 4 - Data Triangulation
Involves using different sources of information in order to increase the validity of a study
These sources are likely to be stakeholders in a program - participants, other researchers, program staff, other community members, and so on.
Then we put all data in single framework & apply various statistical tools to find out the dynamic on the market.
During the analysis stage, feedback from the stakeholder groups would be compared to determine areas of agreement as well as areas of divergence