

Key Insights
The global ceramic foam market is poised for significant expansion, with an estimated Compound Annual Growth Rate (CAGR) of 5.00% from 2025 to 2033. This growth is propelled by escalating demand across key industries. The automotive sector is a primary driver, integrating ceramic foam for advanced exhaust filters and lightweight thermal insulation solutions, responding to stringent emission standards and the need for high-performance components. The construction industry also presents substantial opportunities, leveraging ceramic foams for superior building insulation, enhancing energy efficiency and acoustic comfort. Furthermore, the expanding chemical synthesis and pollution control sectors are increasingly adopting ceramic foams for catalyst support and efficient molten metal filtration. The market is segmented by type (aluminum oxide, zirconium oxide, silicon carbide, and others), application (automotive exhaust filters, thermal and acoustic insulation, molten metal filtration, catalyst support, furnace lining, and others), and end-user industry (foundry, construction, automotive, pollution control and chemical synthesis, and others). The competitive landscape is characterized by a fragmented structure, with leading players like Saint-Gobain and Vesuvius focusing on continuous innovation and strategic collaborations to secure market share. Regionally, the Asia-Pacific market, led by China and India, is projected to dominate, driven by rapid industrialization and infrastructure development. North America and Europe are also anticipated to contribute robustly, fueled by advancements in automotive technology and stringent environmental regulations.
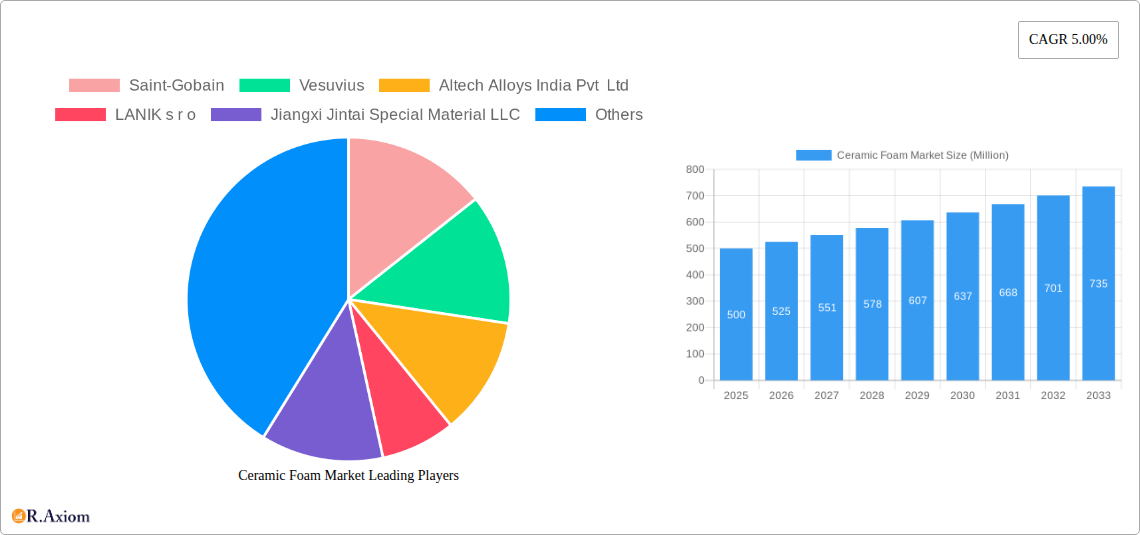
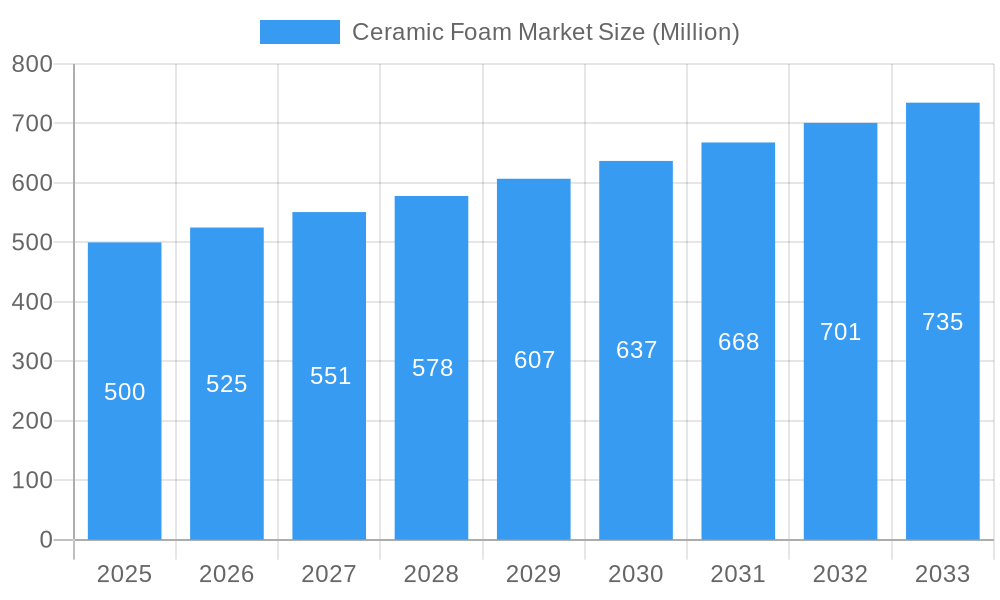
Ceramic Foam Market Market Size (In Million)
The market's upward trajectory is supported by several key factors. Technological advancements are yielding ceramic foams with enhanced properties, including higher porosity, superior thermal shock resistance, and customizable chemical compositions tailored for specific applications. Government initiatives promoting energy efficiency and environmental sustainability further bolster demand. However, the market navigates challenges such as relatively high production costs and the availability of substitute materials. Despite these hurdles, ongoing innovation and burgeoning demand from diverse industries indicate sustained expansion for the ceramic foam market, presenting considerable opportunities for manufacturers and investors. Industry reports and growth trend analyses suggest a substantial market size, estimated at 311 million in the base year 2025, with projections to reach several hundred million, potentially exceeding a billion dollars within the forecast period.
Ceramic Foam Market Company Market Share
Ceramic Foam Market: A Comprehensive Report (2019-2033)
This detailed report provides a comprehensive analysis of the global Ceramic Foam Market, offering actionable insights for stakeholders across the value chain. The study period spans from 2019 to 2033, with 2025 serving as the base and estimated year. The forecast period extends from 2025 to 2033, encompassing historical data from 2019 to 2024. The report segments the market by type (Aluminum Oxide, Zirconium Oxide, Silicon Carbide, Other Types), application (Automotive Exhaust Filters, Thermal and Acoustic Insulation, Molten Metal Filtration, Catalyst Support, Furnace Lining, Other Applications), and end-user industry (Foundry, Construction, Automotive, Pollution Control and Chemical Synthesis, Other End-user Industries). Key players analyzed include Saint-Gobain, Vesuvius, Altech Alloys India Pvt Ltd, LANIK s r o, Jiangxi Jintai Special Material LLC, Ultramet, ERG Aerospace Corp, SELEE Corporation, Induceramic, Drache GmbH, FERRO-TERM LTD, and Pyrotek.
Ceramic Foam Market Concentration & Innovation
The Ceramic Foam market exhibits a moderately concentrated landscape, with a few major players holding significant market share. Saint-Gobain and Vesuvius, for example, command a combined xx% market share in 2025, driven by their extensive product portfolios and established global presence. However, several smaller players are also actively contributing to innovation, leading to a dynamic competitive environment. Market concentration is expected to remain relatively stable during the forecast period, with potential shifts due to mergers and acquisitions (M&A) activities.
Innovation in the Ceramic Foam market is largely driven by the need for enhanced performance characteristics, including improved thermal insulation, higher filtration efficiency, and greater durability. Recent innovations focus on developing lighter, stronger, and more cost-effective ceramic foam materials, leading to wider adoption across diverse applications. Regulatory frameworks, particularly those related to environmental protection and safety, also significantly influence innovation. For instance, stricter emission regulations are driving the demand for high-performance ceramic foam filters in the automotive industry. Product substitutes, such as metallic foams and polymeric materials, present a level of competition, but the unique properties of ceramic foam, such as high-temperature resistance and chemical inertness, often maintain its competitive advantage. End-user trends, particularly the growing demand for lightweight materials in automotive and aerospace applications, are propelling innovation toward improved material design and manufacturing processes. Over the past five years, the industry has witnessed several M&A deals, with an estimated total value of $xx Million. These acquisitions often aim to expand product portfolios, access new markets, and enhance technological capabilities.
Ceramic Foam Market Industry Trends & Insights
The global Ceramic Foam market is experiencing robust growth, with a projected CAGR of xx% during the forecast period (2025-2033). This growth is primarily fueled by the increasing demand for advanced materials across various industries. Technological advancements, such as the development of novel ceramic compositions and manufacturing techniques, are enhancing the performance characteristics of ceramic foams, leading to broader adoption. Consumer preferences are shifting toward lightweight, energy-efficient, and environmentally friendly materials, further boosting market demand. The automotive industry, a major end-user, is witnessing a significant rise in the adoption of ceramic foam filters due to stricter emission regulations. The construction sector also shows substantial potential, with ceramic foam finding applications in thermal and acoustic insulation.
Competitive dynamics within the market are intense, characterized by ongoing product development, strategic partnerships, and capacity expansion initiatives by major players. The market penetration rate of ceramic foams in various applications is gradually increasing, driven by the aforementioned factors, with specific application segments, like automotive exhaust filters, already demonstrating high market penetration. The increasing focus on sustainability across various industries is also driving demand, with ceramic foams offering eco-friendly alternatives in several applications. These trends are expected to shape the market landscape during the forecast period, influencing product innovation, competitive dynamics, and market expansion.
Dominant Markets & Segments in Ceramic Foam Market
The Automotive end-user industry currently dominates the Ceramic Foam market, driven by the increasing demand for automotive exhaust filters and lightweight components in vehicles. This segment is expected to maintain its leadership position throughout the forecast period, driven by stringent emission regulations and growing vehicle production.
- Key Drivers in the Automotive Sector:
- Stringent emission regulations worldwide
- Growing demand for fuel-efficient vehicles
- Technological advancements in automotive exhaust systems
- Increasing production of vehicles globally
The Aluminum Oxide type segment holds the largest share of the Ceramic Foam market in 2025, due to its cost-effectiveness, good thermal properties, and wide availability. However, the Silicon Carbide segment is expected to witness significant growth during the forecast period owing to its superior strength and high-temperature resistance.
- Key Drivers in the Aluminum Oxide Segment: Cost-effectiveness, wide availability
- Key Drivers in the Silicon Carbide Segment: Superior strength, high-temperature resistance
Regionally, Asia-Pacific is expected to dominate the market in 2025 and beyond, fueled by rapid industrialization, rising automotive production, and increasing infrastructure development. Favorable economic policies and government initiatives promoting sustainable materials also support this dominance.
Ceramic Foam Market Product Developments
Recent product innovations focus on enhancing the properties of ceramic foams through the incorporation of novel materials and improved manufacturing processes. This includes the development of lightweight, high-strength ceramic foams with enhanced thermal insulation and filtration capabilities. These innovations cater to specific application needs across diverse industries, offering competitive advantages in terms of performance, cost, and sustainability. Technological trends are focused on optimizing manufacturing processes to reduce costs and improve product consistency, ensuring better market fit.
Report Scope & Segmentation Analysis
This report comprehensively analyzes the Ceramic Foam market across various segments. By Type: Aluminum Oxide, Zirconium Oxide, Silicon Carbide, and Other Types, each segment's growth projections, market size, and competitive dynamics are detailed. Similarly, by Application: Automotive Exhaust Filters, Thermal and Acoustic Insulation, Molten Metal Filtration, Catalyst Support, Furnace Lining, and Other Applications, and by End-user Industry: Foundry, Construction, Automotive, Pollution Control and Chemical Synthesis, and Other End-user Industries, the report provides detailed analyses, including growth projections and market size estimations. Competitive dynamics within each segment are also examined, highlighting key players and their market strategies.
Key Drivers of Ceramic Foam Market Growth
Several key factors fuel the growth of the Ceramic Foam market. These include the increasing demand for lightweight materials in various industries, particularly automotive and aerospace; the rising need for energy-efficient solutions in construction and industrial applications; and the stringent emission regulations that necessitate high-performance ceramic foam filters. Technological advancements leading to improved manufacturing processes and material properties also play a vital role. Government initiatives and subsidies for sustainable materials further accelerate market growth.
Challenges in the Ceramic Foam Market Sector
Despite the growth prospects, the Ceramic Foam market faces certain challenges. High manufacturing costs can limit its broader adoption in price-sensitive markets. The availability and cost of raw materials can also fluctuate, impacting production and profitability. Furthermore, intense competition from alternative materials and the need for consistent quality control pose additional hurdles. These factors can constrain the overall market growth if not appropriately addressed.
Emerging Opportunities in Ceramic Foam Market
The Ceramic Foam market presents several opportunities. The growing demand for high-performance materials in advanced applications, such as aerospace and energy, offers significant potential. The development of new ceramic compositions with enhanced properties creates further opportunities for market expansion. Increased focus on sustainable manufacturing practices and the development of recycling methods for ceramic foams offer additional avenues for growth.
Leading Players in the Ceramic Foam Market Market
- Saint-Gobain
- Vesuvius
- Altech Alloys India Pvt Ltd
- LANIK s r o
- Jiangxi Jintai Special Material LLC
- Ultramet
- ERG Aerospace Corp
- SELEE Corporation
- Induceramic
- Drache GmbH
- FERRO-TERM LTD
- Pyrotek
Key Developments in Ceramic Foam Market Industry
- January 2023: Saint-Gobain launched a new line of high-performance ceramic foams for automotive exhaust filters.
- June 2022: Vesuvius acquired a smaller ceramic foam manufacturer, expanding its product portfolio and market reach.
- October 2021: Altech Alloys India Pvt Ltd invested in a new manufacturing facility for increased ceramic foam production capacity.
- (Further details on specific developments will be included in the full report)
Strategic Outlook for Ceramic Foam Market Market
The Ceramic Foam market is poised for continued growth, driven by technological advancements, increasing demand from diverse industries, and supportive government policies. Focus on innovation, strategic partnerships, and expansion into new markets are crucial for sustained success. The development of eco-friendly manufacturing processes and the exploration of new applications will further enhance market potential. The market's future is bright, with significant growth opportunities across various regions and application segments.
Ceramic Foam Market Segmentation
-
1. Type
- 1.1. Aluminum Oxide
- 1.2. Zirconium Oxide
- 1.3. Silicon Carbide
- 1.4. Other Types
-
2. Application
- 2.1. Automotive Exhaust Filters
- 2.2. Thermal and Acoustic Insulation
- 2.3. Molten Metal Filtration
- 2.4. Catalyst Support
- 2.5. Furnace Lining
- 2.6. Other Applications
-
3. End-user Industry
- 3.1. Foundry
- 3.2. Construction
- 3.3. Automotive
- 3.4. Pollution Control and Chemical Synthesis
- 3.5. Other End-user Industries
Ceramic Foam Market Segmentation By Geography
-
1. Asia Pacific
- 1.1. China
- 1.2. India
- 1.3. Japan
- 1.4. South Korea
- 1.5. Rest of Asia Pacific
-
2. North America
- 2.1. United States
- 2.2. Canada
- 2.3. Mexico
-
3. Europe
- 3.1. Germany
- 3.2. United Kingdom
- 3.3. Italy
- 3.4. France
- 3.5. Rest of Europe
-
4. South America
- 4.1. Brazil
- 4.2. Argentina
- 4.3. Rest of South America
-
5. Middle East and Africa
- 5.1. Saudi Arabia
- 5.2. South Africa
- 5.3. Rest of Middle East and Africa
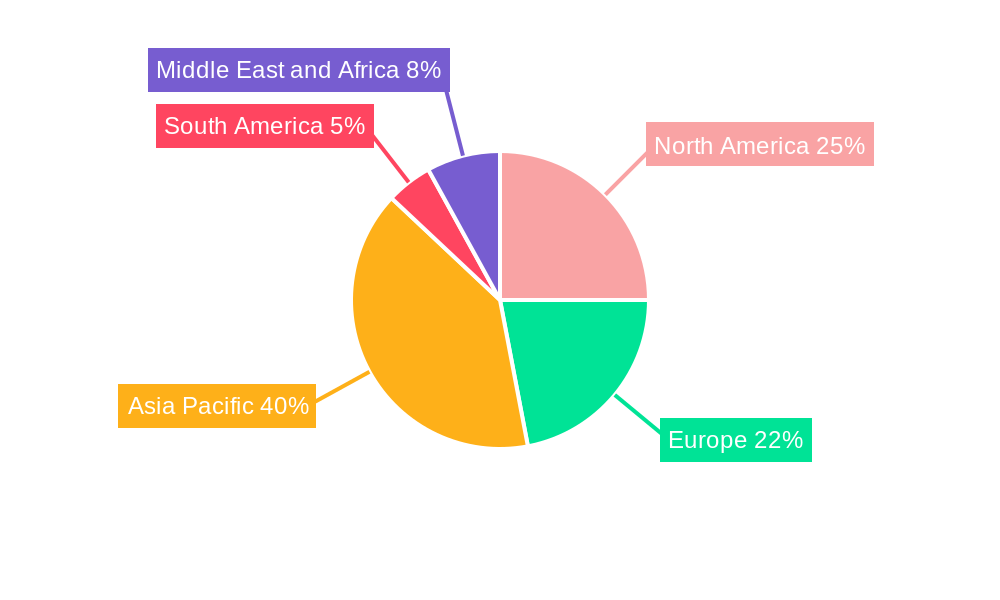
Ceramic Foam Market Regional Market Share
Geographic Coverage of Ceramic Foam Market
Ceramic Foam Market REPORT HIGHLIGHTS
| Aspects | Details |
|---|---|
| Study Period | 2020-2034 |
| Base Year | 2025 |
| Estimated Year | 2026 |
| Forecast Period | 2026-2034 |
| Historical Period | 2020-2025 |
| Growth Rate | CAGR of 3% from 2020-2034 |
| Segmentation |
|
Table of Contents
- 1. Introduction
- 1.1. Research Scope
- 1.2. Market Segmentation
- 1.3. Research Objective
- 1.4. Definitions and Assumptions
- 2. Executive Summary
- 2.1. Market Snapshot
- 3. Market Dynamics
- 3.1. Market Drivers
- 3.2. Market Restrains
- 3.3. Market Trends
- 3.4. Market Opportunities
- 4. Market Factor Analysis
- 4.1. Porters Five Forces
- 4.1.1. Bargaining Power of Suppliers
- 4.1.2. Bargaining Power of Buyers
- 4.1.3. Threat of New Entrants
- 4.1.4. Threat of Substitutes
- 4.1.5. Competitive Rivalry
- 4.2. PESTEL analysis
- 4.3. BCG Analysis
- 4.3.1. Stars (High Growth, High Market Share)
- 4.3.2. Cash Cows (Low Growth, High Market Share)
- 4.3.3. Question Mark (High Growth, Low Market Share)
- 4.3.4. Dogs (Low Growth, Low Market Share)
- 4.4. Ansoff Matrix Analysis
- 4.5. Supply Chain Analysis
- 4.6. Regulatory Landscape
- 4.7. Current Market Potential and Opportunity Assessment (TAM–SAM–SOM Framework)
- 4.8. RAX Analyst Note
- 4.1. Porters Five Forces
- 5. Market Analysis, Insights and Forecast 2021-2033
- 5.1. Market Analysis, Insights and Forecast - by Type
- 5.1.1. Aluminum Oxide
- 5.1.2. Zirconium Oxide
- 5.1.3. Silicon Carbide
- 5.1.4. Other Types
- 5.2. Market Analysis, Insights and Forecast - by Application
- 5.2.1. Automotive Exhaust Filters
- 5.2.2. Thermal and Acoustic Insulation
- 5.2.3. Molten Metal Filtration
- 5.2.4. Catalyst Support
- 5.2.5. Furnace Lining
- 5.2.6. Other Applications
- 5.3. Market Analysis, Insights and Forecast - by End-user Industry
- 5.3.1. Foundry
- 5.3.2. Construction
- 5.3.3. Automotive
- 5.3.4. Pollution Control and Chemical Synthesis
- 5.3.5. Other End-user Industries
- 5.4. Market Analysis, Insights and Forecast - by Region
- 5.4.1. Asia Pacific
- 5.4.2. North America
- 5.4.3. Europe
- 5.4.4. South America
- 5.4.5. Middle East and Africa
- 5.1. Market Analysis, Insights and Forecast - by Type
- 6. Global Ceramic Foam Market Analysis, Insights and Forecast, 2021-2033
- 6.1. Market Analysis, Insights and Forecast - by Type
- 6.1.1. Aluminum Oxide
- 6.1.2. Zirconium Oxide
- 6.1.3. Silicon Carbide
- 6.1.4. Other Types
- 6.2. Market Analysis, Insights and Forecast - by Application
- 6.2.1. Automotive Exhaust Filters
- 6.2.2. Thermal and Acoustic Insulation
- 6.2.3. Molten Metal Filtration
- 6.2.4. Catalyst Support
- 6.2.5. Furnace Lining
- 6.2.6. Other Applications
- 6.3. Market Analysis, Insights and Forecast - by End-user Industry
- 6.3.1. Foundry
- 6.3.2. Construction
- 6.3.3. Automotive
- 6.3.4. Pollution Control and Chemical Synthesis
- 6.3.5. Other End-user Industries
- 6.1. Market Analysis, Insights and Forecast - by Type
- 7. Asia Pacific Ceramic Foam Market Analysis, Insights and Forecast, 2020-2032
- 7.1. Market Analysis, Insights and Forecast - by Type
- 7.1.1. Aluminum Oxide
- 7.1.2. Zirconium Oxide
- 7.1.3. Silicon Carbide
- 7.1.4. Other Types
- 7.2. Market Analysis, Insights and Forecast - by Application
- 7.2.1. Automotive Exhaust Filters
- 7.2.2. Thermal and Acoustic Insulation
- 7.2.3. Molten Metal Filtration
- 7.2.4. Catalyst Support
- 7.2.5. Furnace Lining
- 7.2.6. Other Applications
- 7.3. Market Analysis, Insights and Forecast - by End-user Industry
- 7.3.1. Foundry
- 7.3.2. Construction
- 7.3.3. Automotive
- 7.3.4. Pollution Control and Chemical Synthesis
- 7.3.5. Other End-user Industries
- 7.1. Market Analysis, Insights and Forecast - by Type
- 8. North America Ceramic Foam Market Analysis, Insights and Forecast, 2020-2032
- 8.1. Market Analysis, Insights and Forecast - by Type
- 8.1.1. Aluminum Oxide
- 8.1.2. Zirconium Oxide
- 8.1.3. Silicon Carbide
- 8.1.4. Other Types
- 8.2. Market Analysis, Insights and Forecast - by Application
- 8.2.1. Automotive Exhaust Filters
- 8.2.2. Thermal and Acoustic Insulation
- 8.2.3. Molten Metal Filtration
- 8.2.4. Catalyst Support
- 8.2.5. Furnace Lining
- 8.2.6. Other Applications
- 8.3. Market Analysis, Insights and Forecast - by End-user Industry
- 8.3.1. Foundry
- 8.3.2. Construction
- 8.3.3. Automotive
- 8.3.4. Pollution Control and Chemical Synthesis
- 8.3.5. Other End-user Industries
- 8.1. Market Analysis, Insights and Forecast - by Type
- 9. Europe Ceramic Foam Market Analysis, Insights and Forecast, 2020-2032
- 9.1. Market Analysis, Insights and Forecast - by Type
- 9.1.1. Aluminum Oxide
- 9.1.2. Zirconium Oxide
- 9.1.3. Silicon Carbide
- 9.1.4. Other Types
- 9.2. Market Analysis, Insights and Forecast - by Application
- 9.2.1. Automotive Exhaust Filters
- 9.2.2. Thermal and Acoustic Insulation
- 9.2.3. Molten Metal Filtration
- 9.2.4. Catalyst Support
- 9.2.5. Furnace Lining
- 9.2.6. Other Applications
- 9.3. Market Analysis, Insights and Forecast - by End-user Industry
- 9.3.1. Foundry
- 9.3.2. Construction
- 9.3.3. Automotive
- 9.3.4. Pollution Control and Chemical Synthesis
- 9.3.5. Other End-user Industries
- 9.1. Market Analysis, Insights and Forecast - by Type
- 10. South America Ceramic Foam Market Analysis, Insights and Forecast, 2020-2032
- 10.1. Market Analysis, Insights and Forecast - by Type
- 10.1.1. Aluminum Oxide
- 10.1.2. Zirconium Oxide
- 10.1.3. Silicon Carbide
- 10.1.4. Other Types
- 10.2. Market Analysis, Insights and Forecast - by Application
- 10.2.1. Automotive Exhaust Filters
- 10.2.2. Thermal and Acoustic Insulation
- 10.2.3. Molten Metal Filtration
- 10.2.4. Catalyst Support
- 10.2.5. Furnace Lining
- 10.2.6. Other Applications
- 10.3. Market Analysis, Insights and Forecast - by End-user Industry
- 10.3.1. Foundry
- 10.3.2. Construction
- 10.3.3. Automotive
- 10.3.4. Pollution Control and Chemical Synthesis
- 10.3.5. Other End-user Industries
- 10.1. Market Analysis, Insights and Forecast - by Type
- 11. Middle East and Africa Ceramic Foam Market Analysis, Insights and Forecast, 2020-2032
- 11.1. Market Analysis, Insights and Forecast - by Type
- 11.1.1. Aluminum Oxide
- 11.1.2. Zirconium Oxide
- 11.1.3. Silicon Carbide
- 11.1.4. Other Types
- 11.2. Market Analysis, Insights and Forecast - by Application
- 11.2.1. Automotive Exhaust Filters
- 11.2.2. Thermal and Acoustic Insulation
- 11.2.3. Molten Metal Filtration
- 11.2.4. Catalyst Support
- 11.2.5. Furnace Lining
- 11.2.6. Other Applications
- 11.3. Market Analysis, Insights and Forecast - by End-user Industry
- 11.3.1. Foundry
- 11.3.2. Construction
- 11.3.3. Automotive
- 11.3.4. Pollution Control and Chemical Synthesis
- 11.3.5. Other End-user Industries
- 11.1. Market Analysis, Insights and Forecast - by Type
- 12. Competitive Analysis
- 12.1. Company Profiles
- 12.1.1 Saint-Gobain
- 12.1.1.1. Company Overview
- 12.1.1.2. Products
- 12.1.1.3. Company Financials
- 12.1.1.4. SWOT Analysis
- 12.1.2 Vesuvius
- 12.1.2.1. Company Overview
- 12.1.2.2. Products
- 12.1.2.3. Company Financials
- 12.1.2.4. SWOT Analysis
- 12.1.3 Altech Alloys India Pvt Ltd
- 12.1.3.1. Company Overview
- 12.1.3.2. Products
- 12.1.3.3. Company Financials
- 12.1.3.4. SWOT Analysis
- 12.1.4 LANIK s r o
- 12.1.4.1. Company Overview
- 12.1.4.2. Products
- 12.1.4.3. Company Financials
- 12.1.4.4. SWOT Analysis
- 12.1.5 Jiangxi Jintai Special Material LLC
- 12.1.5.1. Company Overview
- 12.1.5.2. Products
- 12.1.5.3. Company Financials
- 12.1.5.4. SWOT Analysis
- 12.1.6 Ultramet
- 12.1.6.1. Company Overview
- 12.1.6.2. Products
- 12.1.6.3. Company Financials
- 12.1.6.4. SWOT Analysis
- 12.1.7 ERG Aerospace Corp
- 12.1.7.1. Company Overview
- 12.1.7.2. Products
- 12.1.7.3. Company Financials
- 12.1.7.4. SWOT Analysis
- 12.1.8 SELEE Corporation
- 12.1.8.1. Company Overview
- 12.1.8.2. Products
- 12.1.8.3. Company Financials
- 12.1.8.4. SWOT Analysis
- 12.1.9 Induceramic
- 12.1.9.1. Company Overview
- 12.1.9.2. Products
- 12.1.9.3. Company Financials
- 12.1.9.4. SWOT Analysis
- 12.1.10 Drache GmbH
- 12.1.10.1. Company Overview
- 12.1.10.2. Products
- 12.1.10.3. Company Financials
- 12.1.10.4. SWOT Analysis
- 12.1.11 FERRO-TERM LTD
- 12.1.11.1. Company Overview
- 12.1.11.2. Products
- 12.1.11.3. Company Financials
- 12.1.11.4. SWOT Analysis
- 12.1.12 Pyrotek
- 12.1.12.1. Company Overview
- 12.1.12.2. Products
- 12.1.12.3. Company Financials
- 12.1.12.4. SWOT Analysis
- 12.1.1 Saint-Gobain
- 12.2. Market Entropy
- 12.2.1 Company's Key Areas Served
- 12.2.2 Recent Developments
- 12.3. Company Market Share Analysis 2025
- 12.3.1 Top 5 Companies Market Share Analysis
- 12.3.2 Top 3 Companies Market Share Analysis
- 12.4. List of Potential Customers
- 13. Research Methodology
List of Figures
- Figure 1: Global Ceramic Foam Market Revenue Breakdown (million, %) by Region 2025 & 2033
- Figure 2: Global Ceramic Foam Market Volume Breakdown (K Tons, %) by Region 2025 & 2033
- Figure 3: Asia Pacific Ceramic Foam Market Revenue (million), by Type 2025 & 2033
- Figure 4: Asia Pacific Ceramic Foam Market Volume (K Tons), by Type 2025 & 2033
- Figure 5: Asia Pacific Ceramic Foam Market Revenue Share (%), by Type 2025 & 2033
- Figure 6: Asia Pacific Ceramic Foam Market Volume Share (%), by Type 2025 & 2033
- Figure 7: Asia Pacific Ceramic Foam Market Revenue (million), by Application 2025 & 2033
- Figure 8: Asia Pacific Ceramic Foam Market Volume (K Tons), by Application 2025 & 2033
- Figure 9: Asia Pacific Ceramic Foam Market Revenue Share (%), by Application 2025 & 2033
- Figure 10: Asia Pacific Ceramic Foam Market Volume Share (%), by Application 2025 & 2033
- Figure 11: Asia Pacific Ceramic Foam Market Revenue (million), by End-user Industry 2025 & 2033
- Figure 12: Asia Pacific Ceramic Foam Market Volume (K Tons), by End-user Industry 2025 & 2033
- Figure 13: Asia Pacific Ceramic Foam Market Revenue Share (%), by End-user Industry 2025 & 2033
- Figure 14: Asia Pacific Ceramic Foam Market Volume Share (%), by End-user Industry 2025 & 2033
- Figure 15: Asia Pacific Ceramic Foam Market Revenue (million), by Country 2025 & 2033
- Figure 16: Asia Pacific Ceramic Foam Market Volume (K Tons), by Country 2025 & 2033
- Figure 17: Asia Pacific Ceramic Foam Market Revenue Share (%), by Country 2025 & 2033
- Figure 18: Asia Pacific Ceramic Foam Market Volume Share (%), by Country 2025 & 2033
- Figure 19: North America Ceramic Foam Market Revenue (million), by Type 2025 & 2033
- Figure 20: North America Ceramic Foam Market Volume (K Tons), by Type 2025 & 2033
- Figure 21: North America Ceramic Foam Market Revenue Share (%), by Type 2025 & 2033
- Figure 22: North America Ceramic Foam Market Volume Share (%), by Type 2025 & 2033
- Figure 23: North America Ceramic Foam Market Revenue (million), by Application 2025 & 2033
- Figure 24: North America Ceramic Foam Market Volume (K Tons), by Application 2025 & 2033
- Figure 25: North America Ceramic Foam Market Revenue Share (%), by Application 2025 & 2033
- Figure 26: North America Ceramic Foam Market Volume Share (%), by Application 2025 & 2033
- Figure 27: North America Ceramic Foam Market Revenue (million), by End-user Industry 2025 & 2033
- Figure 28: North America Ceramic Foam Market Volume (K Tons), by End-user Industry 2025 & 2033
- Figure 29: North America Ceramic Foam Market Revenue Share (%), by End-user Industry 2025 & 2033
- Figure 30: North America Ceramic Foam Market Volume Share (%), by End-user Industry 2025 & 2033
- Figure 31: North America Ceramic Foam Market Revenue (million), by Country 2025 & 2033
- Figure 32: North America Ceramic Foam Market Volume (K Tons), by Country 2025 & 2033
- Figure 33: North America Ceramic Foam Market Revenue Share (%), by Country 2025 & 2033
- Figure 34: North America Ceramic Foam Market Volume Share (%), by Country 2025 & 2033
- Figure 35: Europe Ceramic Foam Market Revenue (million), by Type 2025 & 2033
- Figure 36: Europe Ceramic Foam Market Volume (K Tons), by Type 2025 & 2033
- Figure 37: Europe Ceramic Foam Market Revenue Share (%), by Type 2025 & 2033
- Figure 38: Europe Ceramic Foam Market Volume Share (%), by Type 2025 & 2033
- Figure 39: Europe Ceramic Foam Market Revenue (million), by Application 2025 & 2033
- Figure 40: Europe Ceramic Foam Market Volume (K Tons), by Application 2025 & 2033
- Figure 41: Europe Ceramic Foam Market Revenue Share (%), by Application 2025 & 2033
- Figure 42: Europe Ceramic Foam Market Volume Share (%), by Application 2025 & 2033
- Figure 43: Europe Ceramic Foam Market Revenue (million), by End-user Industry 2025 & 2033
- Figure 44: Europe Ceramic Foam Market Volume (K Tons), by End-user Industry 2025 & 2033
- Figure 45: Europe Ceramic Foam Market Revenue Share (%), by End-user Industry 2025 & 2033
- Figure 46: Europe Ceramic Foam Market Volume Share (%), by End-user Industry 2025 & 2033
- Figure 47: Europe Ceramic Foam Market Revenue (million), by Country 2025 & 2033
- Figure 48: Europe Ceramic Foam Market Volume (K Tons), by Country 2025 & 2033
- Figure 49: Europe Ceramic Foam Market Revenue Share (%), by Country 2025 & 2033
- Figure 50: Europe Ceramic Foam Market Volume Share (%), by Country 2025 & 2033
- Figure 51: South America Ceramic Foam Market Revenue (million), by Type 2025 & 2033
- Figure 52: South America Ceramic Foam Market Volume (K Tons), by Type 2025 & 2033
- Figure 53: South America Ceramic Foam Market Revenue Share (%), by Type 2025 & 2033
- Figure 54: South America Ceramic Foam Market Volume Share (%), by Type 2025 & 2033
- Figure 55: South America Ceramic Foam Market Revenue (million), by Application 2025 & 2033
- Figure 56: South America Ceramic Foam Market Volume (K Tons), by Application 2025 & 2033
- Figure 57: South America Ceramic Foam Market Revenue Share (%), by Application 2025 & 2033
- Figure 58: South America Ceramic Foam Market Volume Share (%), by Application 2025 & 2033
- Figure 59: South America Ceramic Foam Market Revenue (million), by End-user Industry 2025 & 2033
- Figure 60: South America Ceramic Foam Market Volume (K Tons), by End-user Industry 2025 & 2033
- Figure 61: South America Ceramic Foam Market Revenue Share (%), by End-user Industry 2025 & 2033
- Figure 62: South America Ceramic Foam Market Volume Share (%), by End-user Industry 2025 & 2033
- Figure 63: South America Ceramic Foam Market Revenue (million), by Country 2025 & 2033
- Figure 64: South America Ceramic Foam Market Volume (K Tons), by Country 2025 & 2033
- Figure 65: South America Ceramic Foam Market Revenue Share (%), by Country 2025 & 2033
- Figure 66: South America Ceramic Foam Market Volume Share (%), by Country 2025 & 2033
- Figure 67: Middle East and Africa Ceramic Foam Market Revenue (million), by Type 2025 & 2033
- Figure 68: Middle East and Africa Ceramic Foam Market Volume (K Tons), by Type 2025 & 2033
- Figure 69: Middle East and Africa Ceramic Foam Market Revenue Share (%), by Type 2025 & 2033
- Figure 70: Middle East and Africa Ceramic Foam Market Volume Share (%), by Type 2025 & 2033
- Figure 71: Middle East and Africa Ceramic Foam Market Revenue (million), by Application 2025 & 2033
- Figure 72: Middle East and Africa Ceramic Foam Market Volume (K Tons), by Application 2025 & 2033
- Figure 73: Middle East and Africa Ceramic Foam Market Revenue Share (%), by Application 2025 & 2033
- Figure 74: Middle East and Africa Ceramic Foam Market Volume Share (%), by Application 2025 & 2033
- Figure 75: Middle East and Africa Ceramic Foam Market Revenue (million), by End-user Industry 2025 & 2033
- Figure 76: Middle East and Africa Ceramic Foam Market Volume (K Tons), by End-user Industry 2025 & 2033
- Figure 77: Middle East and Africa Ceramic Foam Market Revenue Share (%), by End-user Industry 2025 & 2033
- Figure 78: Middle East and Africa Ceramic Foam Market Volume Share (%), by End-user Industry 2025 & 2033
- Figure 79: Middle East and Africa Ceramic Foam Market Revenue (million), by Country 2025 & 2033
- Figure 80: Middle East and Africa Ceramic Foam Market Volume (K Tons), by Country 2025 & 2033
- Figure 81: Middle East and Africa Ceramic Foam Market Revenue Share (%), by Country 2025 & 2033
- Figure 82: Middle East and Africa Ceramic Foam Market Volume Share (%), by Country 2025 & 2033
List of Tables
- Table 1: Global Ceramic Foam Market Revenue million Forecast, by Type 2020 & 2033
- Table 2: Global Ceramic Foam Market Volume K Tons Forecast, by Type 2020 & 2033
- Table 3: Global Ceramic Foam Market Revenue million Forecast, by Application 2020 & 2033
- Table 4: Global Ceramic Foam Market Volume K Tons Forecast, by Application 2020 & 2033
- Table 5: Global Ceramic Foam Market Revenue million Forecast, by End-user Industry 2020 & 2033
- Table 6: Global Ceramic Foam Market Volume K Tons Forecast, by End-user Industry 2020 & 2033
- Table 7: Global Ceramic Foam Market Revenue million Forecast, by Region 2020 & 2033
- Table 8: Global Ceramic Foam Market Volume K Tons Forecast, by Region 2020 & 2033
- Table 9: Global Ceramic Foam Market Revenue million Forecast, by Type 2020 & 2033
- Table 10: Global Ceramic Foam Market Volume K Tons Forecast, by Type 2020 & 2033
- Table 11: Global Ceramic Foam Market Revenue million Forecast, by Application 2020 & 2033
- Table 12: Global Ceramic Foam Market Volume K Tons Forecast, by Application 2020 & 2033
- Table 13: Global Ceramic Foam Market Revenue million Forecast, by End-user Industry 2020 & 2033
- Table 14: Global Ceramic Foam Market Volume K Tons Forecast, by End-user Industry 2020 & 2033
- Table 15: Global Ceramic Foam Market Revenue million Forecast, by Country 2020 & 2033
- Table 16: Global Ceramic Foam Market Volume K Tons Forecast, by Country 2020 & 2033
- Table 17: China Ceramic Foam Market Revenue (million) Forecast, by Application 2020 & 2033
- Table 18: China Ceramic Foam Market Volume (K Tons) Forecast, by Application 2020 & 2033
- Table 19: India Ceramic Foam Market Revenue (million) Forecast, by Application 2020 & 2033
- Table 20: India Ceramic Foam Market Volume (K Tons) Forecast, by Application 2020 & 2033
- Table 21: Japan Ceramic Foam Market Revenue (million) Forecast, by Application 2020 & 2033
- Table 22: Japan Ceramic Foam Market Volume (K Tons) Forecast, by Application 2020 & 2033
- Table 23: South Korea Ceramic Foam Market Revenue (million) Forecast, by Application 2020 & 2033
- Table 24: South Korea Ceramic Foam Market Volume (K Tons) Forecast, by Application 2020 & 2033
- Table 25: Rest of Asia Pacific Ceramic Foam Market Revenue (million) Forecast, by Application 2020 & 2033
- Table 26: Rest of Asia Pacific Ceramic Foam Market Volume (K Tons) Forecast, by Application 2020 & 2033
- Table 27: Global Ceramic Foam Market Revenue million Forecast, by Type 2020 & 2033
- Table 28: Global Ceramic Foam Market Volume K Tons Forecast, by Type 2020 & 2033
- Table 29: Global Ceramic Foam Market Revenue million Forecast, by Application 2020 & 2033
- Table 30: Global Ceramic Foam Market Volume K Tons Forecast, by Application 2020 & 2033
- Table 31: Global Ceramic Foam Market Revenue million Forecast, by End-user Industry 2020 & 2033
- Table 32: Global Ceramic Foam Market Volume K Tons Forecast, by End-user Industry 2020 & 2033
- Table 33: Global Ceramic Foam Market Revenue million Forecast, by Country 2020 & 2033
- Table 34: Global Ceramic Foam Market Volume K Tons Forecast, by Country 2020 & 2033
- Table 35: United States Ceramic Foam Market Revenue (million) Forecast, by Application 2020 & 2033
- Table 36: United States Ceramic Foam Market Volume (K Tons) Forecast, by Application 2020 & 2033
- Table 37: Canada Ceramic Foam Market Revenue (million) Forecast, by Application 2020 & 2033
- Table 38: Canada Ceramic Foam Market Volume (K Tons) Forecast, by Application 2020 & 2033
- Table 39: Mexico Ceramic Foam Market Revenue (million) Forecast, by Application 2020 & 2033
- Table 40: Mexico Ceramic Foam Market Volume (K Tons) Forecast, by Application 2020 & 2033
- Table 41: Global Ceramic Foam Market Revenue million Forecast, by Type 2020 & 2033
- Table 42: Global Ceramic Foam Market Volume K Tons Forecast, by Type 2020 & 2033
- Table 43: Global Ceramic Foam Market Revenue million Forecast, by Application 2020 & 2033
- Table 44: Global Ceramic Foam Market Volume K Tons Forecast, by Application 2020 & 2033
- Table 45: Global Ceramic Foam Market Revenue million Forecast, by End-user Industry 2020 & 2033
- Table 46: Global Ceramic Foam Market Volume K Tons Forecast, by End-user Industry 2020 & 2033
- Table 47: Global Ceramic Foam Market Revenue million Forecast, by Country 2020 & 2033
- Table 48: Global Ceramic Foam Market Volume K Tons Forecast, by Country 2020 & 2033
- Table 49: Germany Ceramic Foam Market Revenue (million) Forecast, by Application 2020 & 2033
- Table 50: Germany Ceramic Foam Market Volume (K Tons) Forecast, by Application 2020 & 2033
- Table 51: United Kingdom Ceramic Foam Market Revenue (million) Forecast, by Application 2020 & 2033
- Table 52: United Kingdom Ceramic Foam Market Volume (K Tons) Forecast, by Application 2020 & 2033
- Table 53: Italy Ceramic Foam Market Revenue (million) Forecast, by Application 2020 & 2033
- Table 54: Italy Ceramic Foam Market Volume (K Tons) Forecast, by Application 2020 & 2033
- Table 55: France Ceramic Foam Market Revenue (million) Forecast, by Application 2020 & 2033
- Table 56: France Ceramic Foam Market Volume (K Tons) Forecast, by Application 2020 & 2033
- Table 57: Rest of Europe Ceramic Foam Market Revenue (million) Forecast, by Application 2020 & 2033
- Table 58: Rest of Europe Ceramic Foam Market Volume (K Tons) Forecast, by Application 2020 & 2033
- Table 59: Global Ceramic Foam Market Revenue million Forecast, by Type 2020 & 2033
- Table 60: Global Ceramic Foam Market Volume K Tons Forecast, by Type 2020 & 2033
- Table 61: Global Ceramic Foam Market Revenue million Forecast, by Application 2020 & 2033
- Table 62: Global Ceramic Foam Market Volume K Tons Forecast, by Application 2020 & 2033
- Table 63: Global Ceramic Foam Market Revenue million Forecast, by End-user Industry 2020 & 2033
- Table 64: Global Ceramic Foam Market Volume K Tons Forecast, by End-user Industry 2020 & 2033
- Table 65: Global Ceramic Foam Market Revenue million Forecast, by Country 2020 & 2033
- Table 66: Global Ceramic Foam Market Volume K Tons Forecast, by Country 2020 & 2033
- Table 67: Brazil Ceramic Foam Market Revenue (million) Forecast, by Application 2020 & 2033
- Table 68: Brazil Ceramic Foam Market Volume (K Tons) Forecast, by Application 2020 & 2033
- Table 69: Argentina Ceramic Foam Market Revenue (million) Forecast, by Application 2020 & 2033
- Table 70: Argentina Ceramic Foam Market Volume (K Tons) Forecast, by Application 2020 & 2033
- Table 71: Rest of South America Ceramic Foam Market Revenue (million) Forecast, by Application 2020 & 2033
- Table 72: Rest of South America Ceramic Foam Market Volume (K Tons) Forecast, by Application 2020 & 2033
- Table 73: Global Ceramic Foam Market Revenue million Forecast, by Type 2020 & 2033
- Table 74: Global Ceramic Foam Market Volume K Tons Forecast, by Type 2020 & 2033
- Table 75: Global Ceramic Foam Market Revenue million Forecast, by Application 2020 & 2033
- Table 76: Global Ceramic Foam Market Volume K Tons Forecast, by Application 2020 & 2033
- Table 77: Global Ceramic Foam Market Revenue million Forecast, by End-user Industry 2020 & 2033
- Table 78: Global Ceramic Foam Market Volume K Tons Forecast, by End-user Industry 2020 & 2033
- Table 79: Global Ceramic Foam Market Revenue million Forecast, by Country 2020 & 2033
- Table 80: Global Ceramic Foam Market Volume K Tons Forecast, by Country 2020 & 2033
- Table 81: Saudi Arabia Ceramic Foam Market Revenue (million) Forecast, by Application 2020 & 2033
- Table 82: Saudi Arabia Ceramic Foam Market Volume (K Tons) Forecast, by Application 2020 & 2033
- Table 83: South Africa Ceramic Foam Market Revenue (million) Forecast, by Application 2020 & 2033
- Table 84: South Africa Ceramic Foam Market Volume (K Tons) Forecast, by Application 2020 & 2033
- Table 85: Rest of Middle East and Africa Ceramic Foam Market Revenue (million) Forecast, by Application 2020 & 2033
- Table 86: Rest of Middle East and Africa Ceramic Foam Market Volume (K Tons) Forecast, by Application 2020 & 2033
Frequently Asked Questions
1. What is the projected Compound Annual Growth Rate (CAGR) of the Ceramic Foam Market?
The projected CAGR is approximately 3%.
2. Which companies are prominent players in the Ceramic Foam Market?
Key companies in the market include Saint-Gobain, Vesuvius, Altech Alloys India Pvt Ltd, LANIK s r o, Jiangxi Jintai Special Material LLC, Ultramet, ERG Aerospace Corp, SELEE Corporation, Induceramic, Drache GmbH, FERRO-TERM LTD, Pyrotek.
3. What are the main segments of the Ceramic Foam Market?
The market segments include Type, Application, End-user Industry.
4. Can you provide details about the market size?
The market size is estimated to be USD 311 million as of 2022.
5. What are some drivers contributing to market growth?
; Increase in Usage of Ceramic Foams in Pollution Control; Other Drivers.
6. What are the notable trends driving market growth?
Increasing Usage in the Automotive Industry.
7. Are there any restraints impacting market growth?
; High Cost of Production of Ceramic Foams; Impact of COVID-19 Pandemic.
8. Can you provide examples of recent developments in the market?
N/A
9. What pricing options are available for accessing the report?
Pricing options include single-user, multi-user, and enterprise licenses priced at USD 4750, USD 5250, and USD 8750 respectively.
10. Is the market size provided in terms of value or volume?
The market size is provided in terms of value, measured in million and volume, measured in K Tons.
11. Are there any specific market keywords associated with the report?
Yes, the market keyword associated with the report is "Ceramic Foam Market," which aids in identifying and referencing the specific market segment covered.
12. How do I determine which pricing option suits my needs best?
The pricing options vary based on user requirements and access needs. Individual users may opt for single-user licenses, while businesses requiring broader access may choose multi-user or enterprise licenses for cost-effective access to the report.
13. Are there any additional resources or data provided in the Ceramic Foam Market report?
While the report offers comprehensive insights, it's advisable to review the specific contents or supplementary materials provided to ascertain if additional resources or data are available.
14. How can I stay updated on further developments or reports in the Ceramic Foam Market?
To stay informed about further developments, trends, and reports in the Ceramic Foam Market, consider subscribing to industry newsletters, following relevant companies and organizations, or regularly checking reputable industry news sources and publications.
Methodology
Step 1 - Identification of Relevant Samples Size from Population Database


Step 2 - Approaches for Defining Global Market Size (Value, Volume* & Price*)

Note*: In applicable scenarios
Step 3 - Data Sources
Primary Research
- Web Analytics
- Survey Reports
- Research Institute
- Latest Research Reports
- Opinion Leaders
Secondary Research
- Annual Reports
- White Paper
- Latest Press Release
- Industry Association
- Paid Database
- Investor Presentations

Step 4 - Data Triangulation
Involves using different sources of information in order to increase the validity of a study
These sources are likely to be stakeholders in a program - participants, other researchers, program staff, other community members, and so on.
Then we put all data in single framework & apply various statistical tools to find out the dynamic on the market.
During the analysis stage, feedback from the stakeholder groups would be compared to determine areas of agreement as well as areas of divergence