

Key Insights
The global ceramic tableware market is poised for significant expansion, driven by rising disposable incomes and a growing consumer demand for aesthetically superior and durable dining ware. The increasing popularity of casual dining, home entertaining, and a preference for sustainable, eco-friendly products are key market catalysts. Consumers are actively seeking high-quality, visually appealing ceramic tableware to elevate their dining experiences, fostering demand for premium offerings and innovative designs. Emerging trends include personalized tableware, integration of smart technologies, and a heightened interest in artisanal craftsmanship. Despite challenges such as raw material price volatility and competition from alternative materials, the market's inherent durability, versatility, and aesthetic appeal ensure a positive outlook. We forecast substantial market growth, with a projected Compound Annual Growth Rate (CAGR) of 6.2%. The global market size is estimated at 19079.91 million in the base year, 2025. Key industry leaders like Villeroy & Boch, Rosenthal GmbH, and Meissen are driving innovation and expanding product lines to meet evolving consumer preferences, further contributing to market advancement. Market segmentation by product type, material, price point, and distribution channel offers distinct opportunities for targeted strategies and market penetration.
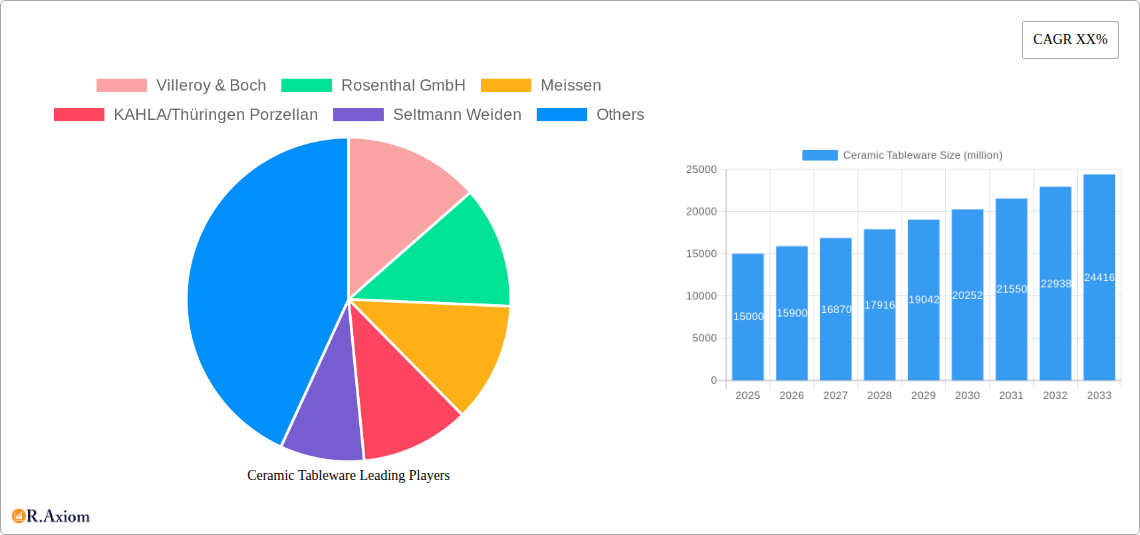
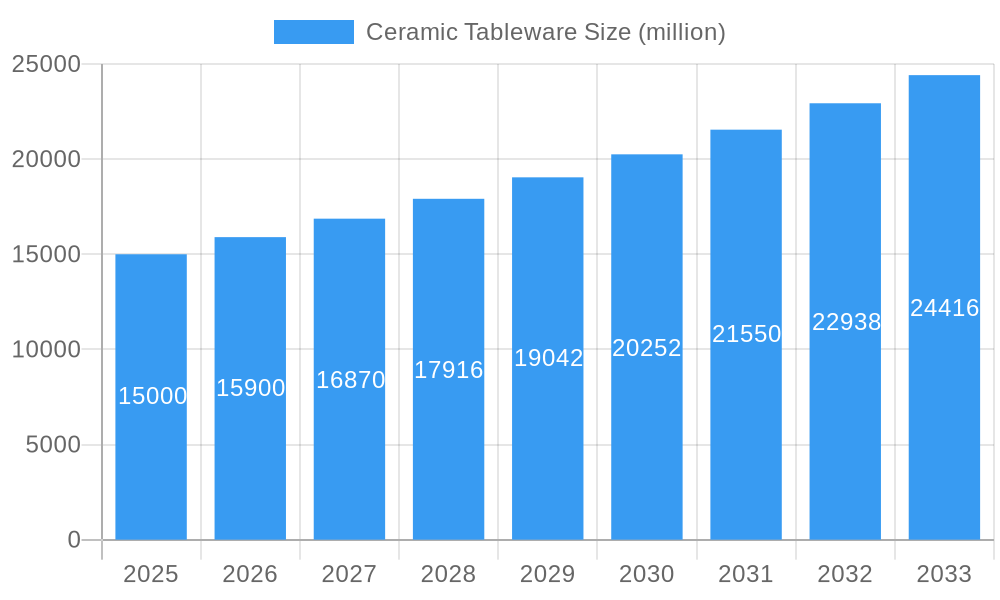
Ceramic Tableware Market Size (In Billion)
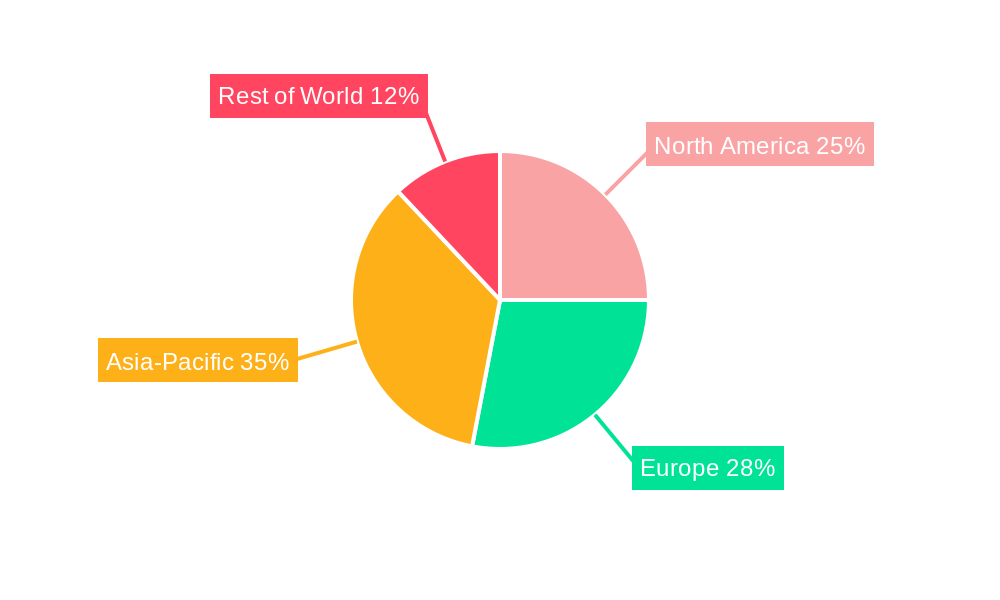
The Asia-Pacific region is expected to witness the most dynamic growth, spearheaded by China and India, fueled by a growing middle class, urbanization, and a shift towards Westernized lifestyles. While Europe and North America will remain key markets, their growth trajectories are projected to be more measured. Intense competition persists, with established players prioritizing product differentiation and innovation. New entrants, particularly from developing economies, are leveraging cost-effective production to challenge incumbents. Success in this market hinges on emphasizing sustainability, adopting advanced technologies, and delivering functional, aesthetically pleasing designs that resonate with diverse consumer demographics and cultural backgrounds. Strategic utilization of e-commerce for direct-to-consumer sales and robust partnerships within the hospitality sector are critical for sustained market leadership and expansion throughout the forecast period.
Ceramic Tableware Company Market Share
Ceramic Tableware Market: A Comprehensive Report (2019-2033)
This detailed report provides a comprehensive analysis of the global ceramic tableware market, encompassing historical data (2019-2024), current estimations (2025), and future projections (2025-2033). The study covers market size, segmentation, key players, industry trends, and growth opportunities, offering valuable insights for industry stakeholders, investors, and businesses operating within this dynamic sector. The total market value is estimated to reach xx million by 2033, exhibiting a CAGR of xx% during the forecast period.
Ceramic Tableware Market Concentration & Innovation
This section analyzes the competitive landscape of the ceramic tableware market, focusing on market concentration, innovation drivers, regulatory frameworks, product substitutes, end-user trends, and mergers and acquisitions (M&A) activities.
The market exhibits a moderately concentrated structure, with several major players holding significant market shares. For example, Villeroy & Boch and Rosenthal GmbH collectively hold an estimated xx% market share in the premium segment (2025). Smaller players focus on niche segments or regional markets. Innovation is driven by consumer demand for aesthetically pleasing designs, sustainable materials, and enhanced functionality. Stricter regulatory frameworks regarding material safety and environmental standards are influencing production processes. The primary substitute is plastic tableware, though its market share remains limited due to environmental concerns and lower perceived quality. End-user trends point toward increasing demand for versatile and durable tableware suitable for various occasions.
M&A activity in the ceramic tableware industry has been moderate in recent years. Significant deals include the acquisition of xx company by xx company in 2022, valued at approximately xx million. These activities are primarily aimed at expanding product portfolios, enhancing geographic reach, and gaining access to new technologies.
- Market Concentration: Moderately concentrated, with top players holding xx% market share (2025 estimate).
- Innovation Drivers: Consumer demand for aesthetics, sustainability, functionality.
- Regulatory Frameworks: Focus on material safety, environmental compliance.
- Product Substitutes: Primarily plastic tableware, with limited market penetration.
- End-user Trends: Growing demand for versatile and durable tableware.
- M&A Activity: Moderate activity, focused on portfolio expansion and geographic reach. Example: xx million acquisition in 2022.
Ceramic Tableware Industry Trends & Insights
This section delves into the key trends and insights shaping the ceramic tableware market. The market is experiencing steady growth driven by increasing disposable incomes, changing lifestyles, and a preference for home-cooked meals. Technological advancements, such as 3D printing, are enabling more intricate designs and customization options. Consumer preferences are shifting towards sustainable, ethically sourced products and eco-friendly packaging. The competitive landscape is characterized by intense competition based on product differentiation, branding, and price. The CAGR for the global ceramic tableware market is estimated at xx% for the forecast period (2025-2033), with significant market penetration expected in developing economies. Market penetration in specific regions is projected to increase by xx% during the same period, driven by rising disposable incomes and urbanization.
Dominant Markets & Segments in Ceramic Tableware
The report identifies key regions, countries, and segments dominating the ceramic tableware market. The Asia-Pacific region is currently the leading market due to high population density, rapid urbanization, and robust economic growth. Within this region, China and India represent significant growth opportunities. The premium segment commands a higher average selling price, while the mid-range segment accounts for the largest volume.
Key Drivers of Regional Dominance (Asia-Pacific):
- High population growth and urbanization.
- Rising disposable incomes and changing consumer preferences.
- Strong economic growth and expanding middle class.
- Government initiatives promoting domestic manufacturing.
- Development of robust retail infrastructure.
Dominant Segments: Premium and Mid-range segments show the highest growth.
Ceramic Tableware Product Developments
Recent product innovations focus on improving durability, enhancing aesthetics, and incorporating sustainable materials. The use of advanced ceramic materials and manufacturing processes is improving product quality and reducing production costs. Innovations like microwave-safe and dishwasher-safe tableware are gaining popularity. These advancements meet consumer demand for convenience and functionality, creating a stronger competitive edge for manufacturers.
Report Scope & Segmentation Analysis
The report segments the ceramic tableware market by material (porcelain, earthenware, stoneware), product type (dinnerware, teaware, cookware), distribution channel (online, offline), price range (premium, mid-range, economy), and region (North America, Europe, Asia-Pacific, Rest of the World). Each segment is analyzed in terms of market size, growth projections, and competitive dynamics. For instance, the porcelain segment is expected to maintain significant growth due to its durability and aesthetic appeal. The online distribution channel is growing rapidly, while the premium segment shows higher profit margins.
Key Drivers of Ceramic Tableware Growth
Several factors are driving the growth of the ceramic tableware market. These include rising disposable incomes, increasing urbanization, and changing consumer preferences towards healthy and convenient lifestyles, resulting in a higher demand for tableware. Technological advancements in materials science and manufacturing processes are improving product quality, durability, and aesthetics, enhancing market appeal. Furthermore, government initiatives in certain regions supporting local manufacturing are boosting domestic production.
Challenges in the Ceramic Tableware Sector
Challenges facing the ceramic tableware sector include fluctuating raw material prices, increasing labor costs, and intense competition from low-cost manufacturers. Supply chain disruptions and logistical issues can also impact production and delivery timelines. Stringent environmental regulations add to the operational costs. These challenges can negatively impact profitability and market share if not effectively addressed.
Emerging Opportunities in Ceramic Tableware
Emerging opportunities lie in developing eco-friendly and sustainable products, capitalizing on the growing environmental awareness among consumers. Personalized and customized tableware are also gaining traction. Expansion into emerging markets and tapping into new distribution channels, such as e-commerce, present substantial growth potential. The adoption of innovative manufacturing technologies can enhance efficiency and reduce production costs.
Leading Players in the Ceramic Tableware Market
- Villeroy & Boch
- Rosenthal GmbH
- Meissen
- KAHLA/Thüringen Porzellan
- Seltmann Weiden
- WMF
- BHS (Schönwald, Bauscher and Tafelstern)
- Fiskars Group
- Portmeirion Group
- Steelite International
- Churchill China
- Denby Pottery Company
- Royal Crown Derby
- Bernardaud
- Degrenne
- Arc Holdings
- Saturnia
- Tognana Porcellane S.p.A
- Richard Ginori
- Vista Alegre
- Apulum
- Cesiro
- Lubiana
- Imperial Porcelain Manufactory
- Güral Porselen
- Kütahya Porselen
- Porland Porselen
- Bonna Premium Porcelain
- Libbey
- Fiesta Tableware Company
- Lifetime Brands
- Lenox (Oneida)
- Morimura (Noritake, Okura Art China)
- Narumi
- NIKKO CERAMICS
- KINTO
- Koransha
- Hankook Chinaware
- ZENHankook
- Ariane Fine Porcelain
- Ceramic Tableware Pvt. Limited (CTPL)
- Clay Craft India
- PT. Lucky Indah Keramik
- TCL Ceramics
- Bharat Potteries
- RAK Porcelain
- Songfa Ceramics
- Hualian China
- Sitong Group
- The Great Wall
- Guangxi Sanhuan
- PT Indo Porcelain
- PT. Sango Ceramics Indonesia
- Trisensa Ceramics Indonesia
- PT Haeng Nam Sejahtera (HSI)
- Royal Porcelain Public Company Limited
- Meriss Ceramics Industrial Group
- Dankotuwa Porcelain
- Claytan Group
Key Developments in Ceramic Tableware Industry
- 2022, Q4: Launch of a new sustainable porcelain line by Villeroy & Boch.
- 2023, Q1: Rosenthal GmbH partnered with a leading designer to release a limited-edition collection.
- 2023, Q2: Acquisition of xx company by xx company. (details unavailable)
Strategic Outlook for Ceramic Tableware Market
The ceramic tableware market is poised for continued growth, driven by innovation, changing consumer preferences, and expansion into new markets. Strategic focus on sustainability, customization, and enhancing the online presence will be crucial for manufacturers to maintain competitiveness and capitalize on emerging opportunities. The market's future potential is substantial, with significant growth anticipated in developing economies and expanding e-commerce channels.
Ceramic Tableware Segmentation
-
1. Application
- 1.1. Horeca/Hospitality
- 1.2. Household
-
2. Types
- 2.1. Porcelain Tableware
- 2.2. Bone China Tableware
- 2.3. Stoneware (Ceramic)
- 2.4. Other Tableware
Ceramic Tableware Segmentation By Geography
-
1. North America
- 1.1. United States
- 1.2. Canada
- 1.3. Mexico
-
2. South America
- 2.1. Brazil
- 2.2. Argentina
- 2.3. Rest of South America
-
3. Europe
- 3.1. United Kingdom
- 3.2. Germany
- 3.3. France
- 3.4. Italy
- 3.5. Spain
- 3.6. Russia
- 3.7. Benelux
- 3.8. Nordics
- 3.9. Rest of Europe
-
4. Middle East & Africa
- 4.1. Turkey
- 4.2. Israel
- 4.3. GCC
- 4.4. North Africa
- 4.5. South Africa
- 4.6. Rest of Middle East & Africa
-
5. Asia Pacific
- 5.1. China
- 5.2. India
- 5.3. Japan
- 5.4. South Korea
- 5.5. ASEAN
- 5.6. Oceania
- 5.7. Rest of Asia Pacific
Ceramic Tableware Regional Market Share
Geographic Coverage of Ceramic Tableware
Ceramic Tableware REPORT HIGHLIGHTS
| Aspects | Details |
|---|---|
| Study Period | 2020-2034 |
| Base Year | 2025 |
| Estimated Year | 2026 |
| Forecast Period | 2026-2034 |
| Historical Period | 2020-2025 |
| Growth Rate | CAGR of 6.2% from 2020-2034 |
| Segmentation |
|
Table of Contents
- 1. Introduction
- 1.1. Research Scope
- 1.2. Market Segmentation
- 1.3. Research Objective
- 1.4. Definitions and Assumptions
- 2. Executive Summary
- 2.1. Market Snapshot
- 3. Market Dynamics
- 3.1. Market Drivers
- 3.2. Market Restrains
- 3.3. Market Trends
- 3.4. Market Opportunities
- 4. Market Factor Analysis
- 4.1. Porters Five Forces
- 4.1.1. Bargaining Power of Suppliers
- 4.1.2. Bargaining Power of Buyers
- 4.1.3. Threat of New Entrants
- 4.1.4. Threat of Substitutes
- 4.1.5. Competitive Rivalry
- 4.2. PESTEL analysis
- 4.3. BCG Analysis
- 4.3.1. Stars (High Growth, High Market Share)
- 4.3.2. Cash Cows (Low Growth, High Market Share)
- 4.3.3. Question Mark (High Growth, Low Market Share)
- 4.3.4. Dogs (Low Growth, Low Market Share)
- 4.4. Ansoff Matrix Analysis
- 4.5. Supply Chain Analysis
- 4.6. Regulatory Landscape
- 4.7. Current Market Potential and Opportunity Assessment (TAM–SAM–SOM Framework)
- 4.8. RAX Analyst Note
- 4.1. Porters Five Forces
- 5. Market Analysis, Insights and Forecast 2021-2033
- 5.1. Market Analysis, Insights and Forecast - by Application
- 5.1.1. Horeca/Hospitality
- 5.1.2. Household
- 5.2. Market Analysis, Insights and Forecast - by Types
- 5.2.1. Porcelain Tableware
- 5.2.2. Bone China Tableware
- 5.2.3. Stoneware (Ceramic)
- 5.2.4. Other Tableware
- 5.3. Market Analysis, Insights and Forecast - by Region
- 5.3.1. North America
- 5.3.2. South America
- 5.3.3. Europe
- 5.3.4. Middle East & Africa
- 5.3.5. Asia Pacific
- 5.1. Market Analysis, Insights and Forecast - by Application
- 6. Global Ceramic Tableware Analysis, Insights and Forecast, 2021-2033
- 6.1. Market Analysis, Insights and Forecast - by Application
- 6.1.1. Horeca/Hospitality
- 6.1.2. Household
- 6.2. Market Analysis, Insights and Forecast - by Types
- 6.2.1. Porcelain Tableware
- 6.2.2. Bone China Tableware
- 6.2.3. Stoneware (Ceramic)
- 6.2.4. Other Tableware
- 6.1. Market Analysis, Insights and Forecast - by Application
- 7. North America Ceramic Tableware Analysis, Insights and Forecast, 2020-2032
- 7.1. Market Analysis, Insights and Forecast - by Application
- 7.1.1. Horeca/Hospitality
- 7.1.2. Household
- 7.2. Market Analysis, Insights and Forecast - by Types
- 7.2.1. Porcelain Tableware
- 7.2.2. Bone China Tableware
- 7.2.3. Stoneware (Ceramic)
- 7.2.4. Other Tableware
- 7.1. Market Analysis, Insights and Forecast - by Application
- 8. South America Ceramic Tableware Analysis, Insights and Forecast, 2020-2032
- 8.1. Market Analysis, Insights and Forecast - by Application
- 8.1.1. Horeca/Hospitality
- 8.1.2. Household
- 8.2. Market Analysis, Insights and Forecast - by Types
- 8.2.1. Porcelain Tableware
- 8.2.2. Bone China Tableware
- 8.2.3. Stoneware (Ceramic)
- 8.2.4. Other Tableware
- 8.1. Market Analysis, Insights and Forecast - by Application
- 9. Europe Ceramic Tableware Analysis, Insights and Forecast, 2020-2032
- 9.1. Market Analysis, Insights and Forecast - by Application
- 9.1.1. Horeca/Hospitality
- 9.1.2. Household
- 9.2. Market Analysis, Insights and Forecast - by Types
- 9.2.1. Porcelain Tableware
- 9.2.2. Bone China Tableware
- 9.2.3. Stoneware (Ceramic)
- 9.2.4. Other Tableware
- 9.1. Market Analysis, Insights and Forecast - by Application
- 10. Middle East & Africa Ceramic Tableware Analysis, Insights and Forecast, 2020-2032
- 10.1. Market Analysis, Insights and Forecast - by Application
- 10.1.1. Horeca/Hospitality
- 10.1.2. Household
- 10.2. Market Analysis, Insights and Forecast - by Types
- 10.2.1. Porcelain Tableware
- 10.2.2. Bone China Tableware
- 10.2.3. Stoneware (Ceramic)
- 10.2.4. Other Tableware
- 10.1. Market Analysis, Insights and Forecast - by Application
- 11. Asia Pacific Ceramic Tableware Analysis, Insights and Forecast, 2020-2032
- 11.1. Market Analysis, Insights and Forecast - by Application
- 11.1.1. Horeca/Hospitality
- 11.1.2. Household
- 11.2. Market Analysis, Insights and Forecast - by Types
- 11.2.1. Porcelain Tableware
- 11.2.2. Bone China Tableware
- 11.2.3. Stoneware (Ceramic)
- 11.2.4. Other Tableware
- 11.1. Market Analysis, Insights and Forecast - by Application
- 12. Competitive Analysis
- 12.1. Company Profiles
- 12.1.1 Villeroy & Boch
- 12.1.1.1. Company Overview
- 12.1.1.2. Products
- 12.1.1.3. Company Financials
- 12.1.1.4. SWOT Analysis
- 12.1.2 Rosenthal GmbH
- 12.1.2.1. Company Overview
- 12.1.2.2. Products
- 12.1.2.3. Company Financials
- 12.1.2.4. SWOT Analysis
- 12.1.3 Meissen
- 12.1.3.1. Company Overview
- 12.1.3.2. Products
- 12.1.3.3. Company Financials
- 12.1.3.4. SWOT Analysis
- 12.1.4 KAHLA/Thüringen Porzellan
- 12.1.4.1. Company Overview
- 12.1.4.2. Products
- 12.1.4.3. Company Financials
- 12.1.4.4. SWOT Analysis
- 12.1.5 Seltmann Weiden
- 12.1.5.1. Company Overview
- 12.1.5.2. Products
- 12.1.5.3. Company Financials
- 12.1.5.4. SWOT Analysis
- 12.1.6 WMF
- 12.1.6.1. Company Overview
- 12.1.6.2. Products
- 12.1.6.3. Company Financials
- 12.1.6.4. SWOT Analysis
- 12.1.7 BHS (Schönwald
- 12.1.7.1. Company Overview
- 12.1.7.2. Products
- 12.1.7.3. Company Financials
- 12.1.7.4. SWOT Analysis
- 12.1.8 Bauscher and Tafelstern)
- 12.1.8.1. Company Overview
- 12.1.8.2. Products
- 12.1.8.3. Company Financials
- 12.1.8.4. SWOT Analysis
- 12.1.9 Fiskars Group
- 12.1.9.1. Company Overview
- 12.1.9.2. Products
- 12.1.9.3. Company Financials
- 12.1.9.4. SWOT Analysis
- 12.1.10 Portmeirion Group
- 12.1.10.1. Company Overview
- 12.1.10.2. Products
- 12.1.10.3. Company Financials
- 12.1.10.4. SWOT Analysis
- 12.1.11 Steelite International
- 12.1.11.1. Company Overview
- 12.1.11.2. Products
- 12.1.11.3. Company Financials
- 12.1.11.4. SWOT Analysis
- 12.1.12 Churchill China
- 12.1.12.1. Company Overview
- 12.1.12.2. Products
- 12.1.12.3. Company Financials
- 12.1.12.4. SWOT Analysis
- 12.1.13 Denby Pottery Company
- 12.1.13.1. Company Overview
- 12.1.13.2. Products
- 12.1.13.3. Company Financials
- 12.1.13.4. SWOT Analysis
- 12.1.14 Royal Crown Derby
- 12.1.14.1. Company Overview
- 12.1.14.2. Products
- 12.1.14.3. Company Financials
- 12.1.14.4. SWOT Analysis
- 12.1.15 Bernardaud
- 12.1.15.1. Company Overview
- 12.1.15.2. Products
- 12.1.15.3. Company Financials
- 12.1.15.4. SWOT Analysis
- 12.1.16 Degrenne
- 12.1.16.1. Company Overview
- 12.1.16.2. Products
- 12.1.16.3. Company Financials
- 12.1.16.4. SWOT Analysis
- 12.1.17 Arc Holdings
- 12.1.17.1. Company Overview
- 12.1.17.2. Products
- 12.1.17.3. Company Financials
- 12.1.17.4. SWOT Analysis
- 12.1.18 Saturnia
- 12.1.18.1. Company Overview
- 12.1.18.2. Products
- 12.1.18.3. Company Financials
- 12.1.18.4. SWOT Analysis
- 12.1.19 Tognana Porcellane S.p.A
- 12.1.19.1. Company Overview
- 12.1.19.2. Products
- 12.1.19.3. Company Financials
- 12.1.19.4. SWOT Analysis
- 12.1.20 Richard Ginori
- 12.1.20.1. Company Overview
- 12.1.20.2. Products
- 12.1.20.3. Company Financials
- 12.1.20.4. SWOT Analysis
- 12.1.21 Vista Alegre
- 12.1.21.1. Company Overview
- 12.1.21.2. Products
- 12.1.21.3. Company Financials
- 12.1.21.4. SWOT Analysis
- 12.1.22 Apulum
- 12.1.22.1. Company Overview
- 12.1.22.2. Products
- 12.1.22.3. Company Financials
- 12.1.22.4. SWOT Analysis
- 12.1.23 Cesiro
- 12.1.23.1. Company Overview
- 12.1.23.2. Products
- 12.1.23.3. Company Financials
- 12.1.23.4. SWOT Analysis
- 12.1.24 Lubiana
- 12.1.24.1. Company Overview
- 12.1.24.2. Products
- 12.1.24.3. Company Financials
- 12.1.24.4. SWOT Analysis
- 12.1.25 Imperial Porcelain Manufactory
- 12.1.25.1. Company Overview
- 12.1.25.2. Products
- 12.1.25.3. Company Financials
- 12.1.25.4. SWOT Analysis
- 12.1.26 Güral Porselen
- 12.1.26.1. Company Overview
- 12.1.26.2. Products
- 12.1.26.3. Company Financials
- 12.1.26.4. SWOT Analysis
- 12.1.27 Kütahya Porselen
- 12.1.27.1. Company Overview
- 12.1.27.2. Products
- 12.1.27.3. Company Financials
- 12.1.27.4. SWOT Analysis
- 12.1.28 Porland Porselen
- 12.1.28.1. Company Overview
- 12.1.28.2. Products
- 12.1.28.3. Company Financials
- 12.1.28.4. SWOT Analysis
- 12.1.29 Bonna Premium Porcelain
- 12.1.29.1. Company Overview
- 12.1.29.2. Products
- 12.1.29.3. Company Financials
- 12.1.29.4. SWOT Analysis
- 12.1.30 Libbey
- 12.1.30.1. Company Overview
- 12.1.30.2. Products
- 12.1.30.3. Company Financials
- 12.1.30.4. SWOT Analysis
- 12.1.31 Fiesta Tableware Company
- 12.1.31.1. Company Overview
- 12.1.31.2. Products
- 12.1.31.3. Company Financials
- 12.1.31.4. SWOT Analysis
- 12.1.32 Lifetime Brands
- 12.1.32.1. Company Overview
- 12.1.32.2. Products
- 12.1.32.3. Company Financials
- 12.1.32.4. SWOT Analysis
- 12.1.33 Lenox (Oneida)
- 12.1.33.1. Company Overview
- 12.1.33.2. Products
- 12.1.33.3. Company Financials
- 12.1.33.4. SWOT Analysis
- 12.1.34 Morimura (Noritake
- 12.1.34.1. Company Overview
- 12.1.34.2. Products
- 12.1.34.3. Company Financials
- 12.1.34.4. SWOT Analysis
- 12.1.35 Okura Art China)
- 12.1.35.1. Company Overview
- 12.1.35.2. Products
- 12.1.35.3. Company Financials
- 12.1.35.4. SWOT Analysis
- 12.1.36 Narumi
- 12.1.36.1. Company Overview
- 12.1.36.2. Products
- 12.1.36.3. Company Financials
- 12.1.36.4. SWOT Analysis
- 12.1.37 NIKKO CERAMICS
- 12.1.37.1. Company Overview
- 12.1.37.2. Products
- 12.1.37.3. Company Financials
- 12.1.37.4. SWOT Analysis
- 12.1.38 KINTO
- 12.1.38.1. Company Overview
- 12.1.38.2. Products
- 12.1.38.3. Company Financials
- 12.1.38.4. SWOT Analysis
- 12.1.39 Koransha
- 12.1.39.1. Company Overview
- 12.1.39.2. Products
- 12.1.39.3. Company Financials
- 12.1.39.4. SWOT Analysis
- 12.1.40 Hankook Chinaware
- 12.1.40.1. Company Overview
- 12.1.40.2. Products
- 12.1.40.3. Company Financials
- 12.1.40.4. SWOT Analysis
- 12.1.41 ZENHankook
- 12.1.41.1. Company Overview
- 12.1.41.2. Products
- 12.1.41.3. Company Financials
- 12.1.41.4. SWOT Analysis
- 12.1.42 Ariane Fine Porcelain
- 12.1.42.1. Company Overview
- 12.1.42.2. Products
- 12.1.42.3. Company Financials
- 12.1.42.4. SWOT Analysis
- 12.1.43 Ceramic Tableware Pvt. Limited (CTPL)
- 12.1.43.1. Company Overview
- 12.1.43.2. Products
- 12.1.43.3. Company Financials
- 12.1.43.4. SWOT Analysis
- 12.1.44 Clay Craft India
- 12.1.44.1. Company Overview
- 12.1.44.2. Products
- 12.1.44.3. Company Financials
- 12.1.44.4. SWOT Analysis
- 12.1.45 PT. Lucky Indah Keramik
- 12.1.45.1. Company Overview
- 12.1.45.2. Products
- 12.1.45.3. Company Financials
- 12.1.45.4. SWOT Analysis
- 12.1.46 TCL Ceramics
- 12.1.46.1. Company Overview
- 12.1.46.2. Products
- 12.1.46.3. Company Financials
- 12.1.46.4. SWOT Analysis
- 12.1.47 Bharat Potteries
- 12.1.47.1. Company Overview
- 12.1.47.2. Products
- 12.1.47.3. Company Financials
- 12.1.47.4. SWOT Analysis
- 12.1.48 RAK Porcelain
- 12.1.48.1. Company Overview
- 12.1.48.2. Products
- 12.1.48.3. Company Financials
- 12.1.48.4. SWOT Analysis
- 12.1.49 Songfa Ceramics
- 12.1.49.1. Company Overview
- 12.1.49.2. Products
- 12.1.49.3. Company Financials
- 12.1.49.4. SWOT Analysis
- 12.1.50 Hualian China
- 12.1.50.1. Company Overview
- 12.1.50.2. Products
- 12.1.50.3. Company Financials
- 12.1.50.4. SWOT Analysis
- 12.1.51 Sitong Group
- 12.1.51.1. Company Overview
- 12.1.51.2. Products
- 12.1.51.3. Company Financials
- 12.1.51.4. SWOT Analysis
- 12.1.52 The Great Wall
- 12.1.52.1. Company Overview
- 12.1.52.2. Products
- 12.1.52.3. Company Financials
- 12.1.52.4. SWOT Analysis
- 12.1.53 Guangxi Sanhuan
- 12.1.53.1. Company Overview
- 12.1.53.2. Products
- 12.1.53.3. Company Financials
- 12.1.53.4. SWOT Analysis
- 12.1.54 PT Indo Porcelain
- 12.1.54.1. Company Overview
- 12.1.54.2. Products
- 12.1.54.3. Company Financials
- 12.1.54.4. SWOT Analysis
- 12.1.55 PT. Sango Ceramics Indonesia
- 12.1.55.1. Company Overview
- 12.1.55.2. Products
- 12.1.55.3. Company Financials
- 12.1.55.4. SWOT Analysis
- 12.1.56 Trisensa Ceramics Indonesia
- 12.1.56.1. Company Overview
- 12.1.56.2. Products
- 12.1.56.3. Company Financials
- 12.1.56.4. SWOT Analysis
- 12.1.57 PT Haeng Nam Sejahtera (HSI)
- 12.1.57.1. Company Overview
- 12.1.57.2. Products
- 12.1.57.3. Company Financials
- 12.1.57.4. SWOT Analysis
- 12.1.58 Royal Porcelain Public Company Limited
- 12.1.58.1. Company Overview
- 12.1.58.2. Products
- 12.1.58.3. Company Financials
- 12.1.58.4. SWOT Analysis
- 12.1.59 Meriss Ceramics Industrial Group
- 12.1.59.1. Company Overview
- 12.1.59.2. Products
- 12.1.59.3. Company Financials
- 12.1.59.4. SWOT Analysis
- 12.1.60 Dankotuwa Porcelain
- 12.1.60.1. Company Overview
- 12.1.60.2. Products
- 12.1.60.3. Company Financials
- 12.1.60.4. SWOT Analysis
- 12.1.61 Claytan Group
- 12.1.61.1. Company Overview
- 12.1.61.2. Products
- 12.1.61.3. Company Financials
- 12.1.61.4. SWOT Analysis
- 12.1.1 Villeroy & Boch
- 12.2. Market Entropy
- 12.2.1 Company's Key Areas Served
- 12.2.2 Recent Developments
- 12.3. Company Market Share Analysis 2025
- 12.3.1 Top 5 Companies Market Share Analysis
- 12.3.2 Top 3 Companies Market Share Analysis
- 12.4. List of Potential Customers
- 13. Research Methodology
List of Figures
- Figure 1: Global Ceramic Tableware Revenue Breakdown (million, %) by Region 2025 & 2033
- Figure 2: Global Ceramic Tableware Volume Breakdown (K, %) by Region 2025 & 2033
- Figure 3: North America Ceramic Tableware Revenue (million), by Application 2025 & 2033
- Figure 4: North America Ceramic Tableware Volume (K), by Application 2025 & 2033
- Figure 5: North America Ceramic Tableware Revenue Share (%), by Application 2025 & 2033
- Figure 6: North America Ceramic Tableware Volume Share (%), by Application 2025 & 2033
- Figure 7: North America Ceramic Tableware Revenue (million), by Types 2025 & 2033
- Figure 8: North America Ceramic Tableware Volume (K), by Types 2025 & 2033
- Figure 9: North America Ceramic Tableware Revenue Share (%), by Types 2025 & 2033
- Figure 10: North America Ceramic Tableware Volume Share (%), by Types 2025 & 2033
- Figure 11: North America Ceramic Tableware Revenue (million), by Country 2025 & 2033
- Figure 12: North America Ceramic Tableware Volume (K), by Country 2025 & 2033
- Figure 13: North America Ceramic Tableware Revenue Share (%), by Country 2025 & 2033
- Figure 14: North America Ceramic Tableware Volume Share (%), by Country 2025 & 2033
- Figure 15: South America Ceramic Tableware Revenue (million), by Application 2025 & 2033
- Figure 16: South America Ceramic Tableware Volume (K), by Application 2025 & 2033
- Figure 17: South America Ceramic Tableware Revenue Share (%), by Application 2025 & 2033
- Figure 18: South America Ceramic Tableware Volume Share (%), by Application 2025 & 2033
- Figure 19: South America Ceramic Tableware Revenue (million), by Types 2025 & 2033
- Figure 20: South America Ceramic Tableware Volume (K), by Types 2025 & 2033
- Figure 21: South America Ceramic Tableware Revenue Share (%), by Types 2025 & 2033
- Figure 22: South America Ceramic Tableware Volume Share (%), by Types 2025 & 2033
- Figure 23: South America Ceramic Tableware Revenue (million), by Country 2025 & 2033
- Figure 24: South America Ceramic Tableware Volume (K), by Country 2025 & 2033
- Figure 25: South America Ceramic Tableware Revenue Share (%), by Country 2025 & 2033
- Figure 26: South America Ceramic Tableware Volume Share (%), by Country 2025 & 2033
- Figure 27: Europe Ceramic Tableware Revenue (million), by Application 2025 & 2033
- Figure 28: Europe Ceramic Tableware Volume (K), by Application 2025 & 2033
- Figure 29: Europe Ceramic Tableware Revenue Share (%), by Application 2025 & 2033
- Figure 30: Europe Ceramic Tableware Volume Share (%), by Application 2025 & 2033
- Figure 31: Europe Ceramic Tableware Revenue (million), by Types 2025 & 2033
- Figure 32: Europe Ceramic Tableware Volume (K), by Types 2025 & 2033
- Figure 33: Europe Ceramic Tableware Revenue Share (%), by Types 2025 & 2033
- Figure 34: Europe Ceramic Tableware Volume Share (%), by Types 2025 & 2033
- Figure 35: Europe Ceramic Tableware Revenue (million), by Country 2025 & 2033
- Figure 36: Europe Ceramic Tableware Volume (K), by Country 2025 & 2033
- Figure 37: Europe Ceramic Tableware Revenue Share (%), by Country 2025 & 2033
- Figure 38: Europe Ceramic Tableware Volume Share (%), by Country 2025 & 2033
- Figure 39: Middle East & Africa Ceramic Tableware Revenue (million), by Application 2025 & 2033
- Figure 40: Middle East & Africa Ceramic Tableware Volume (K), by Application 2025 & 2033
- Figure 41: Middle East & Africa Ceramic Tableware Revenue Share (%), by Application 2025 & 2033
- Figure 42: Middle East & Africa Ceramic Tableware Volume Share (%), by Application 2025 & 2033
- Figure 43: Middle East & Africa Ceramic Tableware Revenue (million), by Types 2025 & 2033
- Figure 44: Middle East & Africa Ceramic Tableware Volume (K), by Types 2025 & 2033
- Figure 45: Middle East & Africa Ceramic Tableware Revenue Share (%), by Types 2025 & 2033
- Figure 46: Middle East & Africa Ceramic Tableware Volume Share (%), by Types 2025 & 2033
- Figure 47: Middle East & Africa Ceramic Tableware Revenue (million), by Country 2025 & 2033
- Figure 48: Middle East & Africa Ceramic Tableware Volume (K), by Country 2025 & 2033
- Figure 49: Middle East & Africa Ceramic Tableware Revenue Share (%), by Country 2025 & 2033
- Figure 50: Middle East & Africa Ceramic Tableware Volume Share (%), by Country 2025 & 2033
- Figure 51: Asia Pacific Ceramic Tableware Revenue (million), by Application 2025 & 2033
- Figure 52: Asia Pacific Ceramic Tableware Volume (K), by Application 2025 & 2033
- Figure 53: Asia Pacific Ceramic Tableware Revenue Share (%), by Application 2025 & 2033
- Figure 54: Asia Pacific Ceramic Tableware Volume Share (%), by Application 2025 & 2033
- Figure 55: Asia Pacific Ceramic Tableware Revenue (million), by Types 2025 & 2033
- Figure 56: Asia Pacific Ceramic Tableware Volume (K), by Types 2025 & 2033
- Figure 57: Asia Pacific Ceramic Tableware Revenue Share (%), by Types 2025 & 2033
- Figure 58: Asia Pacific Ceramic Tableware Volume Share (%), by Types 2025 & 2033
- Figure 59: Asia Pacific Ceramic Tableware Revenue (million), by Country 2025 & 2033
- Figure 60: Asia Pacific Ceramic Tableware Volume (K), by Country 2025 & 2033
- Figure 61: Asia Pacific Ceramic Tableware Revenue Share (%), by Country 2025 & 2033
- Figure 62: Asia Pacific Ceramic Tableware Volume Share (%), by Country 2025 & 2033
List of Tables
- Table 1: Global Ceramic Tableware Revenue million Forecast, by Application 2020 & 2033
- Table 2: Global Ceramic Tableware Volume K Forecast, by Application 2020 & 2033
- Table 3: Global Ceramic Tableware Revenue million Forecast, by Types 2020 & 2033
- Table 4: Global Ceramic Tableware Volume K Forecast, by Types 2020 & 2033
- Table 5: Global Ceramic Tableware Revenue million Forecast, by Region 2020 & 2033
- Table 6: Global Ceramic Tableware Volume K Forecast, by Region 2020 & 2033
- Table 7: Global Ceramic Tableware Revenue million Forecast, by Application 2020 & 2033
- Table 8: Global Ceramic Tableware Volume K Forecast, by Application 2020 & 2033
- Table 9: Global Ceramic Tableware Revenue million Forecast, by Types 2020 & 2033
- Table 10: Global Ceramic Tableware Volume K Forecast, by Types 2020 & 2033
- Table 11: Global Ceramic Tableware Revenue million Forecast, by Country 2020 & 2033
- Table 12: Global Ceramic Tableware Volume K Forecast, by Country 2020 & 2033
- Table 13: United States Ceramic Tableware Revenue (million) Forecast, by Application 2020 & 2033
- Table 14: United States Ceramic Tableware Volume (K) Forecast, by Application 2020 & 2033
- Table 15: Canada Ceramic Tableware Revenue (million) Forecast, by Application 2020 & 2033
- Table 16: Canada Ceramic Tableware Volume (K) Forecast, by Application 2020 & 2033
- Table 17: Mexico Ceramic Tableware Revenue (million) Forecast, by Application 2020 & 2033
- Table 18: Mexico Ceramic Tableware Volume (K) Forecast, by Application 2020 & 2033
- Table 19: Global Ceramic Tableware Revenue million Forecast, by Application 2020 & 2033
- Table 20: Global Ceramic Tableware Volume K Forecast, by Application 2020 & 2033
- Table 21: Global Ceramic Tableware Revenue million Forecast, by Types 2020 & 2033
- Table 22: Global Ceramic Tableware Volume K Forecast, by Types 2020 & 2033
- Table 23: Global Ceramic Tableware Revenue million Forecast, by Country 2020 & 2033
- Table 24: Global Ceramic Tableware Volume K Forecast, by Country 2020 & 2033
- Table 25: Brazil Ceramic Tableware Revenue (million) Forecast, by Application 2020 & 2033
- Table 26: Brazil Ceramic Tableware Volume (K) Forecast, by Application 2020 & 2033
- Table 27: Argentina Ceramic Tableware Revenue (million) Forecast, by Application 2020 & 2033
- Table 28: Argentina Ceramic Tableware Volume (K) Forecast, by Application 2020 & 2033
- Table 29: Rest of South America Ceramic Tableware Revenue (million) Forecast, by Application 2020 & 2033
- Table 30: Rest of South America Ceramic Tableware Volume (K) Forecast, by Application 2020 & 2033
- Table 31: Global Ceramic Tableware Revenue million Forecast, by Application 2020 & 2033
- Table 32: Global Ceramic Tableware Volume K Forecast, by Application 2020 & 2033
- Table 33: Global Ceramic Tableware Revenue million Forecast, by Types 2020 & 2033
- Table 34: Global Ceramic Tableware Volume K Forecast, by Types 2020 & 2033
- Table 35: Global Ceramic Tableware Revenue million Forecast, by Country 2020 & 2033
- Table 36: Global Ceramic Tableware Volume K Forecast, by Country 2020 & 2033
- Table 37: United Kingdom Ceramic Tableware Revenue (million) Forecast, by Application 2020 & 2033
- Table 38: United Kingdom Ceramic Tableware Volume (K) Forecast, by Application 2020 & 2033
- Table 39: Germany Ceramic Tableware Revenue (million) Forecast, by Application 2020 & 2033
- Table 40: Germany Ceramic Tableware Volume (K) Forecast, by Application 2020 & 2033
- Table 41: France Ceramic Tableware Revenue (million) Forecast, by Application 2020 & 2033
- Table 42: France Ceramic Tableware Volume (K) Forecast, by Application 2020 & 2033
- Table 43: Italy Ceramic Tableware Revenue (million) Forecast, by Application 2020 & 2033
- Table 44: Italy Ceramic Tableware Volume (K) Forecast, by Application 2020 & 2033
- Table 45: Spain Ceramic Tableware Revenue (million) Forecast, by Application 2020 & 2033
- Table 46: Spain Ceramic Tableware Volume (K) Forecast, by Application 2020 & 2033
- Table 47: Russia Ceramic Tableware Revenue (million) Forecast, by Application 2020 & 2033
- Table 48: Russia Ceramic Tableware Volume (K) Forecast, by Application 2020 & 2033
- Table 49: Benelux Ceramic Tableware Revenue (million) Forecast, by Application 2020 & 2033
- Table 50: Benelux Ceramic Tableware Volume (K) Forecast, by Application 2020 & 2033
- Table 51: Nordics Ceramic Tableware Revenue (million) Forecast, by Application 2020 & 2033
- Table 52: Nordics Ceramic Tableware Volume (K) Forecast, by Application 2020 & 2033
- Table 53: Rest of Europe Ceramic Tableware Revenue (million) Forecast, by Application 2020 & 2033
- Table 54: Rest of Europe Ceramic Tableware Volume (K) Forecast, by Application 2020 & 2033
- Table 55: Global Ceramic Tableware Revenue million Forecast, by Application 2020 & 2033
- Table 56: Global Ceramic Tableware Volume K Forecast, by Application 2020 & 2033
- Table 57: Global Ceramic Tableware Revenue million Forecast, by Types 2020 & 2033
- Table 58: Global Ceramic Tableware Volume K Forecast, by Types 2020 & 2033
- Table 59: Global Ceramic Tableware Revenue million Forecast, by Country 2020 & 2033
- Table 60: Global Ceramic Tableware Volume K Forecast, by Country 2020 & 2033
- Table 61: Turkey Ceramic Tableware Revenue (million) Forecast, by Application 2020 & 2033
- Table 62: Turkey Ceramic Tableware Volume (K) Forecast, by Application 2020 & 2033
- Table 63: Israel Ceramic Tableware Revenue (million) Forecast, by Application 2020 & 2033
- Table 64: Israel Ceramic Tableware Volume (K) Forecast, by Application 2020 & 2033
- Table 65: GCC Ceramic Tableware Revenue (million) Forecast, by Application 2020 & 2033
- Table 66: GCC Ceramic Tableware Volume (K) Forecast, by Application 2020 & 2033
- Table 67: North Africa Ceramic Tableware Revenue (million) Forecast, by Application 2020 & 2033
- Table 68: North Africa Ceramic Tableware Volume (K) Forecast, by Application 2020 & 2033
- Table 69: South Africa Ceramic Tableware Revenue (million) Forecast, by Application 2020 & 2033
- Table 70: South Africa Ceramic Tableware Volume (K) Forecast, by Application 2020 & 2033
- Table 71: Rest of Middle East & Africa Ceramic Tableware Revenue (million) Forecast, by Application 2020 & 2033
- Table 72: Rest of Middle East & Africa Ceramic Tableware Volume (K) Forecast, by Application 2020 & 2033
- Table 73: Global Ceramic Tableware Revenue million Forecast, by Application 2020 & 2033
- Table 74: Global Ceramic Tableware Volume K Forecast, by Application 2020 & 2033
- Table 75: Global Ceramic Tableware Revenue million Forecast, by Types 2020 & 2033
- Table 76: Global Ceramic Tableware Volume K Forecast, by Types 2020 & 2033
- Table 77: Global Ceramic Tableware Revenue million Forecast, by Country 2020 & 2033
- Table 78: Global Ceramic Tableware Volume K Forecast, by Country 2020 & 2033
- Table 79: China Ceramic Tableware Revenue (million) Forecast, by Application 2020 & 2033
- Table 80: China Ceramic Tableware Volume (K) Forecast, by Application 2020 & 2033
- Table 81: India Ceramic Tableware Revenue (million) Forecast, by Application 2020 & 2033
- Table 82: India Ceramic Tableware Volume (K) Forecast, by Application 2020 & 2033
- Table 83: Japan Ceramic Tableware Revenue (million) Forecast, by Application 2020 & 2033
- Table 84: Japan Ceramic Tableware Volume (K) Forecast, by Application 2020 & 2033
- Table 85: South Korea Ceramic Tableware Revenue (million) Forecast, by Application 2020 & 2033
- Table 86: South Korea Ceramic Tableware Volume (K) Forecast, by Application 2020 & 2033
- Table 87: ASEAN Ceramic Tableware Revenue (million) Forecast, by Application 2020 & 2033
- Table 88: ASEAN Ceramic Tableware Volume (K) Forecast, by Application 2020 & 2033
- Table 89: Oceania Ceramic Tableware Revenue (million) Forecast, by Application 2020 & 2033
- Table 90: Oceania Ceramic Tableware Volume (K) Forecast, by Application 2020 & 2033
- Table 91: Rest of Asia Pacific Ceramic Tableware Revenue (million) Forecast, by Application 2020 & 2033
- Table 92: Rest of Asia Pacific Ceramic Tableware Volume (K) Forecast, by Application 2020 & 2033
Frequently Asked Questions
1. What is the projected Compound Annual Growth Rate (CAGR) of the Ceramic Tableware?
The projected CAGR is approximately 6.2%.
2. Which companies are prominent players in the Ceramic Tableware?
Key companies in the market include Villeroy & Boch, Rosenthal GmbH, Meissen, KAHLA/Thüringen Porzellan, Seltmann Weiden, WMF, BHS (Schönwald, Bauscher and Tafelstern), Fiskars Group, Portmeirion Group, Steelite International, Churchill China, Denby Pottery Company, Royal Crown Derby, Bernardaud, Degrenne, Arc Holdings, Saturnia, Tognana Porcellane S.p.A, Richard Ginori, Vista Alegre, Apulum, Cesiro, Lubiana, Imperial Porcelain Manufactory, Güral Porselen, Kütahya Porselen, Porland Porselen, Bonna Premium Porcelain, Libbey, Fiesta Tableware Company, Lifetime Brands, Lenox (Oneida), Morimura (Noritake, Okura Art China), Narumi, NIKKO CERAMICS, KINTO, Koransha, Hankook Chinaware, ZENHankook, Ariane Fine Porcelain, Ceramic Tableware Pvt. Limited (CTPL), Clay Craft India, PT. Lucky Indah Keramik, TCL Ceramics, Bharat Potteries, RAK Porcelain, Songfa Ceramics, Hualian China, Sitong Group, The Great Wall, Guangxi Sanhuan, PT Indo Porcelain, PT. Sango Ceramics Indonesia, Trisensa Ceramics Indonesia, PT Haeng Nam Sejahtera (HSI), Royal Porcelain Public Company Limited, Meriss Ceramics Industrial Group, Dankotuwa Porcelain, Claytan Group.
3. What are the main segments of the Ceramic Tableware?
The market segments include Application, Types.
4. Can you provide details about the market size?
The market size is estimated to be USD 19079.91 million as of 2022.
5. What are some drivers contributing to market growth?
N/A
6. What are the notable trends driving market growth?
N/A
7. Are there any restraints impacting market growth?
N/A
8. Can you provide examples of recent developments in the market?
N/A
9. What pricing options are available for accessing the report?
Pricing options include single-user, multi-user, and enterprise licenses priced at USD 3350.00, USD 5025.00, and USD 6700.00 respectively.
10. Is the market size provided in terms of value or volume?
The market size is provided in terms of value, measured in million and volume, measured in K.
11. Are there any specific market keywords associated with the report?
Yes, the market keyword associated with the report is "Ceramic Tableware," which aids in identifying and referencing the specific market segment covered.
12. How do I determine which pricing option suits my needs best?
The pricing options vary based on user requirements and access needs. Individual users may opt for single-user licenses, while businesses requiring broader access may choose multi-user or enterprise licenses for cost-effective access to the report.
13. Are there any additional resources or data provided in the Ceramic Tableware report?
While the report offers comprehensive insights, it's advisable to review the specific contents or supplementary materials provided to ascertain if additional resources or data are available.
14. How can I stay updated on further developments or reports in the Ceramic Tableware?
To stay informed about further developments, trends, and reports in the Ceramic Tableware, consider subscribing to industry newsletters, following relevant companies and organizations, or regularly checking reputable industry news sources and publications.
Methodology
Step 1 - Identification of Relevant Samples Size from Population Database


Step 2 - Approaches for Defining Global Market Size (Value, Volume* & Price*)

Note*: In applicable scenarios
Step 3 - Data Sources
Primary Research
- Web Analytics
- Survey Reports
- Research Institute
- Latest Research Reports
- Opinion Leaders
Secondary Research
- Annual Reports
- White Paper
- Latest Press Release
- Industry Association
- Paid Database
- Investor Presentations

Step 4 - Data Triangulation
Involves using different sources of information in order to increase the validity of a study
These sources are likely to be stakeholders in a program - participants, other researchers, program staff, other community members, and so on.
Then we put all data in single framework & apply various statistical tools to find out the dynamic on the market.
During the analysis stage, feedback from the stakeholder groups would be compared to determine areas of agreement as well as areas of divergence