

Key Insights
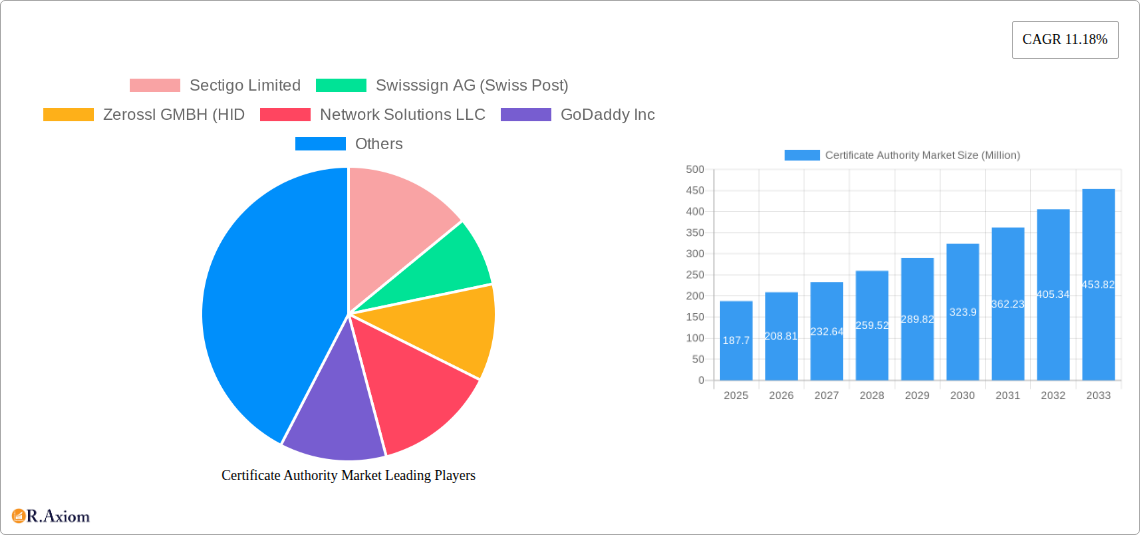
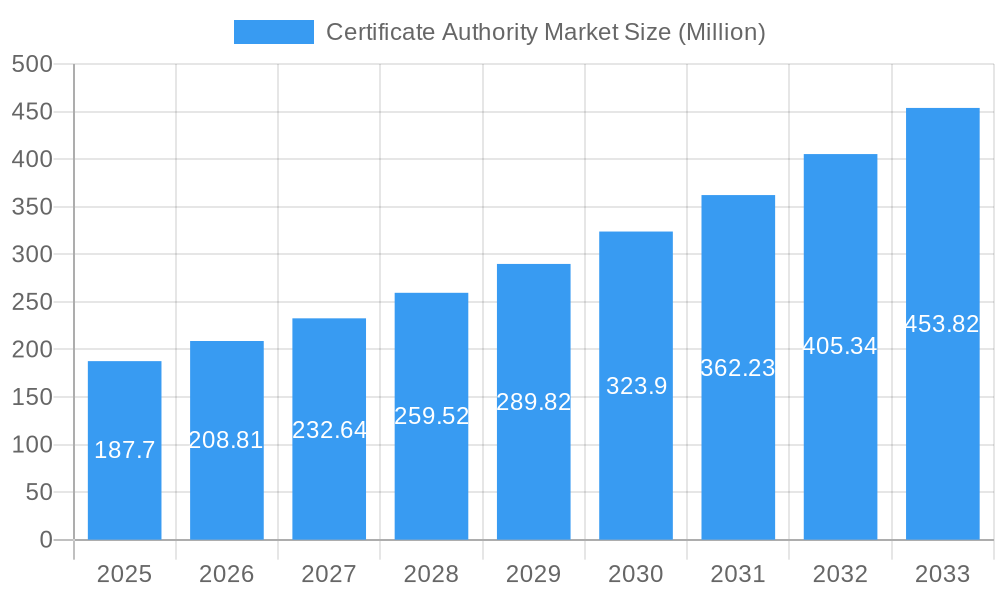
The Certificate Authority (CA) market, valued at $187.70 million in 2025, is experiencing robust growth, projected to expand at a Compound Annual Growth Rate (CAGR) of 11.18% from 2025 to 2033. This expansion is driven by the increasing need for secure digital transactions and heightened cybersecurity concerns across various sectors. The rising adoption of cloud computing, the Internet of Things (IoT), and e-commerce fuels demand for digital certificates, thereby bolstering market growth. Furthermore, stringent government regulations regarding data privacy and security are compelling organizations to adopt robust CA solutions. The market is segmented by component (certificate types and authentication services), organization size (large enterprises and SMEs), and end-user vertical (BFSI, retail, healthcare, IT and telecom, and others). Large enterprises currently dominate the market due to their higher investment capacity in security infrastructure, but the SME segment is anticipated to witness significant growth owing to increasing digitalization efforts. Geographical distribution shows a strong presence in North America and Europe, driven by early adoption of digital technologies and robust cybersecurity frameworks. However, Asia-Pacific is expected to emerge as a high-growth region in the coming years, fueled by burgeoning digital economies and expanding internet penetration. Competitive rivalry is intense, with established players like Sectigo, DigiCert, and GlobalSign competing with emerging players, fostering innovation and driving price competitiveness.
Certificate Authority Market Market Size (In Million)
The future of the CA market hinges on technological advancements such as the widespread adoption of blockchain technology for enhanced security and trust, and the increasing integration of AI and machine learning for fraud detection and certificate lifecycle management. The market also faces challenges including rising complexity in managing certificates across diverse platforms and increasing concerns over certificate vulnerabilities and potential attacks. Addressing these challenges through proactive security measures, improved certificate management tools, and enhanced user education will be crucial for sustained market expansion. The expansion of 5G and IoT technologies also present opportunities, as these technologies necessitate increased secure authentication and encryption solutions. Therefore, the CA market is poised for continued growth, propelled by a combination of technological innovation, evolving regulatory landscapes, and the escalating demand for digital trust and security across various sectors.
Certificate Authority Market Company Market Share
Certificate Authority Market: A Comprehensive Report (2019-2033)
This detailed report provides a comprehensive analysis of the Certificate Authority market, covering market size, growth projections, key players, and emerging trends from 2019 to 2033. The report leverages extensive primary and secondary research to offer actionable insights for businesses, investors, and industry stakeholders.
Certificate Authority Market Concentration & Innovation
The Certificate Authority market exhibits a moderately concentrated landscape, with a few dominant players controlling a significant market share. Market concentration is influenced by factors such as brand recognition, technological expertise, global reach, and established client relationships. However, the market also features several smaller, specialized players offering niche solutions. Innovation in the sector is driven by the need for enhanced security, streamlined certificate management processes, and expanding applications across diverse industries. The increasing complexity of digital infrastructure and the growing prevalence of cyber threats fuel continuous innovation in certificate types, authentication methods, and overall service delivery. Regulatory frameworks, particularly those concerning data privacy and cybersecurity, play a significant role in shaping market practices and influencing innovation. The market also witnesses constant evolution in product substitutes, with alternative security solutions sometimes emerging as compelling options. End-user trends increasingly favor automated certificate management and integration with other security tools. Mergers and acquisitions (M&A) activity is moderate but significant, with larger players acquiring smaller companies to expand their capabilities or market reach. Recent M&A deals have involved values ranging from xx Million to xx Million, impacting market dynamics by consolidating market share and enhancing technological capabilities.
Certificate Authority Market Industry Trends & Insights
The Certificate Authority market is experiencing robust growth, driven by the escalating adoption of digital technologies and the concomitant rise in cybersecurity concerns across diverse industries. The market is projected to register a CAGR of xx% during the forecast period (2025-2033), fueled by expanding internet penetration, increasing e-commerce transactions, and the proliferation of IoT devices. Technological advancements, such as the increasing adoption of automation and AI in certificate management, are transforming market dynamics. This shift accelerates certificate issuance and simplifies overall management, improving efficiency and reducing operational costs. Consumer preferences are gravitating toward cloud-based certificate management solutions and enhanced security features, particularly concerning data privacy and compliance. Competitive dynamics are characterized by technological innovation, strategic partnerships, and a focus on expanding service portfolios. Market penetration in key segments, including large enterprises, is high, while growth opportunities exist in small and medium-sized enterprises (SMEs) and emerging economies.
Dominant Markets & Segments in Certificate Authority Market
Leading Region/Country: North America continues to lead the Certificate Authority market, propelled by its advanced technological adoption, stringent cybersecurity mandates, and a significant cluster of industry leaders. Key catalysts include a stable economic environment, sophisticated digital infrastructure, and a proactive stance on cybersecurity. Europe and the Asia-Pacific region are also experiencing robust expansion.
By Component: The Certificate Types segment is projected to maintain its dominance, fueled by the escalating demand for SSL/TLS certificates crucial for website security and user authentication. The Authentication Certificates segment is witnessing substantial growth, driven by the increasing adoption of advanced authentication mechanisms across a wide spectrum of applications.
By Organization Size: Large Enterprises presently command the largest market share, owing to their greater investment capacity in cybersecurity solutions and the imperative for sophisticated certificate management. However, the Small and Medium-Sized Enterprises (SME) segment is demonstrating significant growth potential, spurred by accelerating digitalization and heightened awareness of cybersecurity risks.
By End-user Vertical: The BFSI (Banking, Financial Services, and Insurance) sector remains a primary growth engine, driven by rigorous regulatory compliance and the critical need for secure financial transactions. The IT and Telecom sector is exhibiting strong growth due to the high volume of online transactions and the essential nature of its infrastructure. The Healthcare sector is showing moderate yet consistent growth, supported by the increasing adoption of electronic health records and telemedicine solutions. Retail, significantly boosted by the surge in e-commerce, continues its robust growth trajectory. Other end-user verticals are experiencing steady expansion as digital technologies become more pervasive across various industries.
Certificate Authority Market Product Developments
Recent advancements in the Certificate Authority market are strategically focused on bolstering security capabilities, automating certificate lifecycle management, and seamless integration with existing security ecosystems. These innovations encompass streamlined certificate issuance and renewal workflows, more robust key management solutions, and enhanced interoperability with cloud platforms. These developments are a direct response to the growing demand for intuitive security solutions, reduced operational overhead, and cost efficiencies. The market viability of these products is assessed based on factors such as scalability, user-friendliness, and adherence to prevailing industry standards and compliance frameworks.
Report Scope & Segmentation Analysis
This report segments the Certificate Authority market across various parameters:
- By Component: Certificate Types (SSL/TLS, Code Signing, Email Security, etc.) and Authentication Certificates (client, server, device).
- By Organization Size: Large Enterprises and Small and Medium-Sized Enterprises (SMEs).
- By End-user Vertical: BFSI, Retail, Healthcare, IT and Telecom, and Other End-user Verticals.
Each segment includes detailed analysis of growth projections, market size (in Million), and competitive dynamics, providing a comprehensive understanding of market opportunities and challenges within each sector. The market size for each segment is projected to reach xx Million by 2033.
Key Drivers of Certificate Authority Market Growth
The Certificate Authority market growth is primarily driven by the increasing demand for online security, growing internet penetration, the proliferation of IoT devices, and stringent regulatory compliance requirements. The rising adoption of cloud computing, the increasing use of mobile devices, and the expansion of e-commerce further fuel market expansion. Government initiatives promoting digitalization and cybersecurity are contributing to market growth.
Challenges in the Certificate Authority Market Sector
Challenges include maintaining compliance with evolving regulatory landscapes, addressing the complexities of managing digital certificates, and combating sophisticated cyberattacks. Competition from alternative security solutions and maintaining the trust and confidence of customers in the face of security breaches pose significant hurdles. Supply chain disruptions and economic downturns can also impact market dynamics. The potential for security breaches and resulting financial losses represent significant risks to the sector.
Emerging Opportunities in Certificate Authority Market
Significant emerging opportunities lie in the creation of sophisticated, next-generation certificate management platforms, the integration of Artificial Intelligence (AI) and Machine Learning (ML) for proactive threat detection and enhanced security, and the strategic expansion into nascent vertical markets, including the automotive and industrial IoT (Internet of Things) sectors. The burgeoning demand for secure IoT devices and the development of blockchain-enabled security solutions present substantial avenues for growth. Furthermore, a strong emphasis on delivering superior customer support and implementing proactive threat intelligence strategies will be instrumental in capturing market share and fostering expansion.
Leading Players in the Certificate Authority Market Market
- Sectigo Limited
- Swisssign AG (Swiss Post)
- Zerossl GMBH
- HID
- Network Solutions LLC
- GoDaddy Inc
- Trustwave Holdings Inc (Chertoff Group)
- GlobalSign
- Actalis S p A
- Camerfirma SA
- WISeKey International Holdings Ltd
- DigiCert Inc
- OneSpan Inc
- Asseco Data Systems SA (Asseco Poland SA)
- Buypass AS
- Entrust Corporation
- SSL Com
Key Developments in Certificate Authority Market Industry
February 2024: GlobalSign, Inc. launched a new Kubernetes cert-manager issuer, simplifying certificate management for Kubernetes users. This development enhances security and streamlines workflows in a rapidly growing sector.
January 2024: Aquion partnered with Trustwave to enhance cybersecurity solutions in Australia and New Zealand, expanding the reach of advanced technologies and strengthening market presence in the region.
Strategic Outlook for Certificate Authority Market Market
The Certificate Authority market is on a trajectory for sustained expansion, driven by the ongoing digital transformation across businesses and the unceasing requirement for robust online security. Future growth will be fueled by venturing into untapped markets, pioneering innovative solutions, and adapting to the ever-evolving technological landscape. The strategic adoption of AI-powered security measures and streamlined management platforms will be pivotal for maintaining a competitive advantage. The market's outlook is exceptionally promising, with significant growth potential spanning a wide array of sectors and global regions.
Certificate Authority Market Segmentation
-
1. Component
-
1.1. Certificate Types
- 1.1.1. SSL Certificates
- 1.1.2. Code Signing Certificates
- 1.1.3. Secure Email Certificates
- 1.1.4. Authentication Certificates
- 1.2. Services
-
1.1. Certificate Types
-
2. Organization Size
- 2.1. Large Enterprises
- 2.2. Small and Medium-Sized Enterprises
-
3. End-user Vertical
- 3.1. BFSI
- 3.2. Retail
- 3.3. Healthcare
- 3.4. IT and Telecom
- 3.5. Other End-user Verticals
Certificate Authority Market Segmentation By Geography
- 1. North America
- 2. Europe
- 3. Asia
- 4. Australia and New Zealand
- 5. Latin America
- 6. Middle East and Africa
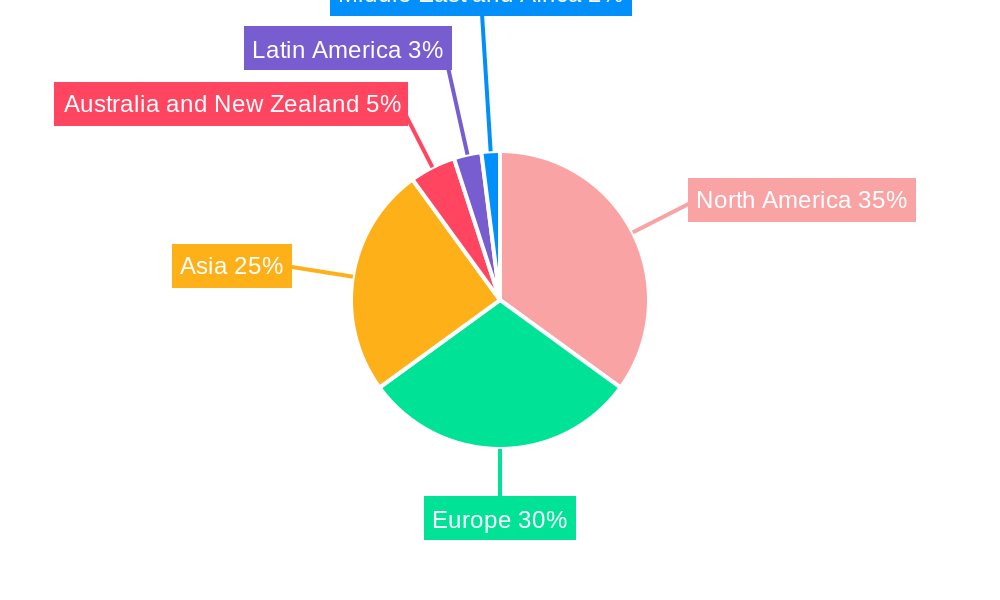
Certificate Authority Market Regional Market Share
Geographic Coverage of Certificate Authority Market
Certificate Authority Market REPORT HIGHLIGHTS
| Aspects | Details |
|---|---|
| Study Period | 2020-2034 |
| Base Year | 2025 |
| Estimated Year | 2026 |
| Forecast Period | 2026-2034 |
| Historical Period | 2020-2025 |
| Growth Rate | CAGR of 11.18% from 2020-2034 |
| Segmentation |
|
Table of Contents
- 1. Introduction
- 1.1. Research Scope
- 1.2. Market Segmentation
- 1.3. Research Objective
- 1.4. Definitions and Assumptions
- 2. Executive Summary
- 2.1. Market Snapshot
- 3. Market Dynamics
- 3.1. Market Drivers
- 3.2. Market Restrains
- 3.3. Market Trends
- 3.4. Market Opportunities
- 4. Market Factor Analysis
- 4.1. Porters Five Forces
- 4.1.1. Bargaining Power of Suppliers
- 4.1.2. Bargaining Power of Buyers
- 4.1.3. Threat of New Entrants
- 4.1.4. Threat of Substitutes
- 4.1.5. Competitive Rivalry
- 4.2. PESTEL analysis
- 4.3. BCG Analysis
- 4.3.1. Stars (High Growth, High Market Share)
- 4.3.2. Cash Cows (Low Growth, High Market Share)
- 4.3.3. Question Mark (High Growth, Low Market Share)
- 4.3.4. Dogs (Low Growth, Low Market Share)
- 4.4. Ansoff Matrix Analysis
- 4.5. Supply Chain Analysis
- 4.6. Regulatory Landscape
- 4.7. Current Market Potential and Opportunity Assessment (TAM–SAM–SOM Framework)
- 4.8. RAX Analyst Note
- 4.1. Porters Five Forces
- 5. Market Analysis, Insights and Forecast 2021-2033
- 5.1. Market Analysis, Insights and Forecast - by Component
- 5.1.1. Certificate Types
- 5.1.1.1. SSL Certificates
- 5.1.1.2. Code Signing Certificates
- 5.1.1.3. Secure Email Certificates
- 5.1.1.4. Authentication Certificates
- 5.1.2. Services
- 5.1.1. Certificate Types
- 5.2. Market Analysis, Insights and Forecast - by Organization Size
- 5.2.1. Large Enterprises
- 5.2.2. Small and Medium-Sized Enterprises
- 5.3. Market Analysis, Insights and Forecast - by End-user Vertical
- 5.3.1. BFSI
- 5.3.2. Retail
- 5.3.3. Healthcare
- 5.3.4. IT and Telecom
- 5.3.5. Other End-user Verticals
- 5.4. Market Analysis, Insights and Forecast - by Region
- 5.4.1. North America
- 5.4.2. Europe
- 5.4.3. Asia
- 5.4.4. Australia and New Zealand
- 5.4.5. Latin America
- 5.4.6. Middle East and Africa
- 5.1. Market Analysis, Insights and Forecast - by Component
- 6. Global Certificate Authority Market Analysis, Insights and Forecast, 2021-2033
- 6.1. Market Analysis, Insights and Forecast - by Component
- 6.1.1. Certificate Types
- 6.1.1.1. SSL Certificates
- 6.1.1.2. Code Signing Certificates
- 6.1.1.3. Secure Email Certificates
- 6.1.1.4. Authentication Certificates
- 6.1.2. Services
- 6.1.1. Certificate Types
- 6.2. Market Analysis, Insights and Forecast - by Organization Size
- 6.2.1. Large Enterprises
- 6.2.2. Small and Medium-Sized Enterprises
- 6.3. Market Analysis, Insights and Forecast - by End-user Vertical
- 6.3.1. BFSI
- 6.3.2. Retail
- 6.3.3. Healthcare
- 6.3.4. IT and Telecom
- 6.3.5. Other End-user Verticals
- 6.1. Market Analysis, Insights and Forecast - by Component
- 7. North America Certificate Authority Market Analysis, Insights and Forecast, 2020-2032
- 7.1. Market Analysis, Insights and Forecast - by Component
- 7.1.1. Certificate Types
- 7.1.1.1. SSL Certificates
- 7.1.1.2. Code Signing Certificates
- 7.1.1.3. Secure Email Certificates
- 7.1.1.4. Authentication Certificates
- 7.1.2. Services
- 7.1.1. Certificate Types
- 7.2. Market Analysis, Insights and Forecast - by Organization Size
- 7.2.1. Large Enterprises
- 7.2.2. Small and Medium-Sized Enterprises
- 7.3. Market Analysis, Insights and Forecast - by End-user Vertical
- 7.3.1. BFSI
- 7.3.2. Retail
- 7.3.3. Healthcare
- 7.3.4. IT and Telecom
- 7.3.5. Other End-user Verticals
- 7.1. Market Analysis, Insights and Forecast - by Component
- 8. Europe Certificate Authority Market Analysis, Insights and Forecast, 2020-2032
- 8.1. Market Analysis, Insights and Forecast - by Component
- 8.1.1. Certificate Types
- 8.1.1.1. SSL Certificates
- 8.1.1.2. Code Signing Certificates
- 8.1.1.3. Secure Email Certificates
- 8.1.1.4. Authentication Certificates
- 8.1.2. Services
- 8.1.1. Certificate Types
- 8.2. Market Analysis, Insights and Forecast - by Organization Size
- 8.2.1. Large Enterprises
- 8.2.2. Small and Medium-Sized Enterprises
- 8.3. Market Analysis, Insights and Forecast - by End-user Vertical
- 8.3.1. BFSI
- 8.3.2. Retail
- 8.3.3. Healthcare
- 8.3.4. IT and Telecom
- 8.3.5. Other End-user Verticals
- 8.1. Market Analysis, Insights and Forecast - by Component
- 9. Asia Certificate Authority Market Analysis, Insights and Forecast, 2020-2032
- 9.1. Market Analysis, Insights and Forecast - by Component
- 9.1.1. Certificate Types
- 9.1.1.1. SSL Certificates
- 9.1.1.2. Code Signing Certificates
- 9.1.1.3. Secure Email Certificates
- 9.1.1.4. Authentication Certificates
- 9.1.2. Services
- 9.1.1. Certificate Types
- 9.2. Market Analysis, Insights and Forecast - by Organization Size
- 9.2.1. Large Enterprises
- 9.2.2. Small and Medium-Sized Enterprises
- 9.3. Market Analysis, Insights and Forecast - by End-user Vertical
- 9.3.1. BFSI
- 9.3.2. Retail
- 9.3.3. Healthcare
- 9.3.4. IT and Telecom
- 9.3.5. Other End-user Verticals
- 9.1. Market Analysis, Insights and Forecast - by Component
- 10. Australia and New Zealand Certificate Authority Market Analysis, Insights and Forecast, 2020-2032
- 10.1. Market Analysis, Insights and Forecast - by Component
- 10.1.1. Certificate Types
- 10.1.1.1. SSL Certificates
- 10.1.1.2. Code Signing Certificates
- 10.1.1.3. Secure Email Certificates
- 10.1.1.4. Authentication Certificates
- 10.1.2. Services
- 10.1.1. Certificate Types
- 10.2. Market Analysis, Insights and Forecast - by Organization Size
- 10.2.1. Large Enterprises
- 10.2.2. Small and Medium-Sized Enterprises
- 10.3. Market Analysis, Insights and Forecast - by End-user Vertical
- 10.3.1. BFSI
- 10.3.2. Retail
- 10.3.3. Healthcare
- 10.3.4. IT and Telecom
- 10.3.5. Other End-user Verticals
- 10.1. Market Analysis, Insights and Forecast - by Component
- 11. Latin America Certificate Authority Market Analysis, Insights and Forecast, 2020-2032
- 11.1. Market Analysis, Insights and Forecast - by Component
- 11.1.1. Certificate Types
- 11.1.1.1. SSL Certificates
- 11.1.1.2. Code Signing Certificates
- 11.1.1.3. Secure Email Certificates
- 11.1.1.4. Authentication Certificates
- 11.1.2. Services
- 11.1.1. Certificate Types
- 11.2. Market Analysis, Insights and Forecast - by Organization Size
- 11.2.1. Large Enterprises
- 11.2.2. Small and Medium-Sized Enterprises
- 11.3. Market Analysis, Insights and Forecast - by End-user Vertical
- 11.3.1. BFSI
- 11.3.2. Retail
- 11.3.3. Healthcare
- 11.3.4. IT and Telecom
- 11.3.5. Other End-user Verticals
- 11.1. Market Analysis, Insights and Forecast - by Component
- 12. Middle East and Africa Certificate Authority Market Analysis, Insights and Forecast, 2020-2032
- 12.1. Market Analysis, Insights and Forecast - by Component
- 12.1.1. Certificate Types
- 12.1.1.1. SSL Certificates
- 12.1.1.2. Code Signing Certificates
- 12.1.1.3. Secure Email Certificates
- 12.1.1.4. Authentication Certificates
- 12.1.2. Services
- 12.1.1. Certificate Types
- 12.2. Market Analysis, Insights and Forecast - by Organization Size
- 12.2.1. Large Enterprises
- 12.2.2. Small and Medium-Sized Enterprises
- 12.3. Market Analysis, Insights and Forecast - by End-user Vertical
- 12.3.1. BFSI
- 12.3.2. Retail
- 12.3.3. Healthcare
- 12.3.4. IT and Telecom
- 12.3.5. Other End-user Verticals
- 12.1. Market Analysis, Insights and Forecast - by Component
- 13. Competitive Analysis
- 13.1. Company Profiles
- 13.1.1 Sectigo Limited
- 13.1.1.1. Company Overview
- 13.1.1.2. Products
- 13.1.1.3. Company Financials
- 13.1.1.4. SWOT Analysis
- 13.1.2 Swisssign AG (Swiss Post)
- 13.1.2.1. Company Overview
- 13.1.2.2. Products
- 13.1.2.3. Company Financials
- 13.1.2.4. SWOT Analysis
- 13.1.3 Zerossl GMBH (HID
- 13.1.3.1. Company Overview
- 13.1.3.2. Products
- 13.1.3.3. Company Financials
- 13.1.3.4. SWOT Analysis
- 13.1.4 Network Solutions LLC
- 13.1.4.1. Company Overview
- 13.1.4.2. Products
- 13.1.4.3. Company Financials
- 13.1.4.4. SWOT Analysis
- 13.1.5 GoDaddy Inc
- 13.1.5.1. Company Overview
- 13.1.5.2. Products
- 13.1.5.3. Company Financials
- 13.1.5.4. SWOT Analysis
- 13.1.6 Trustwave Holdings Inc (Chertoff Group)
- 13.1.6.1. Company Overview
- 13.1.6.2. Products
- 13.1.6.3. Company Financials
- 13.1.6.4. SWOT Analysis
- 13.1.7 GlobalSign
- 13.1.7.1. Company Overview
- 13.1.7.2. Products
- 13.1.7.3. Company Financials
- 13.1.7.4. SWOT Analysis
- 13.1.8 Actalis S p A
- 13.1.8.1. Company Overview
- 13.1.8.2. Products
- 13.1.8.3. Company Financials
- 13.1.8.4. SWOT Analysis
- 13.1.9 Camerfirma SA
- 13.1.9.1. Company Overview
- 13.1.9.2. Products
- 13.1.9.3. Company Financials
- 13.1.9.4. SWOT Analysis
- 13.1.10 WISeKey International Holdings Ltd
- 13.1.10.1. Company Overview
- 13.1.10.2. Products
- 13.1.10.3. Company Financials
- 13.1.10.4. SWOT Analysis
- 13.1.11 DigiCert Inc
- 13.1.11.1. Company Overview
- 13.1.11.2. Products
- 13.1.11.3. Company Financials
- 13.1.11.4. SWOT Analysis
- 13.1.12 OneSpan Inc
- 13.1.12.1. Company Overview
- 13.1.12.2. Products
- 13.1.12.3. Company Financials
- 13.1.12.4. SWOT Analysis
- 13.1.13 Asseco Data Systems SA (Asseco Poland SA)
- 13.1.13.1. Company Overview
- 13.1.13.2. Products
- 13.1.13.3. Company Financials
- 13.1.13.4. SWOT Analysis
- 13.1.14 Buypass AS
- 13.1.14.1. Company Overview
- 13.1.14.2. Products
- 13.1.14.3. Company Financials
- 13.1.14.4. SWOT Analysis
- 13.1.15 Entrust Corporation
- 13.1.15.1. Company Overview
- 13.1.15.2. Products
- 13.1.15.3. Company Financials
- 13.1.15.4. SWOT Analysis
- 13.1.16 SSL Com
- 13.1.16.1. Company Overview
- 13.1.16.2. Products
- 13.1.16.3. Company Financials
- 13.1.16.4. SWOT Analysis
- 13.1.1 Sectigo Limited
- 13.2. Market Entropy
- 13.2.1 Company's Key Areas Served
- 13.2.2 Recent Developments
- 13.3. Company Market Share Analysis 2025
- 13.3.1 Top 5 Companies Market Share Analysis
- 13.3.2 Top 3 Companies Market Share Analysis
- 13.4. List of Potential Customers
- 14. Research Methodology
List of Figures
- Figure 1: Global Certificate Authority Market Revenue Breakdown (Million, %) by Region 2025 & 2033
- Figure 2: Global Certificate Authority Market Volume Breakdown (K Unit, %) by Region 2025 & 2033
- Figure 3: North America Certificate Authority Market Revenue (Million), by Component 2025 & 2033
- Figure 4: North America Certificate Authority Market Volume (K Unit), by Component 2025 & 2033
- Figure 5: North America Certificate Authority Market Revenue Share (%), by Component 2025 & 2033
- Figure 6: North America Certificate Authority Market Volume Share (%), by Component 2025 & 2033
- Figure 7: North America Certificate Authority Market Revenue (Million), by Organization Size 2025 & 2033
- Figure 8: North America Certificate Authority Market Volume (K Unit), by Organization Size 2025 & 2033
- Figure 9: North America Certificate Authority Market Revenue Share (%), by Organization Size 2025 & 2033
- Figure 10: North America Certificate Authority Market Volume Share (%), by Organization Size 2025 & 2033
- Figure 11: North America Certificate Authority Market Revenue (Million), by End-user Vertical 2025 & 2033
- Figure 12: North America Certificate Authority Market Volume (K Unit), by End-user Vertical 2025 & 2033
- Figure 13: North America Certificate Authority Market Revenue Share (%), by End-user Vertical 2025 & 2033
- Figure 14: North America Certificate Authority Market Volume Share (%), by End-user Vertical 2025 & 2033
- Figure 15: North America Certificate Authority Market Revenue (Million), by Country 2025 & 2033
- Figure 16: North America Certificate Authority Market Volume (K Unit), by Country 2025 & 2033
- Figure 17: North America Certificate Authority Market Revenue Share (%), by Country 2025 & 2033
- Figure 18: North America Certificate Authority Market Volume Share (%), by Country 2025 & 2033
- Figure 19: Europe Certificate Authority Market Revenue (Million), by Component 2025 & 2033
- Figure 20: Europe Certificate Authority Market Volume (K Unit), by Component 2025 & 2033
- Figure 21: Europe Certificate Authority Market Revenue Share (%), by Component 2025 & 2033
- Figure 22: Europe Certificate Authority Market Volume Share (%), by Component 2025 & 2033
- Figure 23: Europe Certificate Authority Market Revenue (Million), by Organization Size 2025 & 2033
- Figure 24: Europe Certificate Authority Market Volume (K Unit), by Organization Size 2025 & 2033
- Figure 25: Europe Certificate Authority Market Revenue Share (%), by Organization Size 2025 & 2033
- Figure 26: Europe Certificate Authority Market Volume Share (%), by Organization Size 2025 & 2033
- Figure 27: Europe Certificate Authority Market Revenue (Million), by End-user Vertical 2025 & 2033
- Figure 28: Europe Certificate Authority Market Volume (K Unit), by End-user Vertical 2025 & 2033
- Figure 29: Europe Certificate Authority Market Revenue Share (%), by End-user Vertical 2025 & 2033
- Figure 30: Europe Certificate Authority Market Volume Share (%), by End-user Vertical 2025 & 2033
- Figure 31: Europe Certificate Authority Market Revenue (Million), by Country 2025 & 2033
- Figure 32: Europe Certificate Authority Market Volume (K Unit), by Country 2025 & 2033
- Figure 33: Europe Certificate Authority Market Revenue Share (%), by Country 2025 & 2033
- Figure 34: Europe Certificate Authority Market Volume Share (%), by Country 2025 & 2033
- Figure 35: Asia Certificate Authority Market Revenue (Million), by Component 2025 & 2033
- Figure 36: Asia Certificate Authority Market Volume (K Unit), by Component 2025 & 2033
- Figure 37: Asia Certificate Authority Market Revenue Share (%), by Component 2025 & 2033
- Figure 38: Asia Certificate Authority Market Volume Share (%), by Component 2025 & 2033
- Figure 39: Asia Certificate Authority Market Revenue (Million), by Organization Size 2025 & 2033
- Figure 40: Asia Certificate Authority Market Volume (K Unit), by Organization Size 2025 & 2033
- Figure 41: Asia Certificate Authority Market Revenue Share (%), by Organization Size 2025 & 2033
- Figure 42: Asia Certificate Authority Market Volume Share (%), by Organization Size 2025 & 2033
- Figure 43: Asia Certificate Authority Market Revenue (Million), by End-user Vertical 2025 & 2033
- Figure 44: Asia Certificate Authority Market Volume (K Unit), by End-user Vertical 2025 & 2033
- Figure 45: Asia Certificate Authority Market Revenue Share (%), by End-user Vertical 2025 & 2033
- Figure 46: Asia Certificate Authority Market Volume Share (%), by End-user Vertical 2025 & 2033
- Figure 47: Asia Certificate Authority Market Revenue (Million), by Country 2025 & 2033
- Figure 48: Asia Certificate Authority Market Volume (K Unit), by Country 2025 & 2033
- Figure 49: Asia Certificate Authority Market Revenue Share (%), by Country 2025 & 2033
- Figure 50: Asia Certificate Authority Market Volume Share (%), by Country 2025 & 2033
- Figure 51: Australia and New Zealand Certificate Authority Market Revenue (Million), by Component 2025 & 2033
- Figure 52: Australia and New Zealand Certificate Authority Market Volume (K Unit), by Component 2025 & 2033
- Figure 53: Australia and New Zealand Certificate Authority Market Revenue Share (%), by Component 2025 & 2033
- Figure 54: Australia and New Zealand Certificate Authority Market Volume Share (%), by Component 2025 & 2033
- Figure 55: Australia and New Zealand Certificate Authority Market Revenue (Million), by Organization Size 2025 & 2033
- Figure 56: Australia and New Zealand Certificate Authority Market Volume (K Unit), by Organization Size 2025 & 2033
- Figure 57: Australia and New Zealand Certificate Authority Market Revenue Share (%), by Organization Size 2025 & 2033
- Figure 58: Australia and New Zealand Certificate Authority Market Volume Share (%), by Organization Size 2025 & 2033
- Figure 59: Australia and New Zealand Certificate Authority Market Revenue (Million), by End-user Vertical 2025 & 2033
- Figure 60: Australia and New Zealand Certificate Authority Market Volume (K Unit), by End-user Vertical 2025 & 2033
- Figure 61: Australia and New Zealand Certificate Authority Market Revenue Share (%), by End-user Vertical 2025 & 2033
- Figure 62: Australia and New Zealand Certificate Authority Market Volume Share (%), by End-user Vertical 2025 & 2033
- Figure 63: Australia and New Zealand Certificate Authority Market Revenue (Million), by Country 2025 & 2033
- Figure 64: Australia and New Zealand Certificate Authority Market Volume (K Unit), by Country 2025 & 2033
- Figure 65: Australia and New Zealand Certificate Authority Market Revenue Share (%), by Country 2025 & 2033
- Figure 66: Australia and New Zealand Certificate Authority Market Volume Share (%), by Country 2025 & 2033
- Figure 67: Latin America Certificate Authority Market Revenue (Million), by Component 2025 & 2033
- Figure 68: Latin America Certificate Authority Market Volume (K Unit), by Component 2025 & 2033
- Figure 69: Latin America Certificate Authority Market Revenue Share (%), by Component 2025 & 2033
- Figure 70: Latin America Certificate Authority Market Volume Share (%), by Component 2025 & 2033
- Figure 71: Latin America Certificate Authority Market Revenue (Million), by Organization Size 2025 & 2033
- Figure 72: Latin America Certificate Authority Market Volume (K Unit), by Organization Size 2025 & 2033
- Figure 73: Latin America Certificate Authority Market Revenue Share (%), by Organization Size 2025 & 2033
- Figure 74: Latin America Certificate Authority Market Volume Share (%), by Organization Size 2025 & 2033
- Figure 75: Latin America Certificate Authority Market Revenue (Million), by End-user Vertical 2025 & 2033
- Figure 76: Latin America Certificate Authority Market Volume (K Unit), by End-user Vertical 2025 & 2033
- Figure 77: Latin America Certificate Authority Market Revenue Share (%), by End-user Vertical 2025 & 2033
- Figure 78: Latin America Certificate Authority Market Volume Share (%), by End-user Vertical 2025 & 2033
- Figure 79: Latin America Certificate Authority Market Revenue (Million), by Country 2025 & 2033
- Figure 80: Latin America Certificate Authority Market Volume (K Unit), by Country 2025 & 2033
- Figure 81: Latin America Certificate Authority Market Revenue Share (%), by Country 2025 & 2033
- Figure 82: Latin America Certificate Authority Market Volume Share (%), by Country 2025 & 2033
- Figure 83: Middle East and Africa Certificate Authority Market Revenue (Million), by Component 2025 & 2033
- Figure 84: Middle East and Africa Certificate Authority Market Volume (K Unit), by Component 2025 & 2033
- Figure 85: Middle East and Africa Certificate Authority Market Revenue Share (%), by Component 2025 & 2033
- Figure 86: Middle East and Africa Certificate Authority Market Volume Share (%), by Component 2025 & 2033
- Figure 87: Middle East and Africa Certificate Authority Market Revenue (Million), by Organization Size 2025 & 2033
- Figure 88: Middle East and Africa Certificate Authority Market Volume (K Unit), by Organization Size 2025 & 2033
- Figure 89: Middle East and Africa Certificate Authority Market Revenue Share (%), by Organization Size 2025 & 2033
- Figure 90: Middle East and Africa Certificate Authority Market Volume Share (%), by Organization Size 2025 & 2033
- Figure 91: Middle East and Africa Certificate Authority Market Revenue (Million), by End-user Vertical 2025 & 2033
- Figure 92: Middle East and Africa Certificate Authority Market Volume (K Unit), by End-user Vertical 2025 & 2033
- Figure 93: Middle East and Africa Certificate Authority Market Revenue Share (%), by End-user Vertical 2025 & 2033
- Figure 94: Middle East and Africa Certificate Authority Market Volume Share (%), by End-user Vertical 2025 & 2033
- Figure 95: Middle East and Africa Certificate Authority Market Revenue (Million), by Country 2025 & 2033
- Figure 96: Middle East and Africa Certificate Authority Market Volume (K Unit), by Country 2025 & 2033
- Figure 97: Middle East and Africa Certificate Authority Market Revenue Share (%), by Country 2025 & 2033
- Figure 98: Middle East and Africa Certificate Authority Market Volume Share (%), by Country 2025 & 2033
List of Tables
- Table 1: Global Certificate Authority Market Revenue Million Forecast, by Component 2020 & 2033
- Table 2: Global Certificate Authority Market Volume K Unit Forecast, by Component 2020 & 2033
- Table 3: Global Certificate Authority Market Revenue Million Forecast, by Organization Size 2020 & 2033
- Table 4: Global Certificate Authority Market Volume K Unit Forecast, by Organization Size 2020 & 2033
- Table 5: Global Certificate Authority Market Revenue Million Forecast, by End-user Vertical 2020 & 2033
- Table 6: Global Certificate Authority Market Volume K Unit Forecast, by End-user Vertical 2020 & 2033
- Table 7: Global Certificate Authority Market Revenue Million Forecast, by Region 2020 & 2033
- Table 8: Global Certificate Authority Market Volume K Unit Forecast, by Region 2020 & 2033
- Table 9: Global Certificate Authority Market Revenue Million Forecast, by Component 2020 & 2033
- Table 10: Global Certificate Authority Market Volume K Unit Forecast, by Component 2020 & 2033
- Table 11: Global Certificate Authority Market Revenue Million Forecast, by Organization Size 2020 & 2033
- Table 12: Global Certificate Authority Market Volume K Unit Forecast, by Organization Size 2020 & 2033
- Table 13: Global Certificate Authority Market Revenue Million Forecast, by End-user Vertical 2020 & 2033
- Table 14: Global Certificate Authority Market Volume K Unit Forecast, by End-user Vertical 2020 & 2033
- Table 15: Global Certificate Authority Market Revenue Million Forecast, by Country 2020 & 2033
- Table 16: Global Certificate Authority Market Volume K Unit Forecast, by Country 2020 & 2033
- Table 17: Global Certificate Authority Market Revenue Million Forecast, by Component 2020 & 2033
- Table 18: Global Certificate Authority Market Volume K Unit Forecast, by Component 2020 & 2033
- Table 19: Global Certificate Authority Market Revenue Million Forecast, by Organization Size 2020 & 2033
- Table 20: Global Certificate Authority Market Volume K Unit Forecast, by Organization Size 2020 & 2033
- Table 21: Global Certificate Authority Market Revenue Million Forecast, by End-user Vertical 2020 & 2033
- Table 22: Global Certificate Authority Market Volume K Unit Forecast, by End-user Vertical 2020 & 2033
- Table 23: Global Certificate Authority Market Revenue Million Forecast, by Country 2020 & 2033
- Table 24: Global Certificate Authority Market Volume K Unit Forecast, by Country 2020 & 2033
- Table 25: Global Certificate Authority Market Revenue Million Forecast, by Component 2020 & 2033
- Table 26: Global Certificate Authority Market Volume K Unit Forecast, by Component 2020 & 2033
- Table 27: Global Certificate Authority Market Revenue Million Forecast, by Organization Size 2020 & 2033
- Table 28: Global Certificate Authority Market Volume K Unit Forecast, by Organization Size 2020 & 2033
- Table 29: Global Certificate Authority Market Revenue Million Forecast, by End-user Vertical 2020 & 2033
- Table 30: Global Certificate Authority Market Volume K Unit Forecast, by End-user Vertical 2020 & 2033
- Table 31: Global Certificate Authority Market Revenue Million Forecast, by Country 2020 & 2033
- Table 32: Global Certificate Authority Market Volume K Unit Forecast, by Country 2020 & 2033
- Table 33: Global Certificate Authority Market Revenue Million Forecast, by Component 2020 & 2033
- Table 34: Global Certificate Authority Market Volume K Unit Forecast, by Component 2020 & 2033
- Table 35: Global Certificate Authority Market Revenue Million Forecast, by Organization Size 2020 & 2033
- Table 36: Global Certificate Authority Market Volume K Unit Forecast, by Organization Size 2020 & 2033
- Table 37: Global Certificate Authority Market Revenue Million Forecast, by End-user Vertical 2020 & 2033
- Table 38: Global Certificate Authority Market Volume K Unit Forecast, by End-user Vertical 2020 & 2033
- Table 39: Global Certificate Authority Market Revenue Million Forecast, by Country 2020 & 2033
- Table 40: Global Certificate Authority Market Volume K Unit Forecast, by Country 2020 & 2033
- Table 41: Global Certificate Authority Market Revenue Million Forecast, by Component 2020 & 2033
- Table 42: Global Certificate Authority Market Volume K Unit Forecast, by Component 2020 & 2033
- Table 43: Global Certificate Authority Market Revenue Million Forecast, by Organization Size 2020 & 2033
- Table 44: Global Certificate Authority Market Volume K Unit Forecast, by Organization Size 2020 & 2033
- Table 45: Global Certificate Authority Market Revenue Million Forecast, by End-user Vertical 2020 & 2033
- Table 46: Global Certificate Authority Market Volume K Unit Forecast, by End-user Vertical 2020 & 2033
- Table 47: Global Certificate Authority Market Revenue Million Forecast, by Country 2020 & 2033
- Table 48: Global Certificate Authority Market Volume K Unit Forecast, by Country 2020 & 2033
- Table 49: Global Certificate Authority Market Revenue Million Forecast, by Component 2020 & 2033
- Table 50: Global Certificate Authority Market Volume K Unit Forecast, by Component 2020 & 2033
- Table 51: Global Certificate Authority Market Revenue Million Forecast, by Organization Size 2020 & 2033
- Table 52: Global Certificate Authority Market Volume K Unit Forecast, by Organization Size 2020 & 2033
- Table 53: Global Certificate Authority Market Revenue Million Forecast, by End-user Vertical 2020 & 2033
- Table 54: Global Certificate Authority Market Volume K Unit Forecast, by End-user Vertical 2020 & 2033
- Table 55: Global Certificate Authority Market Revenue Million Forecast, by Country 2020 & 2033
- Table 56: Global Certificate Authority Market Volume K Unit Forecast, by Country 2020 & 2033
Frequently Asked Questions
1. What is the projected Compound Annual Growth Rate (CAGR) of the Certificate Authority Market?
The projected CAGR is approximately 11.18%.
2. Which companies are prominent players in the Certificate Authority Market?
Key companies in the market include Sectigo Limited, Swisssign AG (Swiss Post), Zerossl GMBH (HID, Network Solutions LLC, GoDaddy Inc, Trustwave Holdings Inc (Chertoff Group), GlobalSign, Actalis S p A, Camerfirma SA, WISeKey International Holdings Ltd, DigiCert Inc, OneSpan Inc, Asseco Data Systems SA (Asseco Poland SA), Buypass AS, Entrust Corporation, SSL Com.
3. What are the main segments of the Certificate Authority Market?
The market segments include Component, Organization Size, End-user Vertical.
4. Can you provide details about the market size?
The market size is estimated to be USD 187.70 Million as of 2022.
5. What are some drivers contributing to market growth?
Growing Awareness Among Internet Users About Secure Web Access; Managing Strict Regulations and Compliance.
6. What are the notable trends driving market growth?
BFSI Sector to be the Largest End-user Industry.
7. Are there any restraints impacting market growth?
Lack of Awareness About the Importance of Security Certificates; Using of Self-Signed Certificates.
8. Can you provide examples of recent developments in the market?
February 2024 - The availability of an issuer for the Kubernetes cert-manager was confirmed by GlobalSign, Inc., a global Certificate Authority providing identity security, digital signature, and Internet of Things solutions. Made from an integration from GMO GlobalSign's certificate management platform, Atlas, the new Issuer enables cert-manager users to quickly obtain trusted TLS (X.509) certificates, improving the security of Kubernetes workflows. With over 5 million daily downloads, the open-source enterprise tool simplifies the certificate issuance and management process in Kubernetes.
9. What pricing options are available for accessing the report?
Pricing options include single-user, multi-user, and enterprise licenses priced at USD 4750, USD 5250, and USD 8750 respectively.
10. Is the market size provided in terms of value or volume?
The market size is provided in terms of value, measured in Million and volume, measured in K Unit.
11. Are there any specific market keywords associated with the report?
Yes, the market keyword associated with the report is "Certificate Authority Market," which aids in identifying and referencing the specific market segment covered.
12. How do I determine which pricing option suits my needs best?
The pricing options vary based on user requirements and access needs. Individual users may opt for single-user licenses, while businesses requiring broader access may choose multi-user or enterprise licenses for cost-effective access to the report.
13. Are there any additional resources or data provided in the Certificate Authority Market report?
While the report offers comprehensive insights, it's advisable to review the specific contents or supplementary materials provided to ascertain if additional resources or data are available.
14. How can I stay updated on further developments or reports in the Certificate Authority Market?
To stay informed about further developments, trends, and reports in the Certificate Authority Market, consider subscribing to industry newsletters, following relevant companies and organizations, or regularly checking reputable industry news sources and publications.
Methodology
Step 1 - Identification of Relevant Samples Size from Population Database


Step 2 - Approaches for Defining Global Market Size (Value, Volume* & Price*)

Note*: In applicable scenarios
Step 3 - Data Sources
Primary Research
- Web Analytics
- Survey Reports
- Research Institute
- Latest Research Reports
- Opinion Leaders
Secondary Research
- Annual Reports
- White Paper
- Latest Press Release
- Industry Association
- Paid Database
- Investor Presentations

Step 4 - Data Triangulation
Involves using different sources of information in order to increase the validity of a study
These sources are likely to be stakeholders in a program - participants, other researchers, program staff, other community members, and so on.
Then we put all data in single framework & apply various statistical tools to find out the dynamic on the market.
During the analysis stage, feedback from the stakeholder groups would be compared to determine areas of agreement as well as areas of divergence