

Key Insights
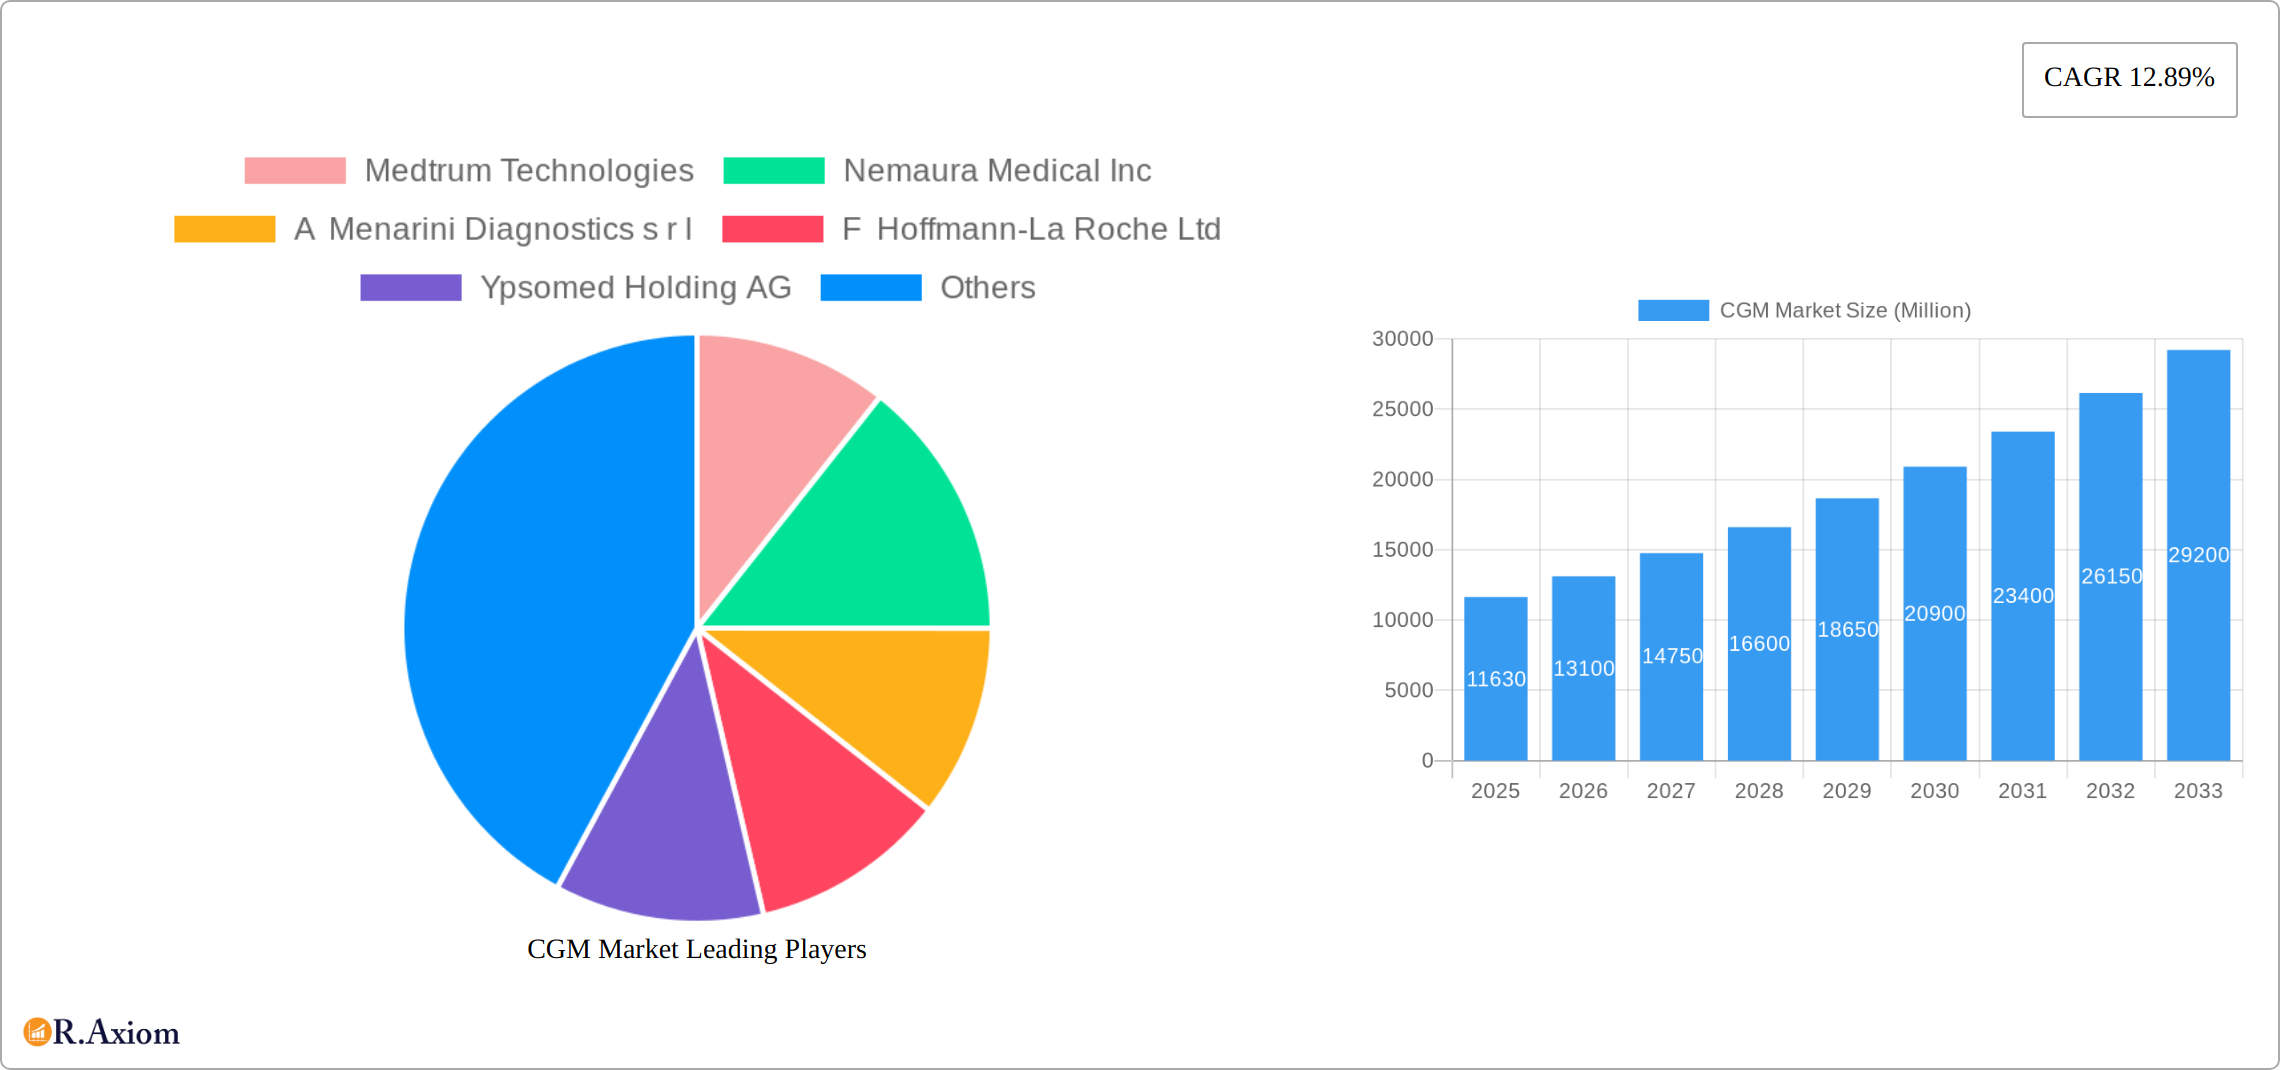
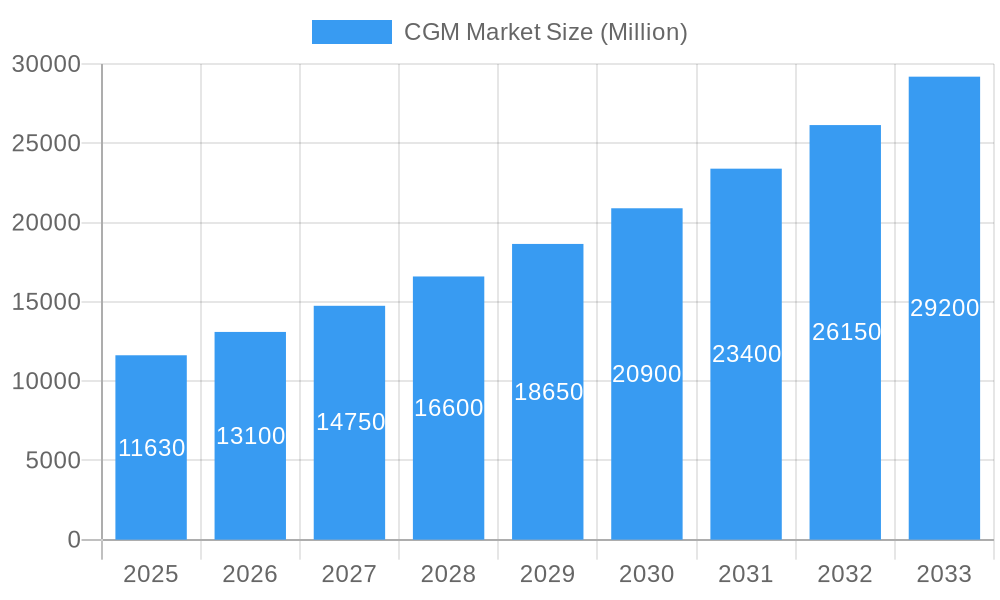
The Continuous Glucose Monitoring (CGM) market is experiencing robust growth, projected to reach \$11.63 billion in 2025 and maintain a Compound Annual Growth Rate (CAGR) of 12.89% from 2025 to 2033. This expansion is driven by several key factors. The increasing prevalence of diabetes globally, coupled with the rising awareness of the benefits of CGM technology for better diabetes management, fuels market demand. Patients and healthcare providers increasingly value the real-time glucose data provided by CGMs, enabling proactive interventions and improved glycemic control, leading to fewer complications and improved quality of life. Technological advancements, such as smaller, more comfortable sensor designs and improved accuracy, further enhance market appeal. The expanding availability of reimbursement coverage for CGM systems in various healthcare systems also contributes significantly to market growth. The market segmentation reflects the diverse technological components and end-user applications, with sensors, durable components (receivers and transmitters), and applications across hospital/home and personal/home settings driving varied market segments.
CGM Market Market Size (In Billion)
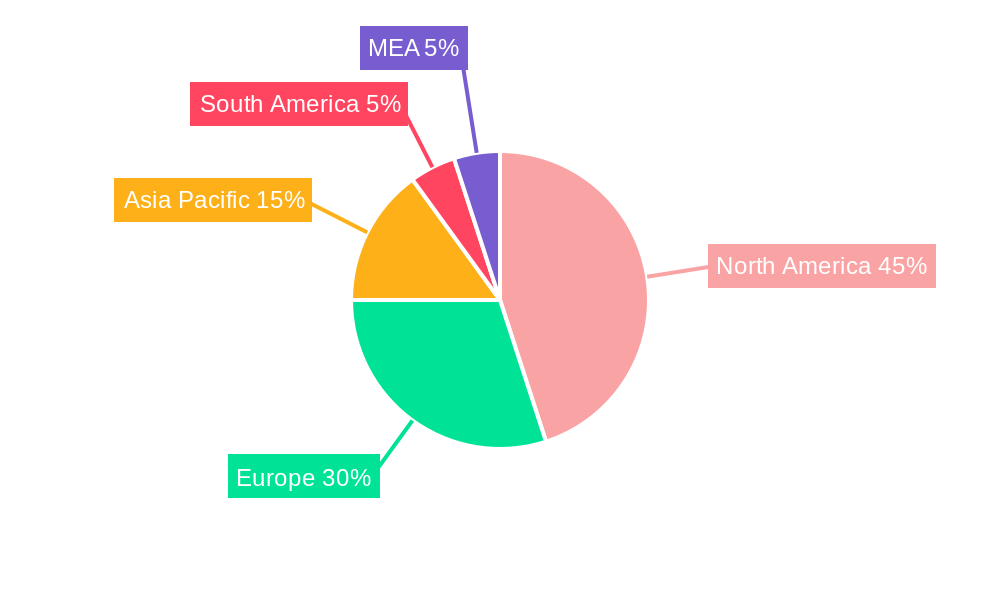
Competition within the CGM market is intense, with established players like Medtronic, Abbott, and Dexcom competing alongside emerging companies like Medtrum Technologies and Nemaura Medical. The geographic distribution of the market reveals significant regional variations. North America and Europe currently hold substantial market shares, attributed to higher diabetes prevalence, advanced healthcare infrastructure, and greater adoption of advanced technologies. However, the Asia-Pacific region is demonstrating rapid growth potential, fueled by increasing diabetes diagnosis rates and rising disposable incomes, making it a key region for future market expansion. The diverse landscape of manufacturers, technological innovations, and varying adoption rates across regions promise a dynamic and evolving CGM market with substantial opportunities for growth in the coming years.
CGM Market Company Market Share
This in-depth report provides a comprehensive analysis of the Continuous Glucose Monitoring (CGM) market, encompassing historical data (2019-2024), current estimations (2025), and future projections (2025-2033). It delves into market dynamics, key players, technological advancements, and emerging opportunities, offering valuable insights for stakeholders across the industry. The report covers a market valued at xx Million in 2025, projected to reach xx Million by 2033, exhibiting a CAGR of xx%.
CGM Market Concentration & Innovation
The CGM market exhibits a moderately concentrated landscape, with key players like Dexcom Inc., Medtronic PLC, and Abbott holding significant market share. However, the market is also characterized by continuous innovation, driven by the increasing prevalence of diabetes and advancements in sensor technology. Several factors contribute to this dynamic environment:
- Market Share: Dexcom, Medtronic, and Abbott collectively account for approximately xx% of the global market share in 2025. Smaller players like Senseonics Holdings Inc. and Medtrum Technologies are aggressively pursuing market penetration.
- Innovation Drivers: Miniaturization, improved accuracy, longer sensor lifespan, and integration with smart devices are key innovation drivers. The development of integrated CGM (iCGM) systems, like Dexcom's Stelo, is reshaping the market landscape.
- Regulatory Frameworks: Stringent regulatory approvals in key markets (e.g., FDA approval in the US, CE marking in Europe) influence product development and market entry strategies.
- Product Substitutes: Traditional blood glucose meters still hold a share of the market, but CGM systems are rapidly gaining preference due to their convenience and real-time data.
- End-User Trends: Growing awareness of diabetes management and the rising adoption of telehealth are fueling demand for CGM systems among both hospital and home users.
- M&A Activities: The CGM market has witnessed significant M&A activity in recent years, with deal values totaling xx Million in the period 2019-2024. These activities reflect the consolidation trend and efforts to enhance product portfolios and expand market reach.
CGM Market Industry Trends & Insights
The CGM market is experiencing robust growth, driven by a confluence of factors. The soaring global prevalence of diabetes, especially type 1 and type 2, is a major catalyst. This is amplified by rising patient awareness of effective blood glucose monitoring for optimal disease management. Significant technological advancements, including the development of more precise, user-friendly, and affordable CGMs, are fueling market expansion. Consumer preference is shifting decisively towards minimally invasive, wearable devices seamlessly integrating with smartphones and comprehensive health management platforms. The competitive landscape is dynamic, with established players prioritizing innovation and new product launches, while emerging companies focus on market differentiation and niche applications. This healthy competition benefits consumers through continuous improvements in product features and pricing. The market is poised for sustained growth throughout the forecast period, with significant increases in market penetration across diverse geographical regions. Furthermore, the increasing focus on preventative healthcare and personalized medicine is further bolstering market growth.
Dominant Markets & Segments in CGM Market
North America currently leads the CGM market, fueled by high diabetes prevalence, a sophisticated healthcare infrastructure, and early adoption of advanced medical technologies. Within this market, the home/personal use segment demonstrates the most substantial growth, reflecting a strong patient preference for convenient self-managed diabetes monitoring. This trend is expected to continue, driven by increasing access to technology and a growing emphasis on patient empowerment.
- Leading Region: North America continues its dominance, propelled by high diabetes prevalence, a robust healthcare infrastructure, and favorable reimbursement policies that ensure wider access to CGM technology.
- Leading Country: The United States maintains the largest market share within North America due to its high diabetes prevalence and comprehensive insurance coverage facilitating CGM adoption.
- Dominant Component Segment: Sensors remain the largest segment, as they are the essential components of CGM systems. This segment's growth directly correlates with the rising demand for CGM devices and reflects the ongoing technological advancements in sensor miniaturization and accuracy.
- Dominant End-User Segment: The home/personal use segment is projected to maintain its dominance throughout the forecast period, driven by the increasing patient preference for self-monitoring, enhanced convenience, and the integration of CGM data into personal health management systems.
CGM Market Product Developments
Recent CGM product innovations are focused on several key areas: significantly improving accuracy, extending sensor lifespan, enhancing usability and comfort, and seamless integration with advanced digital health platforms. The emergence of integrated CGM systems eliminating the need for finger-prick calibration is gaining significant traction, addressing patient demand for less invasive and more convenient monitoring. These advancements directly translate to improved treatment adherence and better patient outcomes. The market trend clearly favors smaller, more comfortable, and intuitive devices that empower patients to actively manage their health.
Report Scope & Segmentation Analysis
This report segments the CGM market based on component (sensors, durables - receivers and transmitters) and end-user (hospital/home, home/personal). The sensor segment is projected to witness significant growth due to increased CGM adoption. The durables segment, including receivers and transmitters, will experience moderate growth driven by the life cycle of the devices. In the end-user segment, the home/personal use segment is expected to dominate, reflecting a growing preference for self-monitoring. Each segment’s growth is influenced by factors like technological advancements, pricing strategies, and patient preferences. Competitive dynamics within each segment vary depending on the presence and market share of key players.
Key Drivers of CGM Market Growth
The CGM market's growth is propelled by several converging factors. The escalating prevalence of diabetes worldwide is a primary driver, coupled with advancements in sensor technology resulting in improved accuracy, extended wear times, and smaller, more discreet form factors. Favorable reimbursement policies in many countries are increasing CGM accessibility for patients. The integration of CGM data with other digital health platforms and the growing emphasis on proactive diabetes management and preventative care are further contributing to substantial market expansion. The increasing availability of telehealth services also plays a significant role in enabling remote monitoring and improving patient access to care.
Challenges in the CGM Market Sector
The CGM market faces challenges, including stringent regulatory requirements for approval, high manufacturing costs that impact device pricing, and the potential for sensor inaccuracies. The fluctuating prices of raw materials can create supply chain disruptions impacting production. Furthermore, intense competition among established and emerging players poses a challenge for maintaining profitability and securing market share. These factors collectively contribute to complexities in market penetration and growth.
Emerging Opportunities in CGM Market
Emerging opportunities in the CGM market include the expansion into underserved markets, the development of integrated CGM systems with advanced analytics capabilities, and the growing potential for CGM use beyond diabetes management. For instance, monitoring glucose levels in athletes or individuals with prediabetes offers significant market expansion potential. The incorporation of artificial intelligence for improved data interpretation and personalized treatment recommendations presents another significant opportunity.
Leading Players in the CGM Market
- Medtrum Technologies
- Nemaura Medical Inc
- A Menarini Diagnostics s r l
- F Hoffmann-La Roche Ltd
- Ypsomed Holding AG
- Senseonics Holdings Inc
- Dexcom Inc
- Medtronic PLC
- Abbott
- i-Sens Inc
Key Developments in CGM Market Industry
- May 2023: Dexcom showcased its G6 CGM at the 66th Annual Meeting of the Japan Diabetes Society, highlighting its real-time glucose data capabilities and reduced reliance on finger-prick testing. This increased brand awareness and market penetration in Japan.
- March 2024: The Dexcom Stelo Glucose Biosensor System received FDA marketing clearance. This integrated CGM system expands the potential market to include individuals aged 18+ who don't require insulin, significantly boosting market potential.
Strategic Outlook for CGM Market
The CGM market is poised for continued growth, driven by increasing diabetes prevalence, technological advancements, and expanding applications. Future opportunities lie in integrating CGM data with other health metrics, developing advanced analytical capabilities for personalized treatment, and exploring new applications beyond diabetes management. The strategic focus for players should be on continuous innovation, expanding global reach, and strengthening partnerships to solidify market position and capture emerging opportunities.
CGM Market Segmentation
-
1. Component
- 1.1. Sensors
- 1.2. Durables(Receivers and Transmitters)
-
2. End User
- 2.1. Hospital/Clinics
- 2.2. Home/Personal
CGM Market Segmentation By Geography
-
1. North America
- 1.1. United States
- 1.2. Canada
- 1.3. Rest of North America
-
2. Europe
- 2.1. France
- 2.2. Germany
- 2.3. Italy
- 2.4. Spain
- 2.5. United Kingdom
- 2.6. Russia
- 2.7. Rest of Europe
-
3. Latin America
- 3.1. Mexico
- 3.2. Brazil
- 3.3. Rest of Latin America
-
4. Asia Pacific
- 4.1. Japan
- 4.2. South Korea
- 4.3. China
- 4.4. India
- 4.5. Australia
- 4.6. Vietnam
- 4.7. Malaysia
- 4.8. Indonesia
- 4.9. Philippines
- 4.10. Thailand
- 4.11. Rest of Asia Pacific
-
5. Middle East and Africa
- 5.1. Saudi Arabia
- 5.2. Iran
- 5.3. Egypt
- 5.4. Oman
- 5.5. South Africa
- 5.6. Rest of Middle East and Africa
CGM Market Regional Market Share
Geographic Coverage of CGM Market
CGM Market REPORT HIGHLIGHTS
| Aspects | Details |
|---|---|
| Study Period | 2020-2034 |
| Base Year | 2025 |
| Estimated Year | 2026 |
| Forecast Period | 2026-2034 |
| Historical Period | 2020-2025 |
| Growth Rate | CAGR of 12.89% from 2020-2034 |
| Segmentation |
|
Table of Contents
- 1. Introduction
- 1.1. Research Scope
- 1.2. Market Segmentation
- 1.3. Research Methodology
- 1.4. Definitions and Assumptions
- 2. Executive Summary
- 2.1. Introduction
- 3. Market Dynamics
- 3.1. Introduction
- 3.2. Market Drivers
- 3.2.1. Growing Burden of Gastrointestinal Diseases; Rising Preference of Point of Care Test
- 3.3. Market Restrains
- 3.3.1. High Cost of Instruments
- 3.4. Market Trends
- 3.4.1. The Sensors Segment is Expected to Hold a Major Market Share Over the Forecast Period
- 4. Market Factor Analysis
- 4.1. Porters Five Forces
- 4.2. Supply/Value Chain
- 4.3. PESTEL analysis
- 4.4. Market Entropy
- 4.5. Patent/Trademark Analysis
- 5. Global CGM Market Analysis, Insights and Forecast, 2020-2032
- 5.1. Market Analysis, Insights and Forecast - by Component
- 5.1.1. Sensors
- 5.1.2. Durables(Receivers and Transmitters)
- 5.2. Market Analysis, Insights and Forecast - by End User
- 5.2.1. Hospital/Clinics
- 5.2.2. Home/Personal
- 5.3. Market Analysis, Insights and Forecast - by Region
- 5.3.1. North America
- 5.3.2. Europe
- 5.3.3. Latin America
- 5.3.4. Asia Pacific
- 5.3.5. Middle East and Africa
- 5.1. Market Analysis, Insights and Forecast - by Component
- 6. North America CGM Market Analysis, Insights and Forecast, 2020-2032
- 6.1. Market Analysis, Insights and Forecast - by Component
- 6.1.1. Sensors
- 6.1.2. Durables(Receivers and Transmitters)
- 6.2. Market Analysis, Insights and Forecast - by End User
- 6.2.1. Hospital/Clinics
- 6.2.2. Home/Personal
- 6.1. Market Analysis, Insights and Forecast - by Component
- 7. Europe CGM Market Analysis, Insights and Forecast, 2020-2032
- 7.1. Market Analysis, Insights and Forecast - by Component
- 7.1.1. Sensors
- 7.1.2. Durables(Receivers and Transmitters)
- 7.2. Market Analysis, Insights and Forecast - by End User
- 7.2.1. Hospital/Clinics
- 7.2.2. Home/Personal
- 7.1. Market Analysis, Insights and Forecast - by Component
- 8. Latin America CGM Market Analysis, Insights and Forecast, 2020-2032
- 8.1. Market Analysis, Insights and Forecast - by Component
- 8.1.1. Sensors
- 8.1.2. Durables(Receivers and Transmitters)
- 8.2. Market Analysis, Insights and Forecast - by End User
- 8.2.1. Hospital/Clinics
- 8.2.2. Home/Personal
- 8.1. Market Analysis, Insights and Forecast - by Component
- 9. Asia Pacific CGM Market Analysis, Insights and Forecast, 2020-2032
- 9.1. Market Analysis, Insights and Forecast - by Component
- 9.1.1. Sensors
- 9.1.2. Durables(Receivers and Transmitters)
- 9.2. Market Analysis, Insights and Forecast - by End User
- 9.2.1. Hospital/Clinics
- 9.2.2. Home/Personal
- 9.1. Market Analysis, Insights and Forecast - by Component
- 10. Middle East and Africa CGM Market Analysis, Insights and Forecast, 2020-2032
- 10.1. Market Analysis, Insights and Forecast - by Component
- 10.1.1. Sensors
- 10.1.2. Durables(Receivers and Transmitters)
- 10.2. Market Analysis, Insights and Forecast - by End User
- 10.2.1. Hospital/Clinics
- 10.2.2. Home/Personal
- 10.1. Market Analysis, Insights and Forecast - by Component
- 11. Competitive Analysis
- 11.1. Global Market Share Analysis 2025
- 11.2. Company Profiles
- 11.2.1 Medtrum Technologies
- 11.2.1.1. Overview
- 11.2.1.2. Products
- 11.2.1.3. SWOT Analysis
- 11.2.1.4. Recent Developments
- 11.2.1.5. Financials (Based on Availability)
- 11.2.2 Nemaura Medical Inc
- 11.2.2.1. Overview
- 11.2.2.2. Products
- 11.2.2.3. SWOT Analysis
- 11.2.2.4. Recent Developments
- 11.2.2.5. Financials (Based on Availability)
- 11.2.3 A Menarini Diagnostics s r l
- 11.2.3.1. Overview
- 11.2.3.2. Products
- 11.2.3.3. SWOT Analysis
- 11.2.3.4. Recent Developments
- 11.2.3.5. Financials (Based on Availability)
- 11.2.4 F Hoffmann-La Roche Ltd
- 11.2.4.1. Overview
- 11.2.4.2. Products
- 11.2.4.3. SWOT Analysis
- 11.2.4.4. Recent Developments
- 11.2.4.5. Financials (Based on Availability)
- 11.2.5 Ypsomed Holding AG
- 11.2.5.1. Overview
- 11.2.5.2. Products
- 11.2.5.3. SWOT Analysis
- 11.2.5.4. Recent Developments
- 11.2.5.5. Financials (Based on Availability)
- 11.2.6 Senseonics Holdings Inc
- 11.2.6.1. Overview
- 11.2.6.2. Products
- 11.2.6.3. SWOT Analysis
- 11.2.6.4. Recent Developments
- 11.2.6.5. Financials (Based on Availability)
- 11.2.7 Dexcom Inc
- 11.2.7.1. Overview
- 11.2.7.2. Products
- 11.2.7.3. SWOT Analysis
- 11.2.7.4. Recent Developments
- 11.2.7.5. Financials (Based on Availability)
- 11.2.8 Medtronic PLC
- 11.2.8.1. Overview
- 11.2.8.2. Products
- 11.2.8.3. SWOT Analysis
- 11.2.8.4. Recent Developments
- 11.2.8.5. Financials (Based on Availability)
- 11.2.9 Abbott
- 11.2.9.1. Overview
- 11.2.9.2. Products
- 11.2.9.3. SWOT Analysis
- 11.2.9.4. Recent Developments
- 11.2.9.5. Financials (Based on Availability)
- 11.2.10 i-Sens Inc
- 11.2.10.1. Overview
- 11.2.10.2. Products
- 11.2.10.3. SWOT Analysis
- 11.2.10.4. Recent Developments
- 11.2.10.5. Financials (Based on Availability)
- 11.2.1 Medtrum Technologies
List of Figures
- Figure 1: Global CGM Market Revenue Breakdown (Million, %) by Region 2025 & 2033
- Figure 2: Global CGM Market Volume Breakdown (K Unit, %) by Region 2025 & 2033
- Figure 3: North America CGM Market Revenue (Million), by Component 2025 & 2033
- Figure 4: North America CGM Market Volume (K Unit), by Component 2025 & 2033
- Figure 5: North America CGM Market Revenue Share (%), by Component 2025 & 2033
- Figure 6: North America CGM Market Volume Share (%), by Component 2025 & 2033
- Figure 7: North America CGM Market Revenue (Million), by End User 2025 & 2033
- Figure 8: North America CGM Market Volume (K Unit), by End User 2025 & 2033
- Figure 9: North America CGM Market Revenue Share (%), by End User 2025 & 2033
- Figure 10: North America CGM Market Volume Share (%), by End User 2025 & 2033
- Figure 11: North America CGM Market Revenue (Million), by Country 2025 & 2033
- Figure 12: North America CGM Market Volume (K Unit), by Country 2025 & 2033
- Figure 13: North America CGM Market Revenue Share (%), by Country 2025 & 2033
- Figure 14: North America CGM Market Volume Share (%), by Country 2025 & 2033
- Figure 15: Europe CGM Market Revenue (Million), by Component 2025 & 2033
- Figure 16: Europe CGM Market Volume (K Unit), by Component 2025 & 2033
- Figure 17: Europe CGM Market Revenue Share (%), by Component 2025 & 2033
- Figure 18: Europe CGM Market Volume Share (%), by Component 2025 & 2033
- Figure 19: Europe CGM Market Revenue (Million), by End User 2025 & 2033
- Figure 20: Europe CGM Market Volume (K Unit), by End User 2025 & 2033
- Figure 21: Europe CGM Market Revenue Share (%), by End User 2025 & 2033
- Figure 22: Europe CGM Market Volume Share (%), by End User 2025 & 2033
- Figure 23: Europe CGM Market Revenue (Million), by Country 2025 & 2033
- Figure 24: Europe CGM Market Volume (K Unit), by Country 2025 & 2033
- Figure 25: Europe CGM Market Revenue Share (%), by Country 2025 & 2033
- Figure 26: Europe CGM Market Volume Share (%), by Country 2025 & 2033
- Figure 27: Latin America CGM Market Revenue (Million), by Component 2025 & 2033
- Figure 28: Latin America CGM Market Volume (K Unit), by Component 2025 & 2033
- Figure 29: Latin America CGM Market Revenue Share (%), by Component 2025 & 2033
- Figure 30: Latin America CGM Market Volume Share (%), by Component 2025 & 2033
- Figure 31: Latin America CGM Market Revenue (Million), by End User 2025 & 2033
- Figure 32: Latin America CGM Market Volume (K Unit), by End User 2025 & 2033
- Figure 33: Latin America CGM Market Revenue Share (%), by End User 2025 & 2033
- Figure 34: Latin America CGM Market Volume Share (%), by End User 2025 & 2033
- Figure 35: Latin America CGM Market Revenue (Million), by Country 2025 & 2033
- Figure 36: Latin America CGM Market Volume (K Unit), by Country 2025 & 2033
- Figure 37: Latin America CGM Market Revenue Share (%), by Country 2025 & 2033
- Figure 38: Latin America CGM Market Volume Share (%), by Country 2025 & 2033
- Figure 39: Asia Pacific CGM Market Revenue (Million), by Component 2025 & 2033
- Figure 40: Asia Pacific CGM Market Volume (K Unit), by Component 2025 & 2033
- Figure 41: Asia Pacific CGM Market Revenue Share (%), by Component 2025 & 2033
- Figure 42: Asia Pacific CGM Market Volume Share (%), by Component 2025 & 2033
- Figure 43: Asia Pacific CGM Market Revenue (Million), by End User 2025 & 2033
- Figure 44: Asia Pacific CGM Market Volume (K Unit), by End User 2025 & 2033
- Figure 45: Asia Pacific CGM Market Revenue Share (%), by End User 2025 & 2033
- Figure 46: Asia Pacific CGM Market Volume Share (%), by End User 2025 & 2033
- Figure 47: Asia Pacific CGM Market Revenue (Million), by Country 2025 & 2033
- Figure 48: Asia Pacific CGM Market Volume (K Unit), by Country 2025 & 2033
- Figure 49: Asia Pacific CGM Market Revenue Share (%), by Country 2025 & 2033
- Figure 50: Asia Pacific CGM Market Volume Share (%), by Country 2025 & 2033
- Figure 51: Middle East and Africa CGM Market Revenue (Million), by Component 2025 & 2033
- Figure 52: Middle East and Africa CGM Market Volume (K Unit), by Component 2025 & 2033
- Figure 53: Middle East and Africa CGM Market Revenue Share (%), by Component 2025 & 2033
- Figure 54: Middle East and Africa CGM Market Volume Share (%), by Component 2025 & 2033
- Figure 55: Middle East and Africa CGM Market Revenue (Million), by End User 2025 & 2033
- Figure 56: Middle East and Africa CGM Market Volume (K Unit), by End User 2025 & 2033
- Figure 57: Middle East and Africa CGM Market Revenue Share (%), by End User 2025 & 2033
- Figure 58: Middle East and Africa CGM Market Volume Share (%), by End User 2025 & 2033
- Figure 59: Middle East and Africa CGM Market Revenue (Million), by Country 2025 & 2033
- Figure 60: Middle East and Africa CGM Market Volume (K Unit), by Country 2025 & 2033
- Figure 61: Middle East and Africa CGM Market Revenue Share (%), by Country 2025 & 2033
- Figure 62: Middle East and Africa CGM Market Volume Share (%), by Country 2025 & 2033
List of Tables
- Table 1: Global CGM Market Revenue Million Forecast, by Component 2020 & 2033
- Table 2: Global CGM Market Volume K Unit Forecast, by Component 2020 & 2033
- Table 3: Global CGM Market Revenue Million Forecast, by End User 2020 & 2033
- Table 4: Global CGM Market Volume K Unit Forecast, by End User 2020 & 2033
- Table 5: Global CGM Market Revenue Million Forecast, by Region 2020 & 2033
- Table 6: Global CGM Market Volume K Unit Forecast, by Region 2020 & 2033
- Table 7: Global CGM Market Revenue Million Forecast, by Component 2020 & 2033
- Table 8: Global CGM Market Volume K Unit Forecast, by Component 2020 & 2033
- Table 9: Global CGM Market Revenue Million Forecast, by End User 2020 & 2033
- Table 10: Global CGM Market Volume K Unit Forecast, by End User 2020 & 2033
- Table 11: Global CGM Market Revenue Million Forecast, by Country 2020 & 2033
- Table 12: Global CGM Market Volume K Unit Forecast, by Country 2020 & 2033
- Table 13: United States CGM Market Revenue (Million) Forecast, by Application 2020 & 2033
- Table 14: United States CGM Market Volume (K Unit) Forecast, by Application 2020 & 2033
- Table 15: Canada CGM Market Revenue (Million) Forecast, by Application 2020 & 2033
- Table 16: Canada CGM Market Volume (K Unit) Forecast, by Application 2020 & 2033
- Table 17: Rest of North America CGM Market Revenue (Million) Forecast, by Application 2020 & 2033
- Table 18: Rest of North America CGM Market Volume (K Unit) Forecast, by Application 2020 & 2033
- Table 19: Global CGM Market Revenue Million Forecast, by Component 2020 & 2033
- Table 20: Global CGM Market Volume K Unit Forecast, by Component 2020 & 2033
- Table 21: Global CGM Market Revenue Million Forecast, by End User 2020 & 2033
- Table 22: Global CGM Market Volume K Unit Forecast, by End User 2020 & 2033
- Table 23: Global CGM Market Revenue Million Forecast, by Country 2020 & 2033
- Table 24: Global CGM Market Volume K Unit Forecast, by Country 2020 & 2033
- Table 25: France CGM Market Revenue (Million) Forecast, by Application 2020 & 2033
- Table 26: France CGM Market Volume (K Unit) Forecast, by Application 2020 & 2033
- Table 27: Germany CGM Market Revenue (Million) Forecast, by Application 2020 & 2033
- Table 28: Germany CGM Market Volume (K Unit) Forecast, by Application 2020 & 2033
- Table 29: Italy CGM Market Revenue (Million) Forecast, by Application 2020 & 2033
- Table 30: Italy CGM Market Volume (K Unit) Forecast, by Application 2020 & 2033
- Table 31: Spain CGM Market Revenue (Million) Forecast, by Application 2020 & 2033
- Table 32: Spain CGM Market Volume (K Unit) Forecast, by Application 2020 & 2033
- Table 33: United Kingdom CGM Market Revenue (Million) Forecast, by Application 2020 & 2033
- Table 34: United Kingdom CGM Market Volume (K Unit) Forecast, by Application 2020 & 2033
- Table 35: Russia CGM Market Revenue (Million) Forecast, by Application 2020 & 2033
- Table 36: Russia CGM Market Volume (K Unit) Forecast, by Application 2020 & 2033
- Table 37: Rest of Europe CGM Market Revenue (Million) Forecast, by Application 2020 & 2033
- Table 38: Rest of Europe CGM Market Volume (K Unit) Forecast, by Application 2020 & 2033
- Table 39: Global CGM Market Revenue Million Forecast, by Component 2020 & 2033
- Table 40: Global CGM Market Volume K Unit Forecast, by Component 2020 & 2033
- Table 41: Global CGM Market Revenue Million Forecast, by End User 2020 & 2033
- Table 42: Global CGM Market Volume K Unit Forecast, by End User 2020 & 2033
- Table 43: Global CGM Market Revenue Million Forecast, by Country 2020 & 2033
- Table 44: Global CGM Market Volume K Unit Forecast, by Country 2020 & 2033
- Table 45: Mexico CGM Market Revenue (Million) Forecast, by Application 2020 & 2033
- Table 46: Mexico CGM Market Volume (K Unit) Forecast, by Application 2020 & 2033
- Table 47: Brazil CGM Market Revenue (Million) Forecast, by Application 2020 & 2033
- Table 48: Brazil CGM Market Volume (K Unit) Forecast, by Application 2020 & 2033
- Table 49: Rest of Latin America CGM Market Revenue (Million) Forecast, by Application 2020 & 2033
- Table 50: Rest of Latin America CGM Market Volume (K Unit) Forecast, by Application 2020 & 2033
- Table 51: Global CGM Market Revenue Million Forecast, by Component 2020 & 2033
- Table 52: Global CGM Market Volume K Unit Forecast, by Component 2020 & 2033
- Table 53: Global CGM Market Revenue Million Forecast, by End User 2020 & 2033
- Table 54: Global CGM Market Volume K Unit Forecast, by End User 2020 & 2033
- Table 55: Global CGM Market Revenue Million Forecast, by Country 2020 & 2033
- Table 56: Global CGM Market Volume K Unit Forecast, by Country 2020 & 2033
- Table 57: Japan CGM Market Revenue (Million) Forecast, by Application 2020 & 2033
- Table 58: Japan CGM Market Volume (K Unit) Forecast, by Application 2020 & 2033
- Table 59: South Korea CGM Market Revenue (Million) Forecast, by Application 2020 & 2033
- Table 60: South Korea CGM Market Volume (K Unit) Forecast, by Application 2020 & 2033
- Table 61: China CGM Market Revenue (Million) Forecast, by Application 2020 & 2033
- Table 62: China CGM Market Volume (K Unit) Forecast, by Application 2020 & 2033
- Table 63: India CGM Market Revenue (Million) Forecast, by Application 2020 & 2033
- Table 64: India CGM Market Volume (K Unit) Forecast, by Application 2020 & 2033
- Table 65: Australia CGM Market Revenue (Million) Forecast, by Application 2020 & 2033
- Table 66: Australia CGM Market Volume (K Unit) Forecast, by Application 2020 & 2033
- Table 67: Vietnam CGM Market Revenue (Million) Forecast, by Application 2020 & 2033
- Table 68: Vietnam CGM Market Volume (K Unit) Forecast, by Application 2020 & 2033
- Table 69: Malaysia CGM Market Revenue (Million) Forecast, by Application 2020 & 2033
- Table 70: Malaysia CGM Market Volume (K Unit) Forecast, by Application 2020 & 2033
- Table 71: Indonesia CGM Market Revenue (Million) Forecast, by Application 2020 & 2033
- Table 72: Indonesia CGM Market Volume (K Unit) Forecast, by Application 2020 & 2033
- Table 73: Philippines CGM Market Revenue (Million) Forecast, by Application 2020 & 2033
- Table 74: Philippines CGM Market Volume (K Unit) Forecast, by Application 2020 & 2033
- Table 75: Thailand CGM Market Revenue (Million) Forecast, by Application 2020 & 2033
- Table 76: Thailand CGM Market Volume (K Unit) Forecast, by Application 2020 & 2033
- Table 77: Rest of Asia Pacific CGM Market Revenue (Million) Forecast, by Application 2020 & 2033
- Table 78: Rest of Asia Pacific CGM Market Volume (K Unit) Forecast, by Application 2020 & 2033
- Table 79: Global CGM Market Revenue Million Forecast, by Component 2020 & 2033
- Table 80: Global CGM Market Volume K Unit Forecast, by Component 2020 & 2033
- Table 81: Global CGM Market Revenue Million Forecast, by End User 2020 & 2033
- Table 82: Global CGM Market Volume K Unit Forecast, by End User 2020 & 2033
- Table 83: Global CGM Market Revenue Million Forecast, by Country 2020 & 2033
- Table 84: Global CGM Market Volume K Unit Forecast, by Country 2020 & 2033
- Table 85: Saudi Arabia CGM Market Revenue (Million) Forecast, by Application 2020 & 2033
- Table 86: Saudi Arabia CGM Market Volume (K Unit) Forecast, by Application 2020 & 2033
- Table 87: Iran CGM Market Revenue (Million) Forecast, by Application 2020 & 2033
- Table 88: Iran CGM Market Volume (K Unit) Forecast, by Application 2020 & 2033
- Table 89: Egypt CGM Market Revenue (Million) Forecast, by Application 2020 & 2033
- Table 90: Egypt CGM Market Volume (K Unit) Forecast, by Application 2020 & 2033
- Table 91: Oman CGM Market Revenue (Million) Forecast, by Application 2020 & 2033
- Table 92: Oman CGM Market Volume (K Unit) Forecast, by Application 2020 & 2033
- Table 93: South Africa CGM Market Revenue (Million) Forecast, by Application 2020 & 2033
- Table 94: South Africa CGM Market Volume (K Unit) Forecast, by Application 2020 & 2033
- Table 95: Rest of Middle East and Africa CGM Market Revenue (Million) Forecast, by Application 2020 & 2033
- Table 96: Rest of Middle East and Africa CGM Market Volume (K Unit) Forecast, by Application 2020 & 2033
Frequently Asked Questions
1. What is the projected Compound Annual Growth Rate (CAGR) of the CGM Market?
The projected CAGR is approximately 12.89%.
2. Which companies are prominent players in the CGM Market?
Key companies in the market include Medtrum Technologies, Nemaura Medical Inc, A Menarini Diagnostics s r l, F Hoffmann-La Roche Ltd, Ypsomed Holding AG, Senseonics Holdings Inc, Dexcom Inc, Medtronic PLC, Abbott, i-Sens Inc .
3. What are the main segments of the CGM Market?
The market segments include Component, End User.
4. Can you provide details about the market size?
The market size is estimated to be USD 11.63 Million as of 2022.
5. What are some drivers contributing to market growth?
Growing Burden of Gastrointestinal Diseases; Rising Preference of Point of Care Test.
6. What are the notable trends driving market growth?
The Sensors Segment is Expected to Hold a Major Market Share Over the Forecast Period.
7. Are there any restraints impacting market growth?
High Cost of Instruments.
8. Can you provide examples of recent developments in the market?
March 2024: The Dexcom Stelo Glucose Biosensor System, an integrated CGM (iCGM), was granted marketing clearance by the US Food and Drug Administration. The device is designed for individuals aged 18 and above who do not require insulin, including those with diabetes managing their condition through oral medications and those without diabetes who wish to gain insights into the effects of diet and exercise on their blood sugar levels.
9. What pricing options are available for accessing the report?
Pricing options include single-user, multi-user, and enterprise licenses priced at USD 4750, USD 5250, and USD 8750 respectively.
10. Is the market size provided in terms of value or volume?
The market size is provided in terms of value, measured in Million and volume, measured in K Unit.
11. Are there any specific market keywords associated with the report?
Yes, the market keyword associated with the report is "CGM Market," which aids in identifying and referencing the specific market segment covered.
12. How do I determine which pricing option suits my needs best?
The pricing options vary based on user requirements and access needs. Individual users may opt for single-user licenses, while businesses requiring broader access may choose multi-user or enterprise licenses for cost-effective access to the report.
13. Are there any additional resources or data provided in the CGM Market report?
While the report offers comprehensive insights, it's advisable to review the specific contents or supplementary materials provided to ascertain if additional resources or data are available.
14. How can I stay updated on further developments or reports in the CGM Market?
To stay informed about further developments, trends, and reports in the CGM Market, consider subscribing to industry newsletters, following relevant companies and organizations, or regularly checking reputable industry news sources and publications.
Methodology
Step 1 - Identification of Relevant Samples Size from Population Database


Step 2 - Approaches for Defining Global Market Size (Value, Volume* & Price*)

Note*: In applicable scenarios
Step 3 - Data Sources
Primary Research
- Web Analytics
- Survey Reports
- Research Institute
- Latest Research Reports
- Opinion Leaders
Secondary Research
- Annual Reports
- White Paper
- Latest Press Release
- Industry Association
- Paid Database
- Investor Presentations

Step 4 - Data Triangulation
Involves using different sources of information in order to increase the validity of a study
These sources are likely to be stakeholders in a program - participants, other researchers, program staff, other community members, and so on.
Then we put all data in single framework & apply various statistical tools to find out the dynamic on the market.
During the analysis stage, feedback from the stakeholder groups would be compared to determine areas of agreement as well as areas of divergence