


Key Insights
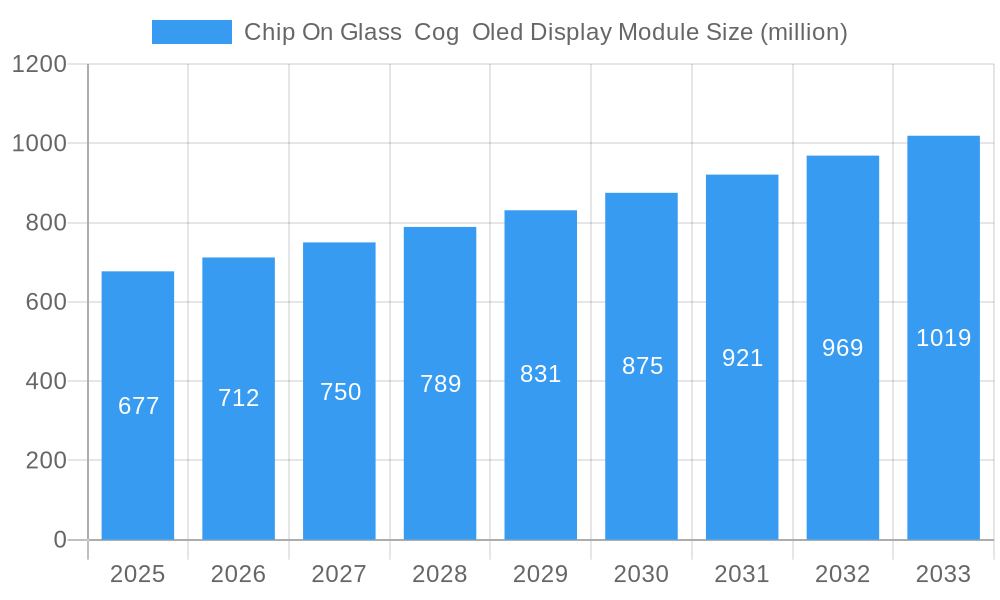
The Chip On Glass (COG) OLED display module market, valued at $677 million in 2025, is projected to experience robust growth, driven by the increasing demand for high-resolution, energy-efficient displays in various applications. The 5.1% CAGR from 2025 to 2033 indicates a steady expansion, fueled by several key factors. The miniaturization trend in electronics, particularly in wearables and smartphones, is a significant driver, as COG technology allows for thinner and lighter displays. Furthermore, advancements in OLED technology, leading to improved brightness, color accuracy, and power efficiency, are bolstering market growth. The rising adoption of flexible displays in consumer electronics and the automotive sector also contributes to the market's expansion. While challenges exist, such as the relatively higher manufacturing cost compared to traditional display technologies, ongoing technological advancements and economies of scale are likely to mitigate these constraints. Major players like Vishay, BOE Technology, LG Display, and Samsung Electronics are actively shaping market dynamics through innovation and strategic partnerships. The market segmentation is expected to see growth across various screen sizes, with smaller displays dominating the wearables market and larger displays finding applications in automotive dashboards and other industrial applications.

Chip On Glass Cog Oled Display Module Market Size (In Million)

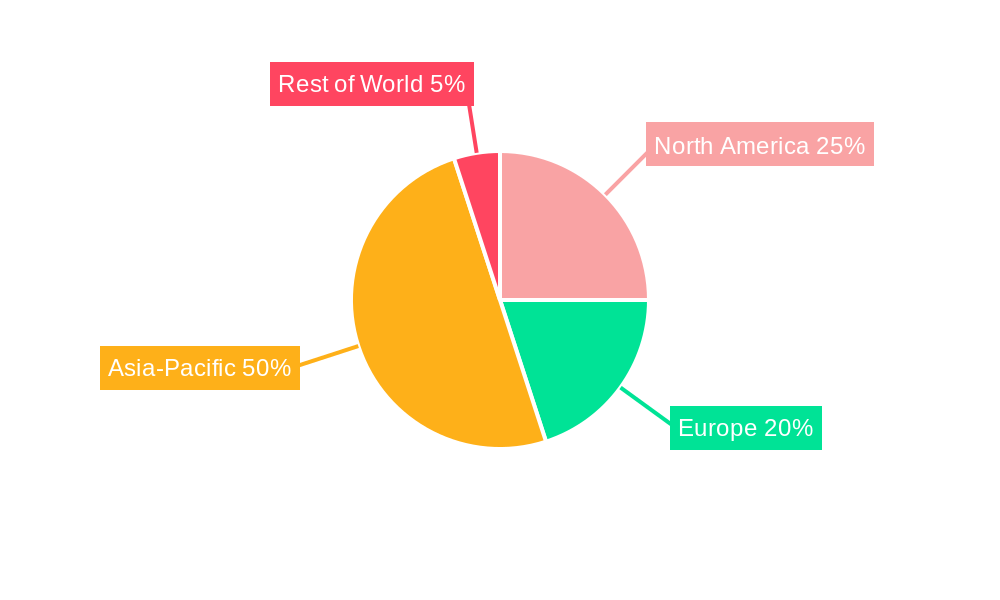
The forecast period (2025-2033) anticipates continued market penetration across diverse regions, with Asia-Pacific likely to remain a dominant market due to the high concentration of electronics manufacturing. However, North America and Europe are expected to witness significant growth, driven by increasing consumer demand and technological adoption. The competitive landscape is marked by both established players and emerging companies, leading to innovation and competitive pricing. Continued investment in research and development will further enhance display quality and functionalities, thereby expanding the applications and market potential of COG OLED display modules. The integration of advanced features like touch functionality and improved durability is expected to further drive market growth in the coming years.
Chip On Glass Cog Oled Display Module Company Market Share
Chip On Glass COG OLED Display Module Market Report: 2019-2033
This comprehensive report provides an in-depth analysis of the Chip On Glass (COG) OLED display module market, offering invaluable insights for industry stakeholders, investors, and strategic decision-makers. Covering the period from 2019 to 2033, with a base year of 2025 and a forecast period of 2025-2033, this report meticulously examines market trends, competitive landscapes, and future growth prospects. The report leverages extensive primary and secondary research to deliver accurate and actionable intelligence.
Chip On Glass COG OLED Display Module Market Concentration & Innovation
The Chip On Glass COG OLED display module market exhibits a moderately concentrated landscape, with key players like BOE Technology, LG Display, and Samsung Electronics holding significant market share. However, smaller, specialized companies such as Vishay, Display Visions GmbH, Royal Display, UJ Light Technologies, Displaybly (SZ) Technology, Plus Opto, Shenzhen Yabin Electronics, and Kopin Corporation are contributing to innovation and niche market penetration. The market share of the top 3 players is estimated at xx%.
- Innovation Drivers: Miniaturization, flexible displays, higher resolutions, and improved power efficiency are driving innovation. Significant R&D investments are focused on enhancing display performance and reducing manufacturing costs.
- Regulatory Frameworks: Government regulations concerning electronic waste disposal and energy efficiency are influencing the market. Compliance costs are factored into the price structure of COG OLED display modules.
- Product Substitutes: Alternative display technologies like AMOLED and LCD displays pose competitive pressure, although COG OLED technology offers advantages in terms of thinner profiles and cost-effectiveness in certain applications.
- End-User Trends: The increasing demand for high-resolution displays in consumer electronics (smartphones, wearables, tablets), automotive, and medical devices is a key growth driver.
- M&A Activities: Over the historical period (2019-2024), M&A activity has been moderate, with a total deal value estimated at $xx million. This activity is expected to increase in the forecast period as companies seek to expand their market reach and technological capabilities.
Chip On Glass COG OLED Display Module Industry Trends & Insights
The global Chip On Glass COG OLED display module market is witnessing robust growth, fueled by the increasing adoption of OLED technology across various applications. The market is projected to achieve a CAGR of xx% during the forecast period (2025-2033). This growth is underpinned by several key factors:
- Technological Disruptions: Advancements in materials science, manufacturing processes, and display driver ICs are enhancing the performance and affordability of COG OLED displays. The emergence of foldable and rollable displays is further driving market expansion.
- Market Growth Drivers: The rising demand for high-resolution, energy-efficient displays in smartphones, wearables, automotive dashboards, and other applications are pushing market growth. Moreover, the increasing adoption of COG technology over traditional TAB (Tape Automated Bonding) methods due to its cost-effectiveness and improved yield contributes significantly.
- Consumer Preferences: Consumers are increasingly demanding superior display quality, including better color accuracy, higher contrast ratios, and faster response times. COG OLED technology meets these demands.
- Competitive Dynamics: The market is characterized by intense competition among established players and emerging companies. This competitive landscape is driving innovation and price reductions, benefiting consumers. Market penetration of COG OLED modules in various segments is continuously increasing and is expected to reach xx% by 2033.
Dominant Markets & Segments in Chip On Glass Cog Oled Display Module
The Asia-Pacific region is currently the dominant market for Chip On Glass COG OLED display modules, driven by strong consumer electronics manufacturing and a large consumer base. China, in particular, is a key growth driver due to its substantial manufacturing capacity and rapidly growing domestic market.
- Key Drivers in Asia-Pacific:
- Robust growth in consumer electronics manufacturing.
- Increasing smartphone and wearable adoption.
- Supportive government policies promoting technological advancements.
- Development of robust infrastructure and supply chain.
Other regions, including North America and Europe, are also experiencing growth but at a slower pace compared to Asia-Pacific. The automotive segment shows exceptional promise for future growth due to the increasing demand for advanced driver-assistance systems (ADAS) and in-car entertainment systems.
Chip On Glass Cog Oled Display Module Product Developments
Recent product innovations focus on enhancing display resolution, flexibility, and durability. Manufacturers are introducing COG OLED modules with ultra-high resolutions, flexible form factors, and improved power efficiency. These advancements are expanding the application range of COG OLED technology into newer markets like foldable smartphones, augmented reality (AR) devices, and advanced medical displays. The competitive advantage lies in offering cost-effective solutions with superior performance characteristics.
Report Scope & Segmentation Analysis
This report segments the Chip On Glass COG OLED display module market based on several key parameters, including:
By Display Size: Small (<5 inches), Medium (5-10 inches), Large (>10 inches). Each segment displays varying growth rates and market sizes driven by application-specific demand.
By Resolution: HD, FHD, UHD, and beyond. Higher resolution displays are expected to command premium pricing but also drive growth due to increasing consumer preference.
By Application: Consumer Electronics (Smartphones, Wearables, Tablets), Automotive, Medical Devices, Industrial Applications. Consumer Electronics remains the largest segment, while automotive and medical applications are exhibiting high growth potential.
By Region: North America, Europe, Asia-Pacific, and Rest of the World. Asia-Pacific dominates in terms of market share and growth rate.
Key Drivers of Chip On Glass Cog Oled Display Module Growth
Several factors contribute to the growth of the Chip On Glass COG OLED display module market:
Technological Advancements: Continuous innovations in OLED technology, including the development of flexible and foldable displays, are driving market expansion.
Rising Demand for High-Resolution Displays: The increasing demand for high-quality displays in various applications fuels market growth.
Cost Reduction in Manufacturing: Advancements in manufacturing processes have led to a decrease in production costs, making COG OLED displays more affordable.
Government Support and Incentives: Government policies aimed at promoting technological advancements further boost market growth.
Challenges in the Chip On Glass Cog Oled Display Module Sector
Several challenges hinder the growth of the Chip On Glass COG OLED display module market:
High Initial Investment Costs: The high capital expenditure required for setting up manufacturing facilities poses a challenge to some players.
Supply Chain Disruptions: Global supply chain disruptions can impact the availability and cost of raw materials, impacting production and profitability.
Intense Competition: The market is characterized by intense competition among established and emerging players.
Regulatory Hurdles: Government regulations related to environmental protection and electronic waste disposal impact manufacturing costs. These regulations vary across regions adding another layer of complexity.
Emerging Opportunities in Chip On Glass Cog Oled Display Module
The Chip On Glass COG OLED display module market presents significant emerging opportunities:
Expansion into New Applications: The application scope is expanding into new sectors, such as augmented reality and wearable technology.
Development of Advanced Features: Innovations such as flexible displays, transparent displays, and higher refresh rates offer lucrative opportunities.
Emerging Markets: Developing economies provide promising growth prospects due to rising consumer disposable income and increasing smartphone penetration.
Leading Players in the Chip On Glass Cog Oled Display Module Market
- Vishay
- Display Visions GmbH
- Royal Display
- UJ Light Technologies
- Displaybly (SZ) Technology
- Plus Opto
- Shenzhen Yabin Electronics
- Kopin Corporation
- BOE Technology
- LG Display
- Samsung Electronics
Key Developments in Chip On Glass Cog Oled Display Module Industry
- 2022-Q4: BOE Technology announced the mass production of its new generation of flexible OLED displays.
- 2023-Q1: LG Display launched a new COG OLED module with improved brightness and color accuracy.
- 2023-Q3: Samsung Electronics acquired a smaller display technology company to enhance its COG OLED capabilities (Hypothetical example).
Strategic Outlook for Chip On Glass Cog Oled Display Module Market
The Chip On Glass COG OLED display module market is poised for significant growth in the coming years. Driven by continuous technological advancements, expanding applications, and increasing consumer demand, the market is expected to witness a substantial increase in both volume and value. Companies focusing on innovation, cost optimization, and strategic partnerships will be well-positioned to capture significant market share. The focus on sustainability and environmentally friendly manufacturing processes will also play a crucial role in shaping the future landscape of the industry.
Chip On Glass Cog Oled Display Module Segmentation
-
1. Application
- 1.1. Industrial Machinery
- 1.2. White Goods
- 1.3. Energy
- 1.4. Automobile
- 1.5. Medical
- 1.6. Others
-
2. Type
- 2.1. Graphic Type
- 2.2. Character Type
Chip On Glass Cog Oled Display Module Segmentation By Geography
-
1. North America
- 1.1. United States
- 1.2. Canada
- 1.3. Mexico
-
2. South America
- 2.1. Brazil
- 2.2. Argentina
- 2.3. Rest of South America
-
3. Europe
- 3.1. United Kingdom
- 3.2. Germany
- 3.3. France
- 3.4. Italy
- 3.5. Spain
- 3.6. Russia
- 3.7. Benelux
- 3.8. Nordics
- 3.9. Rest of Europe
-
4. Middle East & Africa
- 4.1. Turkey
- 4.2. Israel
- 4.3. GCC
- 4.4. North Africa
- 4.5. South Africa
- 4.6. Rest of Middle East & Africa
-
5. Asia Pacific
- 5.1. China
- 5.2. India
- 5.3. Japan
- 5.4. South Korea
- 5.5. ASEAN
- 5.6. Oceania
- 5.7. Rest of Asia Pacific
Chip On Glass Cog Oled Display Module Regional Market Share
Geographic Coverage of Chip On Glass Cog Oled Display Module
Chip On Glass Cog Oled Display Module REPORT HIGHLIGHTS
| Aspects | Details |
|---|---|
| Study Period | 2020-2034 |
| Base Year | 2025 |
| Estimated Year | 2026 |
| Forecast Period | 2026-2034 |
| Historical Period | 2020-2025 |
| Growth Rate | CAGR of 5.1% from 2020-2034 |
| Segmentation |
|
Table of Contents
- 1. Introduction
- 1.1. Research Scope
- 1.2. Market Segmentation
- 1.3. Research Methodology
- 1.4. Definitions and Assumptions
- 2. Executive Summary
- 2.1. Introduction
- 3. Market Dynamics
- 3.1. Introduction
- 3.2. Market Drivers
- 3.3. Market Restrains
- 3.4. Market Trends
- 4. Market Factor Analysis
- 4.1. Porters Five Forces
- 4.2. Supply/Value Chain
- 4.3. PESTEL analysis
- 4.4. Market Entropy
- 4.5. Patent/Trademark Analysis
- 5. Global Chip On Glass Cog Oled Display Module Analysis, Insights and Forecast, 2020-2032
- 5.1. Market Analysis, Insights and Forecast - by Application
- 5.1.1. Industrial Machinery
- 5.1.2. White Goods
- 5.1.3. Energy
- 5.1.4. Automobile
- 5.1.5. Medical
- 5.1.6. Others
- 5.2. Market Analysis, Insights and Forecast - by Type
- 5.2.1. Graphic Type
- 5.2.2. Character Type
- 5.3. Market Analysis, Insights and Forecast - by Region
- 5.3.1. North America
- 5.3.2. South America
- 5.3.3. Europe
- 5.3.4. Middle East & Africa
- 5.3.5. Asia Pacific
- 5.1. Market Analysis, Insights and Forecast - by Application
- 6. North America Chip On Glass Cog Oled Display Module Analysis, Insights and Forecast, 2020-2032
- 6.1. Market Analysis, Insights and Forecast - by Application
- 6.1.1. Industrial Machinery
- 6.1.2. White Goods
- 6.1.3. Energy
- 6.1.4. Automobile
- 6.1.5. Medical
- 6.1.6. Others
- 6.2. Market Analysis, Insights and Forecast - by Type
- 6.2.1. Graphic Type
- 6.2.2. Character Type
- 6.1. Market Analysis, Insights and Forecast - by Application
- 7. South America Chip On Glass Cog Oled Display Module Analysis, Insights and Forecast, 2020-2032
- 7.1. Market Analysis, Insights and Forecast - by Application
- 7.1.1. Industrial Machinery
- 7.1.2. White Goods
- 7.1.3. Energy
- 7.1.4. Automobile
- 7.1.5. Medical
- 7.1.6. Others
- 7.2. Market Analysis, Insights and Forecast - by Type
- 7.2.1. Graphic Type
- 7.2.2. Character Type
- 7.1. Market Analysis, Insights and Forecast - by Application
- 8. Europe Chip On Glass Cog Oled Display Module Analysis, Insights and Forecast, 2020-2032
- 8.1. Market Analysis, Insights and Forecast - by Application
- 8.1.1. Industrial Machinery
- 8.1.2. White Goods
- 8.1.3. Energy
- 8.1.4. Automobile
- 8.1.5. Medical
- 8.1.6. Others
- 8.2. Market Analysis, Insights and Forecast - by Type
- 8.2.1. Graphic Type
- 8.2.2. Character Type
- 8.1. Market Analysis, Insights and Forecast - by Application
- 9. Middle East & Africa Chip On Glass Cog Oled Display Module Analysis, Insights and Forecast, 2020-2032
- 9.1. Market Analysis, Insights and Forecast - by Application
- 9.1.1. Industrial Machinery
- 9.1.2. White Goods
- 9.1.3. Energy
- 9.1.4. Automobile
- 9.1.5. Medical
- 9.1.6. Others
- 9.2. Market Analysis, Insights and Forecast - by Type
- 9.2.1. Graphic Type
- 9.2.2. Character Type
- 9.1. Market Analysis, Insights and Forecast - by Application
- 10. Asia Pacific Chip On Glass Cog Oled Display Module Analysis, Insights and Forecast, 2020-2032
- 10.1. Market Analysis, Insights and Forecast - by Application
- 10.1.1. Industrial Machinery
- 10.1.2. White Goods
- 10.1.3. Energy
- 10.1.4. Automobile
- 10.1.5. Medical
- 10.1.6. Others
- 10.2. Market Analysis, Insights and Forecast - by Type
- 10.2.1. Graphic Type
- 10.2.2. Character Type
- 10.1. Market Analysis, Insights and Forecast - by Application
- 11. Competitive Analysis
- 11.1. Global Market Share Analysis 2025
- 11.2. Company Profiles
- 11.2.1 Vishay
- 11.2.1.1. Overview
- 11.2.1.2. Products
- 11.2.1.3. SWOT Analysis
- 11.2.1.4. Recent Developments
- 11.2.1.5. Financials (Based on Availability)
- 11.2.2 Display Visions GmbH
- 11.2.2.1. Overview
- 11.2.2.2. Products
- 11.2.2.3. SWOT Analysis
- 11.2.2.4. Recent Developments
- 11.2.2.5. Financials (Based on Availability)
- 11.2.3 Royal Display
- 11.2.3.1. Overview
- 11.2.3.2. Products
- 11.2.3.3. SWOT Analysis
- 11.2.3.4. Recent Developments
- 11.2.3.5. Financials (Based on Availability)
- 11.2.4 UJ Light Technologies
- 11.2.4.1. Overview
- 11.2.4.2. Products
- 11.2.4.3. SWOT Analysis
- 11.2.4.4. Recent Developments
- 11.2.4.5. Financials (Based on Availability)
- 11.2.5 Displaybly (SZ) Technology
- 11.2.5.1. Overview
- 11.2.5.2. Products
- 11.2.5.3. SWOT Analysis
- 11.2.5.4. Recent Developments
- 11.2.5.5. Financials (Based on Availability)
- 11.2.6 Plus Opto
- 11.2.6.1. Overview
- 11.2.6.2. Products
- 11.2.6.3. SWOT Analysis
- 11.2.6.4. Recent Developments
- 11.2.6.5. Financials (Based on Availability)
- 11.2.7 Shenzhen Yabin Electronics
- 11.2.7.1. Overview
- 11.2.7.2. Products
- 11.2.7.3. SWOT Analysis
- 11.2.7.4. Recent Developments
- 11.2.7.5. Financials (Based on Availability)
- 11.2.8 Kopin Corporation
- 11.2.8.1. Overview
- 11.2.8.2. Products
- 11.2.8.3. SWOT Analysis
- 11.2.8.4. Recent Developments
- 11.2.8.5. Financials (Based on Availability)
- 11.2.9 BOE Technology
- 11.2.9.1. Overview
- 11.2.9.2. Products
- 11.2.9.3. SWOT Analysis
- 11.2.9.4. Recent Developments
- 11.2.9.5. Financials (Based on Availability)
- 11.2.10 LG Display
- 11.2.10.1. Overview
- 11.2.10.2. Products
- 11.2.10.3. SWOT Analysis
- 11.2.10.4. Recent Developments
- 11.2.10.5. Financials (Based on Availability)
- 11.2.11 Samsung Electronics
- 11.2.11.1. Overview
- 11.2.11.2. Products
- 11.2.11.3. SWOT Analysis
- 11.2.11.4. Recent Developments
- 11.2.11.5. Financials (Based on Availability)
- 11.2.1 Vishay
List of Figures
- Figure 1: Global Chip On Glass Cog Oled Display Module Revenue Breakdown (million, %) by Region 2025 & 2033
- Figure 2: Global Chip On Glass Cog Oled Display Module Volume Breakdown (K, %) by Region 2025 & 2033
- Figure 3: North America Chip On Glass Cog Oled Display Module Revenue (million), by Application 2025 & 2033
- Figure 4: North America Chip On Glass Cog Oled Display Module Volume (K), by Application 2025 & 2033
- Figure 5: North America Chip On Glass Cog Oled Display Module Revenue Share (%), by Application 2025 & 2033
- Figure 6: North America Chip On Glass Cog Oled Display Module Volume Share (%), by Application 2025 & 2033
- Figure 7: North America Chip On Glass Cog Oled Display Module Revenue (million), by Type 2025 & 2033
- Figure 8: North America Chip On Glass Cog Oled Display Module Volume (K), by Type 2025 & 2033
- Figure 9: North America Chip On Glass Cog Oled Display Module Revenue Share (%), by Type 2025 & 2033
- Figure 10: North America Chip On Glass Cog Oled Display Module Volume Share (%), by Type 2025 & 2033
- Figure 11: North America Chip On Glass Cog Oled Display Module Revenue (million), by Country 2025 & 2033
- Figure 12: North America Chip On Glass Cog Oled Display Module Volume (K), by Country 2025 & 2033
- Figure 13: North America Chip On Glass Cog Oled Display Module Revenue Share (%), by Country 2025 & 2033
- Figure 14: North America Chip On Glass Cog Oled Display Module Volume Share (%), by Country 2025 & 2033
- Figure 15: South America Chip On Glass Cog Oled Display Module Revenue (million), by Application 2025 & 2033
- Figure 16: South America Chip On Glass Cog Oled Display Module Volume (K), by Application 2025 & 2033
- Figure 17: South America Chip On Glass Cog Oled Display Module Revenue Share (%), by Application 2025 & 2033
- Figure 18: South America Chip On Glass Cog Oled Display Module Volume Share (%), by Application 2025 & 2033
- Figure 19: South America Chip On Glass Cog Oled Display Module Revenue (million), by Type 2025 & 2033
- Figure 20: South America Chip On Glass Cog Oled Display Module Volume (K), by Type 2025 & 2033
- Figure 21: South America Chip On Glass Cog Oled Display Module Revenue Share (%), by Type 2025 & 2033
- Figure 22: South America Chip On Glass Cog Oled Display Module Volume Share (%), by Type 2025 & 2033
- Figure 23: South America Chip On Glass Cog Oled Display Module Revenue (million), by Country 2025 & 2033
- Figure 24: South America Chip On Glass Cog Oled Display Module Volume (K), by Country 2025 & 2033
- Figure 25: South America Chip On Glass Cog Oled Display Module Revenue Share (%), by Country 2025 & 2033
- Figure 26: South America Chip On Glass Cog Oled Display Module Volume Share (%), by Country 2025 & 2033
- Figure 27: Europe Chip On Glass Cog Oled Display Module Revenue (million), by Application 2025 & 2033
- Figure 28: Europe Chip On Glass Cog Oled Display Module Volume (K), by Application 2025 & 2033
- Figure 29: Europe Chip On Glass Cog Oled Display Module Revenue Share (%), by Application 2025 & 2033
- Figure 30: Europe Chip On Glass Cog Oled Display Module Volume Share (%), by Application 2025 & 2033
- Figure 31: Europe Chip On Glass Cog Oled Display Module Revenue (million), by Type 2025 & 2033
- Figure 32: Europe Chip On Glass Cog Oled Display Module Volume (K), by Type 2025 & 2033
- Figure 33: Europe Chip On Glass Cog Oled Display Module Revenue Share (%), by Type 2025 & 2033
- Figure 34: Europe Chip On Glass Cog Oled Display Module Volume Share (%), by Type 2025 & 2033
- Figure 35: Europe Chip On Glass Cog Oled Display Module Revenue (million), by Country 2025 & 2033
- Figure 36: Europe Chip On Glass Cog Oled Display Module Volume (K), by Country 2025 & 2033
- Figure 37: Europe Chip On Glass Cog Oled Display Module Revenue Share (%), by Country 2025 & 2033
- Figure 38: Europe Chip On Glass Cog Oled Display Module Volume Share (%), by Country 2025 & 2033
- Figure 39: Middle East & Africa Chip On Glass Cog Oled Display Module Revenue (million), by Application 2025 & 2033
- Figure 40: Middle East & Africa Chip On Glass Cog Oled Display Module Volume (K), by Application 2025 & 2033
- Figure 41: Middle East & Africa Chip On Glass Cog Oled Display Module Revenue Share (%), by Application 2025 & 2033
- Figure 42: Middle East & Africa Chip On Glass Cog Oled Display Module Volume Share (%), by Application 2025 & 2033
- Figure 43: Middle East & Africa Chip On Glass Cog Oled Display Module Revenue (million), by Type 2025 & 2033
- Figure 44: Middle East & Africa Chip On Glass Cog Oled Display Module Volume (K), by Type 2025 & 2033
- Figure 45: Middle East & Africa Chip On Glass Cog Oled Display Module Revenue Share (%), by Type 2025 & 2033
- Figure 46: Middle East & Africa Chip On Glass Cog Oled Display Module Volume Share (%), by Type 2025 & 2033
- Figure 47: Middle East & Africa Chip On Glass Cog Oled Display Module Revenue (million), by Country 2025 & 2033
- Figure 48: Middle East & Africa Chip On Glass Cog Oled Display Module Volume (K), by Country 2025 & 2033
- Figure 49: Middle East & Africa Chip On Glass Cog Oled Display Module Revenue Share (%), by Country 2025 & 2033
- Figure 50: Middle East & Africa Chip On Glass Cog Oled Display Module Volume Share (%), by Country 2025 & 2033
- Figure 51: Asia Pacific Chip On Glass Cog Oled Display Module Revenue (million), by Application 2025 & 2033
- Figure 52: Asia Pacific Chip On Glass Cog Oled Display Module Volume (K), by Application 2025 & 2033
- Figure 53: Asia Pacific Chip On Glass Cog Oled Display Module Revenue Share (%), by Application 2025 & 2033
- Figure 54: Asia Pacific Chip On Glass Cog Oled Display Module Volume Share (%), by Application 2025 & 2033
- Figure 55: Asia Pacific Chip On Glass Cog Oled Display Module Revenue (million), by Type 2025 & 2033
- Figure 56: Asia Pacific Chip On Glass Cog Oled Display Module Volume (K), by Type 2025 & 2033
- Figure 57: Asia Pacific Chip On Glass Cog Oled Display Module Revenue Share (%), by Type 2025 & 2033
- Figure 58: Asia Pacific Chip On Glass Cog Oled Display Module Volume Share (%), by Type 2025 & 2033
- Figure 59: Asia Pacific Chip On Glass Cog Oled Display Module Revenue (million), by Country 2025 & 2033
- Figure 60: Asia Pacific Chip On Glass Cog Oled Display Module Volume (K), by Country 2025 & 2033
- Figure 61: Asia Pacific Chip On Glass Cog Oled Display Module Revenue Share (%), by Country 2025 & 2033
- Figure 62: Asia Pacific Chip On Glass Cog Oled Display Module Volume Share (%), by Country 2025 & 2033
List of Tables
- Table 1: Global Chip On Glass Cog Oled Display Module Revenue million Forecast, by Application 2020 & 2033
- Table 2: Global Chip On Glass Cog Oled Display Module Volume K Forecast, by Application 2020 & 2033
- Table 3: Global Chip On Glass Cog Oled Display Module Revenue million Forecast, by Type 2020 & 2033
- Table 4: Global Chip On Glass Cog Oled Display Module Volume K Forecast, by Type 2020 & 2033
- Table 5: Global Chip On Glass Cog Oled Display Module Revenue million Forecast, by Region 2020 & 2033
- Table 6: Global Chip On Glass Cog Oled Display Module Volume K Forecast, by Region 2020 & 2033
- Table 7: Global Chip On Glass Cog Oled Display Module Revenue million Forecast, by Application 2020 & 2033
- Table 8: Global Chip On Glass Cog Oled Display Module Volume K Forecast, by Application 2020 & 2033
- Table 9: Global Chip On Glass Cog Oled Display Module Revenue million Forecast, by Type 2020 & 2033
- Table 10: Global Chip On Glass Cog Oled Display Module Volume K Forecast, by Type 2020 & 2033
- Table 11: Global Chip On Glass Cog Oled Display Module Revenue million Forecast, by Country 2020 & 2033
- Table 12: Global Chip On Glass Cog Oled Display Module Volume K Forecast, by Country 2020 & 2033
- Table 13: United States Chip On Glass Cog Oled Display Module Revenue (million) Forecast, by Application 2020 & 2033
- Table 14: United States Chip On Glass Cog Oled Display Module Volume (K) Forecast, by Application 2020 & 2033
- Table 15: Canada Chip On Glass Cog Oled Display Module Revenue (million) Forecast, by Application 2020 & 2033
- Table 16: Canada Chip On Glass Cog Oled Display Module Volume (K) Forecast, by Application 2020 & 2033
- Table 17: Mexico Chip On Glass Cog Oled Display Module Revenue (million) Forecast, by Application 2020 & 2033
- Table 18: Mexico Chip On Glass Cog Oled Display Module Volume (K) Forecast, by Application 2020 & 2033
- Table 19: Global Chip On Glass Cog Oled Display Module Revenue million Forecast, by Application 2020 & 2033
- Table 20: Global Chip On Glass Cog Oled Display Module Volume K Forecast, by Application 2020 & 2033
- Table 21: Global Chip On Glass Cog Oled Display Module Revenue million Forecast, by Type 2020 & 2033
- Table 22: Global Chip On Glass Cog Oled Display Module Volume K Forecast, by Type 2020 & 2033
- Table 23: Global Chip On Glass Cog Oled Display Module Revenue million Forecast, by Country 2020 & 2033
- Table 24: Global Chip On Glass Cog Oled Display Module Volume K Forecast, by Country 2020 & 2033
- Table 25: Brazil Chip On Glass Cog Oled Display Module Revenue (million) Forecast, by Application 2020 & 2033
- Table 26: Brazil Chip On Glass Cog Oled Display Module Volume (K) Forecast, by Application 2020 & 2033
- Table 27: Argentina Chip On Glass Cog Oled Display Module Revenue (million) Forecast, by Application 2020 & 2033
- Table 28: Argentina Chip On Glass Cog Oled Display Module Volume (K) Forecast, by Application 2020 & 2033
- Table 29: Rest of South America Chip On Glass Cog Oled Display Module Revenue (million) Forecast, by Application 2020 & 2033
- Table 30: Rest of South America Chip On Glass Cog Oled Display Module Volume (K) Forecast, by Application 2020 & 2033
- Table 31: Global Chip On Glass Cog Oled Display Module Revenue million Forecast, by Application 2020 & 2033
- Table 32: Global Chip On Glass Cog Oled Display Module Volume K Forecast, by Application 2020 & 2033
- Table 33: Global Chip On Glass Cog Oled Display Module Revenue million Forecast, by Type 2020 & 2033
- Table 34: Global Chip On Glass Cog Oled Display Module Volume K Forecast, by Type 2020 & 2033
- Table 35: Global Chip On Glass Cog Oled Display Module Revenue million Forecast, by Country 2020 & 2033
- Table 36: Global Chip On Glass Cog Oled Display Module Volume K Forecast, by Country 2020 & 2033
- Table 37: United Kingdom Chip On Glass Cog Oled Display Module Revenue (million) Forecast, by Application 2020 & 2033
- Table 38: United Kingdom Chip On Glass Cog Oled Display Module Volume (K) Forecast, by Application 2020 & 2033
- Table 39: Germany Chip On Glass Cog Oled Display Module Revenue (million) Forecast, by Application 2020 & 2033
- Table 40: Germany Chip On Glass Cog Oled Display Module Volume (K) Forecast, by Application 2020 & 2033
- Table 41: France Chip On Glass Cog Oled Display Module Revenue (million) Forecast, by Application 2020 & 2033
- Table 42: France Chip On Glass Cog Oled Display Module Volume (K) Forecast, by Application 2020 & 2033
- Table 43: Italy Chip On Glass Cog Oled Display Module Revenue (million) Forecast, by Application 2020 & 2033
- Table 44: Italy Chip On Glass Cog Oled Display Module Volume (K) Forecast, by Application 2020 & 2033
- Table 45: Spain Chip On Glass Cog Oled Display Module Revenue (million) Forecast, by Application 2020 & 2033
- Table 46: Spain Chip On Glass Cog Oled Display Module Volume (K) Forecast, by Application 2020 & 2033
- Table 47: Russia Chip On Glass Cog Oled Display Module Revenue (million) Forecast, by Application 2020 & 2033
- Table 48: Russia Chip On Glass Cog Oled Display Module Volume (K) Forecast, by Application 2020 & 2033
- Table 49: Benelux Chip On Glass Cog Oled Display Module Revenue (million) Forecast, by Application 2020 & 2033
- Table 50: Benelux Chip On Glass Cog Oled Display Module Volume (K) Forecast, by Application 2020 & 2033
- Table 51: Nordics Chip On Glass Cog Oled Display Module Revenue (million) Forecast, by Application 2020 & 2033
- Table 52: Nordics Chip On Glass Cog Oled Display Module Volume (K) Forecast, by Application 2020 & 2033
- Table 53: Rest of Europe Chip On Glass Cog Oled Display Module Revenue (million) Forecast, by Application 2020 & 2033
- Table 54: Rest of Europe Chip On Glass Cog Oled Display Module Volume (K) Forecast, by Application 2020 & 2033
- Table 55: Global Chip On Glass Cog Oled Display Module Revenue million Forecast, by Application 2020 & 2033
- Table 56: Global Chip On Glass Cog Oled Display Module Volume K Forecast, by Application 2020 & 2033
- Table 57: Global Chip On Glass Cog Oled Display Module Revenue million Forecast, by Type 2020 & 2033
- Table 58: Global Chip On Glass Cog Oled Display Module Volume K Forecast, by Type 2020 & 2033
- Table 59: Global Chip On Glass Cog Oled Display Module Revenue million Forecast, by Country 2020 & 2033
- Table 60: Global Chip On Glass Cog Oled Display Module Volume K Forecast, by Country 2020 & 2033
- Table 61: Turkey Chip On Glass Cog Oled Display Module Revenue (million) Forecast, by Application 2020 & 2033
- Table 62: Turkey Chip On Glass Cog Oled Display Module Volume (K) Forecast, by Application 2020 & 2033
- Table 63: Israel Chip On Glass Cog Oled Display Module Revenue (million) Forecast, by Application 2020 & 2033
- Table 64: Israel Chip On Glass Cog Oled Display Module Volume (K) Forecast, by Application 2020 & 2033
- Table 65: GCC Chip On Glass Cog Oled Display Module Revenue (million) Forecast, by Application 2020 & 2033
- Table 66: GCC Chip On Glass Cog Oled Display Module Volume (K) Forecast, by Application 2020 & 2033
- Table 67: North Africa Chip On Glass Cog Oled Display Module Revenue (million) Forecast, by Application 2020 & 2033
- Table 68: North Africa Chip On Glass Cog Oled Display Module Volume (K) Forecast, by Application 2020 & 2033
- Table 69: South Africa Chip On Glass Cog Oled Display Module Revenue (million) Forecast, by Application 2020 & 2033
- Table 70: South Africa Chip On Glass Cog Oled Display Module Volume (K) Forecast, by Application 2020 & 2033
- Table 71: Rest of Middle East & Africa Chip On Glass Cog Oled Display Module Revenue (million) Forecast, by Application 2020 & 2033
- Table 72: Rest of Middle East & Africa Chip On Glass Cog Oled Display Module Volume (K) Forecast, by Application 2020 & 2033
- Table 73: Global Chip On Glass Cog Oled Display Module Revenue million Forecast, by Application 2020 & 2033
- Table 74: Global Chip On Glass Cog Oled Display Module Volume K Forecast, by Application 2020 & 2033
- Table 75: Global Chip On Glass Cog Oled Display Module Revenue million Forecast, by Type 2020 & 2033
- Table 76: Global Chip On Glass Cog Oled Display Module Volume K Forecast, by Type 2020 & 2033
- Table 77: Global Chip On Glass Cog Oled Display Module Revenue million Forecast, by Country 2020 & 2033
- Table 78: Global Chip On Glass Cog Oled Display Module Volume K Forecast, by Country 2020 & 2033
- Table 79: China Chip On Glass Cog Oled Display Module Revenue (million) Forecast, by Application 2020 & 2033
- Table 80: China Chip On Glass Cog Oled Display Module Volume (K) Forecast, by Application 2020 & 2033
- Table 81: India Chip On Glass Cog Oled Display Module Revenue (million) Forecast, by Application 2020 & 2033
- Table 82: India Chip On Glass Cog Oled Display Module Volume (K) Forecast, by Application 2020 & 2033
- Table 83: Japan Chip On Glass Cog Oled Display Module Revenue (million) Forecast, by Application 2020 & 2033
- Table 84: Japan Chip On Glass Cog Oled Display Module Volume (K) Forecast, by Application 2020 & 2033
- Table 85: South Korea Chip On Glass Cog Oled Display Module Revenue (million) Forecast, by Application 2020 & 2033
- Table 86: South Korea Chip On Glass Cog Oled Display Module Volume (K) Forecast, by Application 2020 & 2033
- Table 87: ASEAN Chip On Glass Cog Oled Display Module Revenue (million) Forecast, by Application 2020 & 2033
- Table 88: ASEAN Chip On Glass Cog Oled Display Module Volume (K) Forecast, by Application 2020 & 2033
- Table 89: Oceania Chip On Glass Cog Oled Display Module Revenue (million) Forecast, by Application 2020 & 2033
- Table 90: Oceania Chip On Glass Cog Oled Display Module Volume (K) Forecast, by Application 2020 & 2033
- Table 91: Rest of Asia Pacific Chip On Glass Cog Oled Display Module Revenue (million) Forecast, by Application 2020 & 2033
- Table 92: Rest of Asia Pacific Chip On Glass Cog Oled Display Module Volume (K) Forecast, by Application 2020 & 2033
Frequently Asked Questions
1. What is the projected Compound Annual Growth Rate (CAGR) of the Chip On Glass Cog Oled Display Module?
The projected CAGR is approximately 5.1%.
2. Which companies are prominent players in the Chip On Glass Cog Oled Display Module?
Key companies in the market include Vishay, Display Visions GmbH, Royal Display, UJ Light Technologies, Displaybly (SZ) Technology, Plus Opto, Shenzhen Yabin Electronics, Kopin Corporation, BOE Technology, LG Display, Samsung Electronics.
3. What are the main segments of the Chip On Glass Cog Oled Display Module?
The market segments include Application, Type.
4. Can you provide details about the market size?
The market size is estimated to be USD 677 million as of 2022.
5. What are some drivers contributing to market growth?
N/A
6. What are the notable trends driving market growth?
N/A
7. Are there any restraints impacting market growth?
N/A
8. Can you provide examples of recent developments in the market?
N/A
9. What pricing options are available for accessing the report?
Pricing options include single-user, multi-user, and enterprise licenses priced at USD 3950.00, USD 5925.00, and USD 7900.00 respectively.
10. Is the market size provided in terms of value or volume?
The market size is provided in terms of value, measured in million and volume, measured in K.
11. Are there any specific market keywords associated with the report?
Yes, the market keyword associated with the report is "Chip On Glass Cog Oled Display Module," which aids in identifying and referencing the specific market segment covered.
12. How do I determine which pricing option suits my needs best?
The pricing options vary based on user requirements and access needs. Individual users may opt for single-user licenses, while businesses requiring broader access may choose multi-user or enterprise licenses for cost-effective access to the report.
13. Are there any additional resources or data provided in the Chip On Glass Cog Oled Display Module report?
While the report offers comprehensive insights, it's advisable to review the specific contents or supplementary materials provided to ascertain if additional resources or data are available.
14. How can I stay updated on further developments or reports in the Chip On Glass Cog Oled Display Module?
To stay informed about further developments, trends, and reports in the Chip On Glass Cog Oled Display Module, consider subscribing to industry newsletters, following relevant companies and organizations, or regularly checking reputable industry news sources and publications.
Methodology
Step 1 - Identification of Relevant Samples Size from Population Database


Step 2 - Approaches for Defining Global Market Size (Value, Volume* & Price*)

Note*: In applicable scenarios
Step 3 - Data Sources
Primary Research
- Web Analytics
- Survey Reports
- Research Institute
- Latest Research Reports
- Opinion Leaders
Secondary Research
- Annual Reports
- White Paper
- Latest Press Release
- Industry Association
- Paid Database
- Investor Presentations

Step 4 - Data Triangulation
Involves using different sources of information in order to increase the validity of a study
These sources are likely to be stakeholders in a program - participants, other researchers, program staff, other community members, and so on.
Then we put all data in single framework & apply various statistical tools to find out the dynamic on the market.
During the analysis stage, feedback from the stakeholder groups would be compared to determine areas of agreement as well as areas of divergence