

Key Insights
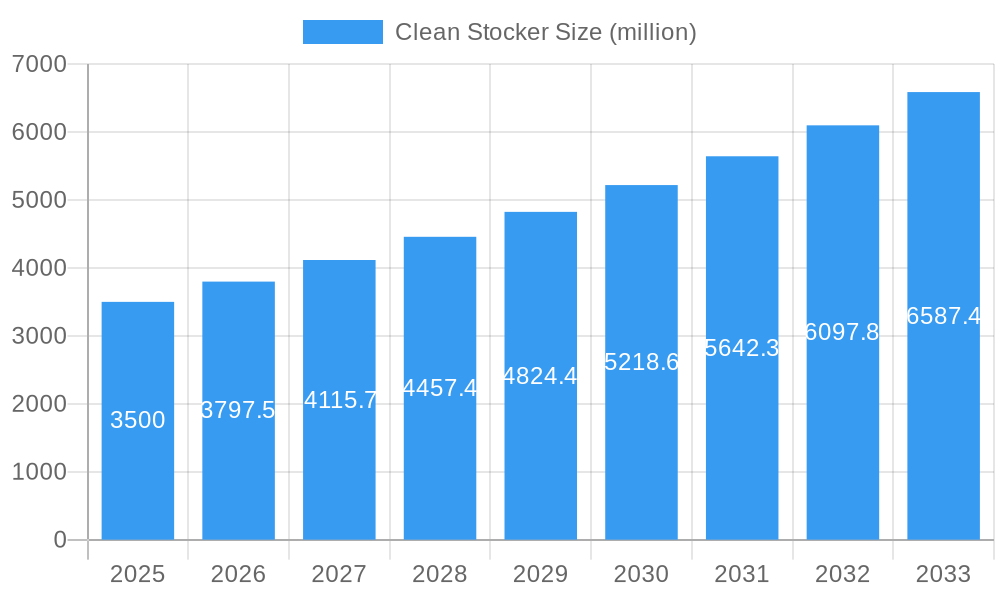
The global clean stocker market is set for substantial growth, propelled by escalating demand for advanced semiconductor manufacturing and the widespread adoption of wafer fabrication data (PFD) applications. With an estimated market size of 5.64 billion in the base year 2025, the market is projected to achieve a Compound Annual Growth Rate (CAGR) of 15.92% through 2033. This expansion is driven by continuous innovation in semiconductor technology, requiring highly controlled environments for wafer handling and storage to ensure contamination prevention. The increasing complexity and miniaturization of semiconductor components, alongside the rising adoption of advanced packaging techniques, are intensifying the need for specialized clean stocker solutions. Furthermore, the growing capabilities and data storage demands for wafer fabrication data are contributing to a sustained requirement for these sophisticated systems.
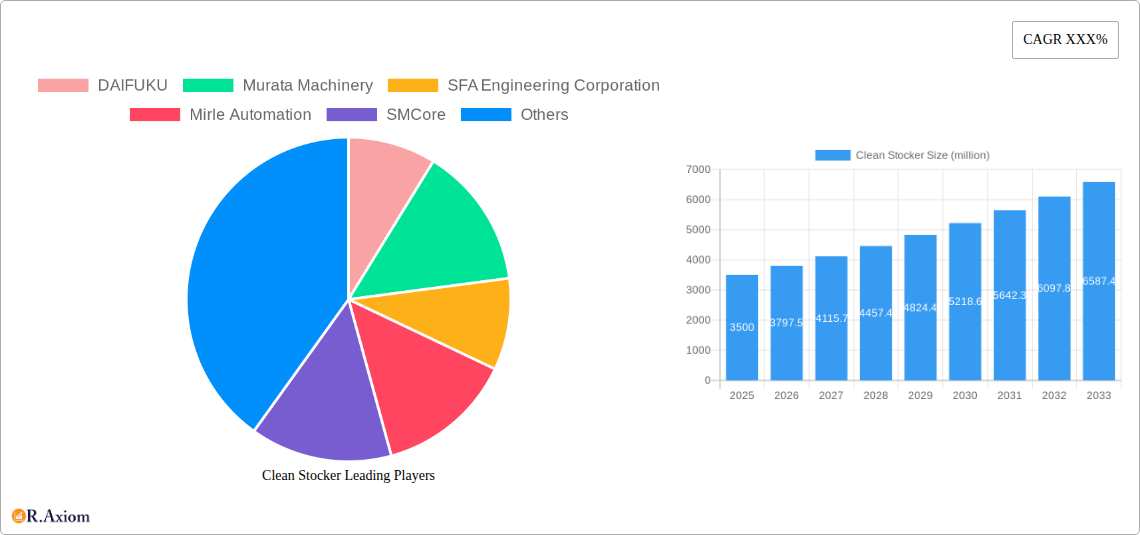
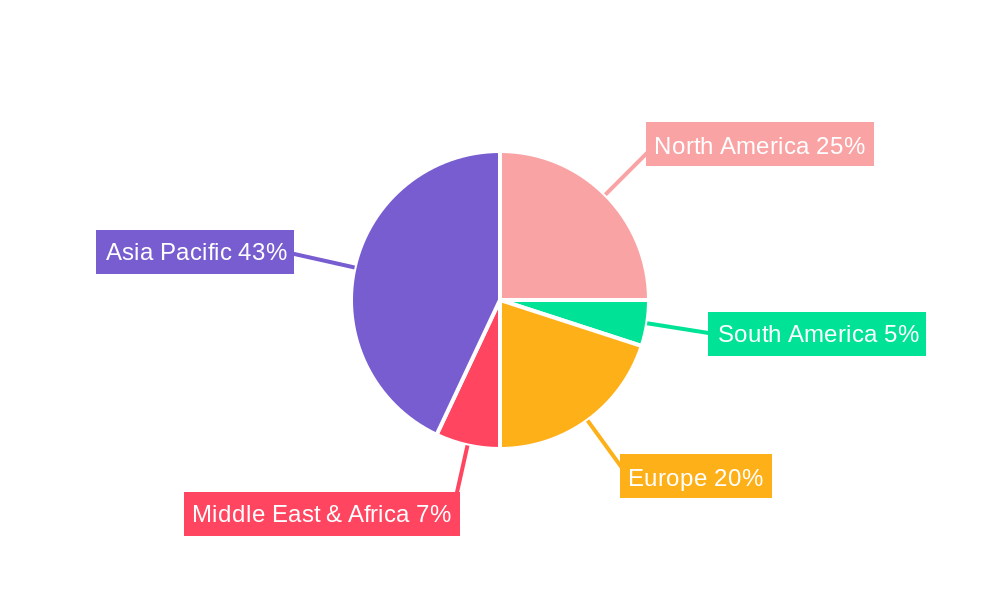
Clean Stocker Market Size (In Billion)
Market segmentation indicates a significant focus on solutions supporting higher wafer capacities, with the "Above 100ea" segment expected to lead, reflecting the large-scale production needs of leading semiconductor manufacturers. While "Below 50ea" and "50-100ea" segments will also see growth, they are likely to cater to niche applications and pilot production lines. Leading players like DAIFUKU, Murata Machinery, and SFA Engineering Corporation are driving innovation through substantial R&D investments in integrated, automated, and highly efficient clean stocker systems. Geographically, the Asia Pacific region, particularly China, India, and South Korea, is anticipated to be the largest and fastest-growing market, due to its established and expanding semiconductor manufacturing base. North America and Europe also offer significant opportunities, driven by advanced technological infrastructure and a focus on high-value semiconductor production. However, potential restraints include high initial investment costs for advanced clean stocker systems and stringent regulatory compliance requirements, which may moderate adoption rates for smaller players.
Clean Stocker Company Market Share
Clean Stocker Market Concentration & Innovation
The global Clean Stocker market is characterized by a moderate to high concentration, with key players like DAIFUKU, Murata Machinery, SFA Engineering Corporation, Mirle Automation, and SMCore leading the charge. Innovation remains a critical differentiator, driven by the escalating demands of the semiconductor and PFD (Process Flow Distribution) industries for enhanced precision, throughput, and contamination control. Regulatory frameworks, particularly those focused on cleanroom standards and environmental impact, are increasingly influencing product design and manufacturing processes, acting as both a driver for advanced solutions and a barrier for less compliant entities. Product substitutes, such as manual handling or less sophisticated automated systems, are rapidly being phased out as efficiency and quality imperatives intensify. End-user trends are strongly leaning towards higher throughput solutions, with a notable shift towards stocker types capable of handling above 100ea units to optimize factory floor space and operational efficiency. Mergers and acquisitions (M&A) are playing a significant role in market consolidation, with estimated deal values in the multi-million dollar range as larger players seek to acquire innovative technologies and expand their market reach. For instance, significant M&A activities are anticipated within the study period of 2019–2033, aimed at capturing market share and technological leadership.
Clean Stocker Industry Trends & Insights
The Clean Stocker market is poised for robust growth, projected to witness a significant Compound Annual Growth Rate (CAGR) over the forecast period of 2025–2033. This expansion is primarily fueled by the insatiable demand from the semiconductor industry, which is experiencing unprecedented expansion driven by advancements in AI, IoT, and 5G technologies. The increasing complexity and miniaturization of semiconductor components necessitate highly precise and contamination-free material handling, making advanced clean stocker solutions indispensable. Furthermore, the Process Flow Distribution (PFD) sector is also contributing to market penetration as manufacturers strive for greater efficiency and reduced cycle times in their production lines. Technological disruptions are at the forefront of this evolution, with a significant focus on the development of intelligent stockers that incorporate AI-driven path optimization, predictive maintenance, and enhanced sensing capabilities to minimize downtime and maximize yield. Consumer preferences, or rather end-user demands, are shifting towards higher capacity stockers, with a clear trend towards "Above 100ea" solutions to achieve economies of scale and optimize facility footprints. Competitive dynamics are intensifying, with companies like Avaco, SYNUS Tech, Linkwise Technology, Beijing Sineva, Suzhou Zooming, CASTEC International Corp, Meetfuture Tech, and Contrel Technology vying for market dominance through continuous product innovation and strategic partnerships. The market penetration of highly automated clean stocker systems is expected to surge as industries recognize their critical role in ensuring product quality and operational continuity. The base year of 2025 marks a significant inflection point, with considerable investments anticipated in R&D and capacity expansion to meet future demand.
Dominant Markets & Segments in Clean Stocker
The semiconductor application segment unequivocally dominates the global Clean Stocker market. This dominance is driven by the sheer scale of the semiconductor industry's capital expenditure and its unwavering commitment to ultra-high purity environments. The relentless pursuit of smaller node technologies and the increasing complexity of integrated circuits demand meticulously controlled handling processes, where even the slightest contamination can lead to catastrophic yield losses amounting to millions of dollars per wafer. Countries like South Korea, Taiwan, the United States, and China, which are major hubs for semiconductor manufacturing, represent the leading regional markets. Economic policies in these regions, such as government incentives for advanced manufacturing and R&D tax credits, further bolster the adoption of sophisticated clean stocker solutions. Infrastructure development, including the establishment of massive semiconductor fabrication plants (fabs), directly translates into a higher demand for these automated handling systems.
Within the application segment, the "Above 100ea" type of clean stocker is experiencing the most significant growth and market penetration. This trend is a direct consequence of the need for increased throughput and optimized space utilization in high-volume manufacturing environments. As fab footprints become more valuable, manufacturers are opting for stockers that can handle a larger quantity of wafers or components per unit, thereby reducing the overall footprint required for material buffer storage. This shift is particularly evident in advanced packaging facilities and next-generation semiconductor fabs. The market penetration of "Above 100ea" solutions is driven by the clear economic advantages of handling larger batches, leading to reduced labor costs and improved operational efficiency, with potential cost savings in the tens of millions of dollars annually for large-scale operations.
Clean Stocker Product Developments
Product developments in the Clean Stocker market are focused on enhancing automation, precision, and data integration. Innovations include the integration of AI for real-time process monitoring and predictive maintenance, ensuring minimal downtime and maximizing operational uptime, estimated to save manufacturers millions in lost productivity. Advanced robotics and vision systems are being incorporated for highly precise wafer and substrate handling, mitigating the risk of damage and contamination. Furthermore, developments are geared towards modular and scalable designs, allowing for flexible integration into existing fab infrastructures and accommodating future expansion needs. These advancements contribute to significant competitive advantages by improving yield, reducing processing times, and enhancing overall manufacturing efficiency.
Report Scope & Segmentation Analysis
The Clean Stocker market is meticulously segmented by Application, including Semiconductor and PFD (Process Flow Distribution). Within these applications, the market is further categorized by Type, encompassing Below 50ea, 50-100ea, and Above 100ea stocker capacities. The Semiconductor segment, projected to hold a market size in the billions of dollars by 2033, is driven by intense R&D and manufacturing demands. The PFD segment, while smaller, is experiencing steady growth due to increasing automation in various industries. The "Above 100ea" stocker type is anticipated to exhibit the highest growth trajectory, reflecting a market size projected to reach billions by 2033, due to its superior space and cost efficiencies in high-volume manufacturing.
Key Drivers of Clean Stocker Growth
The Clean Stocker market's growth is propelled by several key drivers. Technological advancements, particularly in AI and robotics, are enabling higher levels of automation and precision, crucial for sensitive manufacturing processes in the semiconductor and PFD sectors. The escalating demand for semiconductors, fueled by emerging technologies like 5G, AI, and IoT, directly translates into increased fab capacity and, consequently, a greater need for clean stocker systems. Economic factors, such as global economic recovery and increased capital expenditure in manufacturing, are also contributing to market expansion. Furthermore, evolving regulatory landscapes, emphasizing stringent cleanroom standards and quality control, necessitate the adoption of advanced clean stocker solutions, ensuring compliance and preventing costly production errors.
Challenges in the Clean Stocker Sector
Despite its growth potential, the Clean Stocker sector faces significant challenges. High initial investment costs for advanced automated systems can be a barrier for smaller manufacturers, potentially costing millions in upfront capital. Stringent regulatory compliance, while a driver, also presents challenges in terms of adherence to evolving standards and the associated costs of implementing and maintaining such systems. Supply chain disruptions, particularly for specialized components, can lead to production delays and increased lead times, impacting project timelines and customer satisfaction, with potential financial implications in the millions. Intense competition among established players and emerging entrants puts pressure on pricing and necessitates continuous innovation to maintain market share.
Emerging Opportunities in Clean Stocker
Emerging opportunities within the Clean Stocker market are abundant. The rapid growth of the electric vehicle (EV) battery manufacturing sector presents a significant new application area for clean stocker solutions, requiring high levels of precision and automation. The increasing adoption of Industry 4.0 principles and the integration of smart factory concepts are creating demand for interconnected and data-driven stocker systems. Furthermore, the ongoing miniaturization and increased complexity of electronic components in consumer electronics and medical devices are driving the need for more sophisticated and smaller-footprint clean stocker designs. Geographically, emerging economies in Asia Pacific and Latin America are poised to become significant growth markets as they invest heavily in advanced manufacturing capabilities.
Leading Players in the Clean Stocker Market
- DAIFUKU
- Murata Machinery
- SFA Engineering Corporation
- Mirle Automation
- SMCore
- Avaco
- SYNUS Tech
- Linkwise Technology
- Beijing Sineva
- Suzhou Zooming
- CASTEC International Corp
- Meetfuture Tech
- Contrel Technology
Key Developments in Clean Stocker Industry
- 2023: DAIFUKU announces a major expansion of its clean automation solutions, investing millions in new R&D facilities to support the semiconductor industry.
- 2022: Murata Machinery unveils its latest generation of high-speed wafer handling stockers, boasting a capacity increase of 150ea and an estimated efficiency gain of 10% per production line.
- 2021: SFA Engineering Corporation secures a multi-million dollar contract for the supply of advanced PFD clean stocker systems to a leading European automotive manufacturer.
- 2020: Mirle Automation introduces an AI-powered predictive maintenance module for its clean stocker range, projected to reduce unplanned downtime by millions of dollars annually for users.
Strategic Outlook for Clean Stocker Market
The strategic outlook for the Clean Stocker market remains exceptionally strong, driven by the foundational growth of the semiconductor industry and the expanding applications in PFD. Continuous innovation in automation, AI integration, and advanced materials will be critical for players to maintain a competitive edge, with significant investments in R&D expected to yield millions in future revenue. The increasing demand for higher throughput and space-efficient solutions, particularly the "Above 100ea" segment, presents substantial growth catalysts. Strategic partnerships and potential M&A activities will likely shape the market landscape further, consolidating expertise and expanding global reach to capitalize on the multi-billion dollar market potential.
Clean Stocker Segmentation
-
1. Application
- 1.1. Semiconductor
- 1.2. PFD
-
2. Type
- 2.1. Below 50ea
- 2.2. 50-100ea
- 2.3. Above 100es
Clean Stocker Segmentation By Geography
-
1. North America
- 1.1. United States
- 1.2. Canada
- 1.3. Mexico
-
2. South America
- 2.1. Brazil
- 2.2. Argentina
- 2.3. Rest of South America
-
3. Europe
- 3.1. United Kingdom
- 3.2. Germany
- 3.3. France
- 3.4. Italy
- 3.5. Spain
- 3.6. Russia
- 3.7. Benelux
- 3.8. Nordics
- 3.9. Rest of Europe
-
4. Middle East & Africa
- 4.1. Turkey
- 4.2. Israel
- 4.3. GCC
- 4.4. North Africa
- 4.5. South Africa
- 4.6. Rest of Middle East & Africa
-
5. Asia Pacific
- 5.1. China
- 5.2. India
- 5.3. Japan
- 5.4. South Korea
- 5.5. ASEAN
- 5.6. Oceania
- 5.7. Rest of Asia Pacific
Clean Stocker Regional Market Share
Geographic Coverage of Clean Stocker
Clean Stocker REPORT HIGHLIGHTS
| Aspects | Details |
|---|---|
| Study Period | 2020-2034 |
| Base Year | 2025 |
| Estimated Year | 2026 |
| Forecast Period | 2026-2034 |
| Historical Period | 2020-2025 |
| Growth Rate | CAGR of 15.92% from 2020-2034 |
| Segmentation |
|
Table of Contents
- 1. Introduction
- 1.1. Research Scope
- 1.2. Market Segmentation
- 1.3. Research Methodology
- 1.4. Definitions and Assumptions
- 2. Executive Summary
- 2.1. Introduction
- 3. Market Dynamics
- 3.1. Introduction
- 3.2. Market Drivers
- 3.3. Market Restrains
- 3.4. Market Trends
- 4. Market Factor Analysis
- 4.1. Porters Five Forces
- 4.2. Supply/Value Chain
- 4.3. PESTEL analysis
- 4.4. Market Entropy
- 4.5. Patent/Trademark Analysis
- 5. Global Clean Stocker Analysis, Insights and Forecast, 2020-2032
- 5.1. Market Analysis, Insights and Forecast - by Application
- 5.1.1. Semiconductor
- 5.1.2. PFD
- 5.2. Market Analysis, Insights and Forecast - by Type
- 5.2.1. Below 50ea
- 5.2.2. 50-100ea
- 5.2.3. Above 100es
- 5.3. Market Analysis, Insights and Forecast - by Region
- 5.3.1. North America
- 5.3.2. South America
- 5.3.3. Europe
- 5.3.4. Middle East & Africa
- 5.3.5. Asia Pacific
- 5.1. Market Analysis, Insights and Forecast - by Application
- 6. North America Clean Stocker Analysis, Insights and Forecast, 2020-2032
- 6.1. Market Analysis, Insights and Forecast - by Application
- 6.1.1. Semiconductor
- 6.1.2. PFD
- 6.2. Market Analysis, Insights and Forecast - by Type
- 6.2.1. Below 50ea
- 6.2.2. 50-100ea
- 6.2.3. Above 100es
- 6.1. Market Analysis, Insights and Forecast - by Application
- 7. South America Clean Stocker Analysis, Insights and Forecast, 2020-2032
- 7.1. Market Analysis, Insights and Forecast - by Application
- 7.1.1. Semiconductor
- 7.1.2. PFD
- 7.2. Market Analysis, Insights and Forecast - by Type
- 7.2.1. Below 50ea
- 7.2.2. 50-100ea
- 7.2.3. Above 100es
- 7.1. Market Analysis, Insights and Forecast - by Application
- 8. Europe Clean Stocker Analysis, Insights and Forecast, 2020-2032
- 8.1. Market Analysis, Insights and Forecast - by Application
- 8.1.1. Semiconductor
- 8.1.2. PFD
- 8.2. Market Analysis, Insights and Forecast - by Type
- 8.2.1. Below 50ea
- 8.2.2. 50-100ea
- 8.2.3. Above 100es
- 8.1. Market Analysis, Insights and Forecast - by Application
- 9. Middle East & Africa Clean Stocker Analysis, Insights and Forecast, 2020-2032
- 9.1. Market Analysis, Insights and Forecast - by Application
- 9.1.1. Semiconductor
- 9.1.2. PFD
- 9.2. Market Analysis, Insights and Forecast - by Type
- 9.2.1. Below 50ea
- 9.2.2. 50-100ea
- 9.2.3. Above 100es
- 9.1. Market Analysis, Insights and Forecast - by Application
- 10. Asia Pacific Clean Stocker Analysis, Insights and Forecast, 2020-2032
- 10.1. Market Analysis, Insights and Forecast - by Application
- 10.1.1. Semiconductor
- 10.1.2. PFD
- 10.2. Market Analysis, Insights and Forecast - by Type
- 10.2.1. Below 50ea
- 10.2.2. 50-100ea
- 10.2.3. Above 100es
- 10.1. Market Analysis, Insights and Forecast - by Application
- 11. Competitive Analysis
- 11.1. Global Market Share Analysis 2025
- 11.2. Company Profiles
- 11.2.1 DAIFUKU
- 11.2.1.1. Overview
- 11.2.1.2. Products
- 11.2.1.3. SWOT Analysis
- 11.2.1.4. Recent Developments
- 11.2.1.5. Financials (Based on Availability)
- 11.2.2 Murata Machinery
- 11.2.2.1. Overview
- 11.2.2.2. Products
- 11.2.2.3. SWOT Analysis
- 11.2.2.4. Recent Developments
- 11.2.2.5. Financials (Based on Availability)
- 11.2.3 SFA Engineering Corporation
- 11.2.3.1. Overview
- 11.2.3.2. Products
- 11.2.3.3. SWOT Analysis
- 11.2.3.4. Recent Developments
- 11.2.3.5. Financials (Based on Availability)
- 11.2.4 Mirle Automation
- 11.2.4.1. Overview
- 11.2.4.2. Products
- 11.2.4.3. SWOT Analysis
- 11.2.4.4. Recent Developments
- 11.2.4.5. Financials (Based on Availability)
- 11.2.5 SMCore
- 11.2.5.1. Overview
- 11.2.5.2. Products
- 11.2.5.3. SWOT Analysis
- 11.2.5.4. Recent Developments
- 11.2.5.5. Financials (Based on Availability)
- 11.2.6 Avaco
- 11.2.6.1. Overview
- 11.2.6.2. Products
- 11.2.6.3. SWOT Analysis
- 11.2.6.4. Recent Developments
- 11.2.6.5. Financials (Based on Availability)
- 11.2.7 SYNUS Tech
- 11.2.7.1. Overview
- 11.2.7.2. Products
- 11.2.7.3. SWOT Analysis
- 11.2.7.4. Recent Developments
- 11.2.7.5. Financials (Based on Availability)
- 11.2.8 Linkwise Technology
- 11.2.8.1. Overview
- 11.2.8.2. Products
- 11.2.8.3. SWOT Analysis
- 11.2.8.4. Recent Developments
- 11.2.8.5. Financials (Based on Availability)
- 11.2.9 Beijing Sineva
- 11.2.9.1. Overview
- 11.2.9.2. Products
- 11.2.9.3. SWOT Analysis
- 11.2.9.4. Recent Developments
- 11.2.9.5. Financials (Based on Availability)
- 11.2.10 Suzhou Zooming
- 11.2.10.1. Overview
- 11.2.10.2. Products
- 11.2.10.3. SWOT Analysis
- 11.2.10.4. Recent Developments
- 11.2.10.5. Financials (Based on Availability)
- 11.2.11 CASTEC International Corp
- 11.2.11.1. Overview
- 11.2.11.2. Products
- 11.2.11.3. SWOT Analysis
- 11.2.11.4. Recent Developments
- 11.2.11.5. Financials (Based on Availability)
- 11.2.12 Meetfuture Tech
- 11.2.12.1. Overview
- 11.2.12.2. Products
- 11.2.12.3. SWOT Analysis
- 11.2.12.4. Recent Developments
- 11.2.12.5. Financials (Based on Availability)
- 11.2.13 Contrel Technology
- 11.2.13.1. Overview
- 11.2.13.2. Products
- 11.2.13.3. SWOT Analysis
- 11.2.13.4. Recent Developments
- 11.2.13.5. Financials (Based on Availability)
- 11.2.1 DAIFUKU
List of Figures
- Figure 1: Global Clean Stocker Revenue Breakdown (billion, %) by Region 2025 & 2033
- Figure 2: North America Clean Stocker Revenue (billion), by Application 2025 & 2033
- Figure 3: North America Clean Stocker Revenue Share (%), by Application 2025 & 2033
- Figure 4: North America Clean Stocker Revenue (billion), by Type 2025 & 2033
- Figure 5: North America Clean Stocker Revenue Share (%), by Type 2025 & 2033
- Figure 6: North America Clean Stocker Revenue (billion), by Country 2025 & 2033
- Figure 7: North America Clean Stocker Revenue Share (%), by Country 2025 & 2033
- Figure 8: South America Clean Stocker Revenue (billion), by Application 2025 & 2033
- Figure 9: South America Clean Stocker Revenue Share (%), by Application 2025 & 2033
- Figure 10: South America Clean Stocker Revenue (billion), by Type 2025 & 2033
- Figure 11: South America Clean Stocker Revenue Share (%), by Type 2025 & 2033
- Figure 12: South America Clean Stocker Revenue (billion), by Country 2025 & 2033
- Figure 13: South America Clean Stocker Revenue Share (%), by Country 2025 & 2033
- Figure 14: Europe Clean Stocker Revenue (billion), by Application 2025 & 2033
- Figure 15: Europe Clean Stocker Revenue Share (%), by Application 2025 & 2033
- Figure 16: Europe Clean Stocker Revenue (billion), by Type 2025 & 2033
- Figure 17: Europe Clean Stocker Revenue Share (%), by Type 2025 & 2033
- Figure 18: Europe Clean Stocker Revenue (billion), by Country 2025 & 2033
- Figure 19: Europe Clean Stocker Revenue Share (%), by Country 2025 & 2033
- Figure 20: Middle East & Africa Clean Stocker Revenue (billion), by Application 2025 & 2033
- Figure 21: Middle East & Africa Clean Stocker Revenue Share (%), by Application 2025 & 2033
- Figure 22: Middle East & Africa Clean Stocker Revenue (billion), by Type 2025 & 2033
- Figure 23: Middle East & Africa Clean Stocker Revenue Share (%), by Type 2025 & 2033
- Figure 24: Middle East & Africa Clean Stocker Revenue (billion), by Country 2025 & 2033
- Figure 25: Middle East & Africa Clean Stocker Revenue Share (%), by Country 2025 & 2033
- Figure 26: Asia Pacific Clean Stocker Revenue (billion), by Application 2025 & 2033
- Figure 27: Asia Pacific Clean Stocker Revenue Share (%), by Application 2025 & 2033
- Figure 28: Asia Pacific Clean Stocker Revenue (billion), by Type 2025 & 2033
- Figure 29: Asia Pacific Clean Stocker Revenue Share (%), by Type 2025 & 2033
- Figure 30: Asia Pacific Clean Stocker Revenue (billion), by Country 2025 & 2033
- Figure 31: Asia Pacific Clean Stocker Revenue Share (%), by Country 2025 & 2033
List of Tables
- Table 1: Global Clean Stocker Revenue billion Forecast, by Application 2020 & 2033
- Table 2: Global Clean Stocker Revenue billion Forecast, by Type 2020 & 2033
- Table 3: Global Clean Stocker Revenue billion Forecast, by Region 2020 & 2033
- Table 4: Global Clean Stocker Revenue billion Forecast, by Application 2020 & 2033
- Table 5: Global Clean Stocker Revenue billion Forecast, by Type 2020 & 2033
- Table 6: Global Clean Stocker Revenue billion Forecast, by Country 2020 & 2033
- Table 7: United States Clean Stocker Revenue (billion) Forecast, by Application 2020 & 2033
- Table 8: Canada Clean Stocker Revenue (billion) Forecast, by Application 2020 & 2033
- Table 9: Mexico Clean Stocker Revenue (billion) Forecast, by Application 2020 & 2033
- Table 10: Global Clean Stocker Revenue billion Forecast, by Application 2020 & 2033
- Table 11: Global Clean Stocker Revenue billion Forecast, by Type 2020 & 2033
- Table 12: Global Clean Stocker Revenue billion Forecast, by Country 2020 & 2033
- Table 13: Brazil Clean Stocker Revenue (billion) Forecast, by Application 2020 & 2033
- Table 14: Argentina Clean Stocker Revenue (billion) Forecast, by Application 2020 & 2033
- Table 15: Rest of South America Clean Stocker Revenue (billion) Forecast, by Application 2020 & 2033
- Table 16: Global Clean Stocker Revenue billion Forecast, by Application 2020 & 2033
- Table 17: Global Clean Stocker Revenue billion Forecast, by Type 2020 & 2033
- Table 18: Global Clean Stocker Revenue billion Forecast, by Country 2020 & 2033
- Table 19: United Kingdom Clean Stocker Revenue (billion) Forecast, by Application 2020 & 2033
- Table 20: Germany Clean Stocker Revenue (billion) Forecast, by Application 2020 & 2033
- Table 21: France Clean Stocker Revenue (billion) Forecast, by Application 2020 & 2033
- Table 22: Italy Clean Stocker Revenue (billion) Forecast, by Application 2020 & 2033
- Table 23: Spain Clean Stocker Revenue (billion) Forecast, by Application 2020 & 2033
- Table 24: Russia Clean Stocker Revenue (billion) Forecast, by Application 2020 & 2033
- Table 25: Benelux Clean Stocker Revenue (billion) Forecast, by Application 2020 & 2033
- Table 26: Nordics Clean Stocker Revenue (billion) Forecast, by Application 2020 & 2033
- Table 27: Rest of Europe Clean Stocker Revenue (billion) Forecast, by Application 2020 & 2033
- Table 28: Global Clean Stocker Revenue billion Forecast, by Application 2020 & 2033
- Table 29: Global Clean Stocker Revenue billion Forecast, by Type 2020 & 2033
- Table 30: Global Clean Stocker Revenue billion Forecast, by Country 2020 & 2033
- Table 31: Turkey Clean Stocker Revenue (billion) Forecast, by Application 2020 & 2033
- Table 32: Israel Clean Stocker Revenue (billion) Forecast, by Application 2020 & 2033
- Table 33: GCC Clean Stocker Revenue (billion) Forecast, by Application 2020 & 2033
- Table 34: North Africa Clean Stocker Revenue (billion) Forecast, by Application 2020 & 2033
- Table 35: South Africa Clean Stocker Revenue (billion) Forecast, by Application 2020 & 2033
- Table 36: Rest of Middle East & Africa Clean Stocker Revenue (billion) Forecast, by Application 2020 & 2033
- Table 37: Global Clean Stocker Revenue billion Forecast, by Application 2020 & 2033
- Table 38: Global Clean Stocker Revenue billion Forecast, by Type 2020 & 2033
- Table 39: Global Clean Stocker Revenue billion Forecast, by Country 2020 & 2033
- Table 40: China Clean Stocker Revenue (billion) Forecast, by Application 2020 & 2033
- Table 41: India Clean Stocker Revenue (billion) Forecast, by Application 2020 & 2033
- Table 42: Japan Clean Stocker Revenue (billion) Forecast, by Application 2020 & 2033
- Table 43: South Korea Clean Stocker Revenue (billion) Forecast, by Application 2020 & 2033
- Table 44: ASEAN Clean Stocker Revenue (billion) Forecast, by Application 2020 & 2033
- Table 45: Oceania Clean Stocker Revenue (billion) Forecast, by Application 2020 & 2033
- Table 46: Rest of Asia Pacific Clean Stocker Revenue (billion) Forecast, by Application 2020 & 2033
Frequently Asked Questions
1. What is the projected Compound Annual Growth Rate (CAGR) of the Clean Stocker?
The projected CAGR is approximately 15.92%.
2. Which companies are prominent players in the Clean Stocker?
Key companies in the market include DAIFUKU, Murata Machinery, SFA Engineering Corporation, Mirle Automation, SMCore, Avaco, SYNUS Tech, Linkwise Technology, Beijing Sineva, Suzhou Zooming, CASTEC International Corp, Meetfuture Tech, Contrel Technology.
3. What are the main segments of the Clean Stocker?
The market segments include Application, Type.
4. Can you provide details about the market size?
The market size is estimated to be USD 5.64 billion as of 2022.
5. What are some drivers contributing to market growth?
N/A
6. What are the notable trends driving market growth?
N/A
7. Are there any restraints impacting market growth?
N/A
8. Can you provide examples of recent developments in the market?
N/A
9. What pricing options are available for accessing the report?
Pricing options include single-user, multi-user, and enterprise licenses priced at USD 2900.00, USD 4350.00, and USD 5800.00 respectively.
10. Is the market size provided in terms of value or volume?
The market size is provided in terms of value, measured in billion.
11. Are there any specific market keywords associated with the report?
Yes, the market keyword associated with the report is "Clean Stocker," which aids in identifying and referencing the specific market segment covered.
12. How do I determine which pricing option suits my needs best?
The pricing options vary based on user requirements and access needs. Individual users may opt for single-user licenses, while businesses requiring broader access may choose multi-user or enterprise licenses for cost-effective access to the report.
13. Are there any additional resources or data provided in the Clean Stocker report?
While the report offers comprehensive insights, it's advisable to review the specific contents or supplementary materials provided to ascertain if additional resources or data are available.
14. How can I stay updated on further developments or reports in the Clean Stocker?
To stay informed about further developments, trends, and reports in the Clean Stocker, consider subscribing to industry newsletters, following relevant companies and organizations, or regularly checking reputable industry news sources and publications.
Methodology
Step 1 - Identification of Relevant Samples Size from Population Database


Step 2 - Approaches for Defining Global Market Size (Value, Volume* & Price*)

Note*: In applicable scenarios
Step 3 - Data Sources
Primary Research
- Web Analytics
- Survey Reports
- Research Institute
- Latest Research Reports
- Opinion Leaders
Secondary Research
- Annual Reports
- White Paper
- Latest Press Release
- Industry Association
- Paid Database
- Investor Presentations

Step 4 - Data Triangulation
Involves using different sources of information in order to increase the validity of a study
These sources are likely to be stakeholders in a program - participants, other researchers, program staff, other community members, and so on.
Then we put all data in single framework & apply various statistical tools to find out the dynamic on the market.
During the analysis stage, feedback from the stakeholder groups would be compared to determine areas of agreement as well as areas of divergence