

Key Insights
The global market for cleanroom clothing is projected to reach an estimated $449 million by 2025, exhibiting a robust 4% CAGR over the forecast period of 2025-2033. This growth is primarily fueled by the expanding pharmaceutical and biotechnology sectors, where stringent contamination control protocols are paramount for drug development, manufacturing, and research. The increasing demand for sterile environments in the medical device industry, driven by advancements in healthcare and a rising prevalence of chronic diseases, also significantly contributes to market expansion. Furthermore, the burgeoning electronics and semiconductor industries, necessitating dust-free and particle-free manufacturing processes, represent a substantial driver for cleanroom apparel. These sectors are continuously investing in advanced manufacturing facilities, thereby boosting the need for high-performance cleanroom garments.
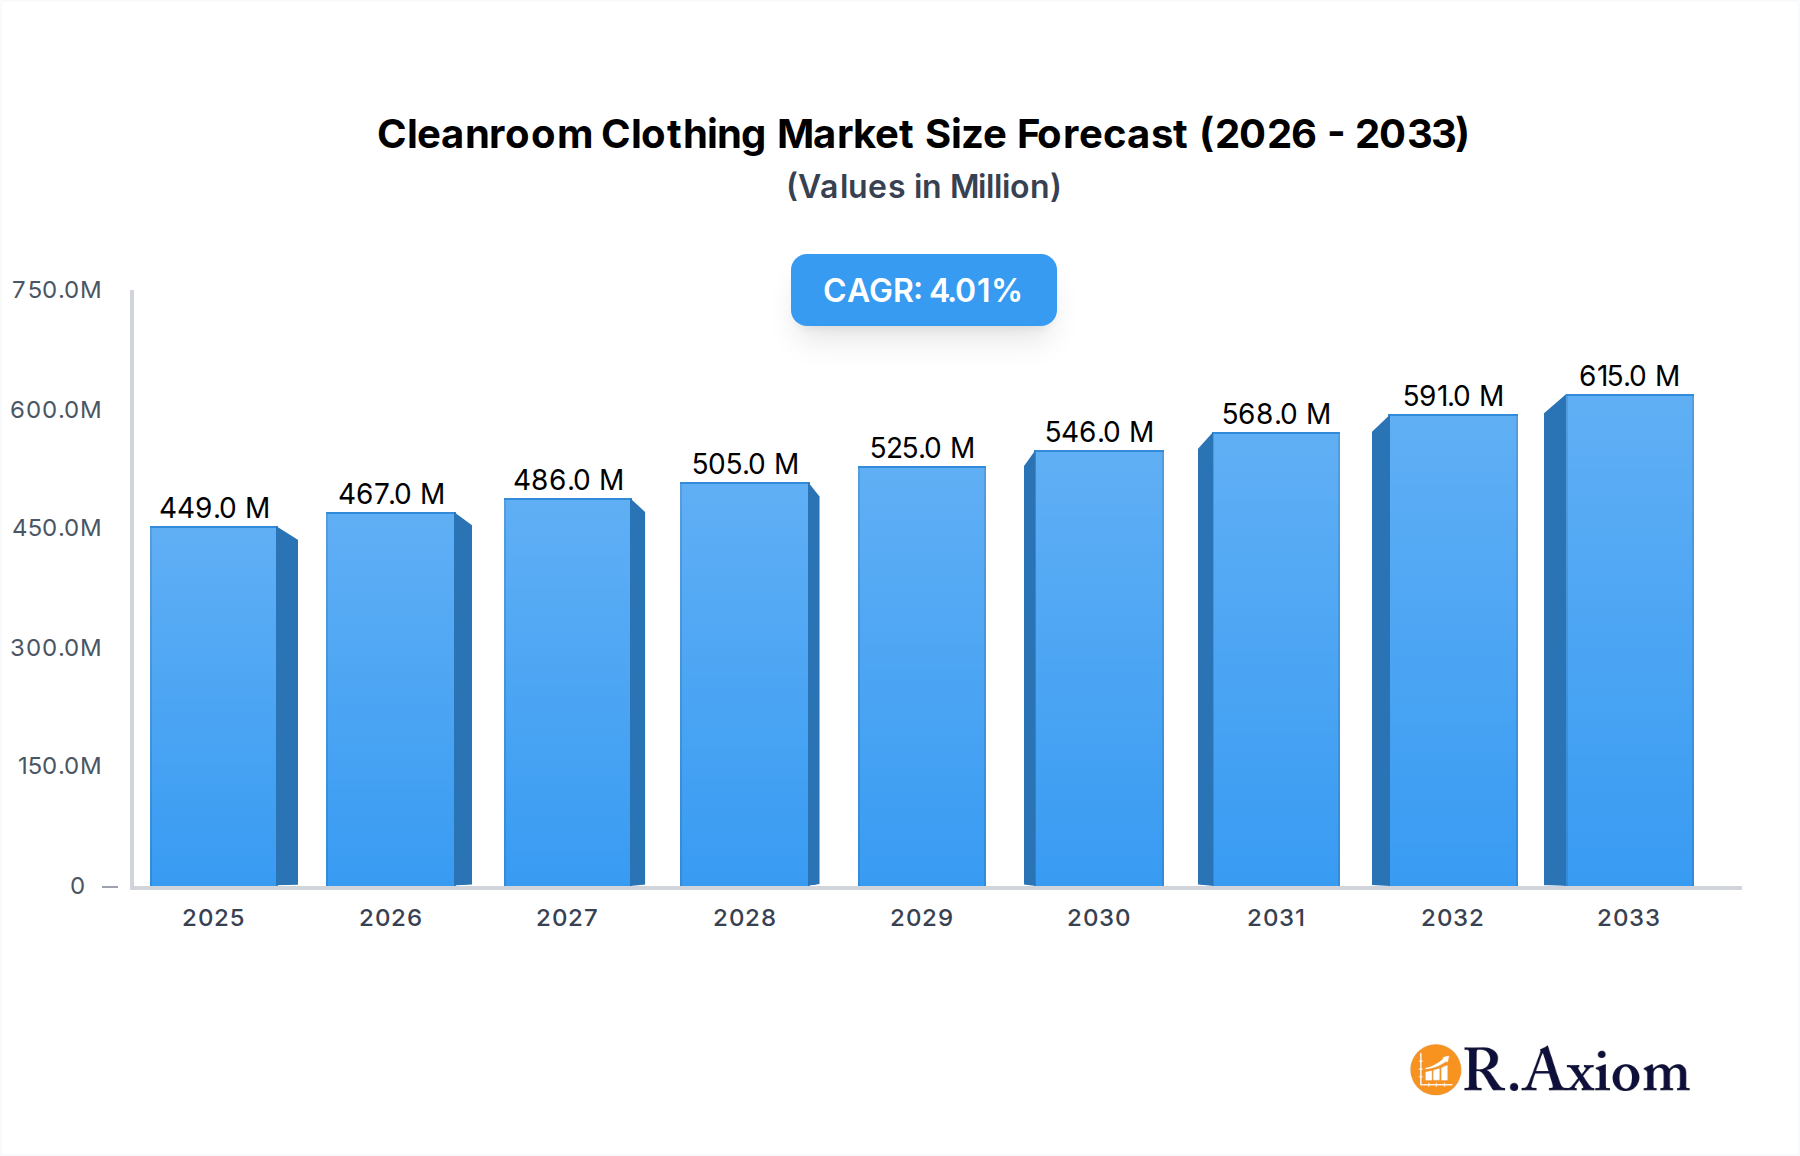
Cleanroom Clothing Market Size (In Million)
The market is characterized by a clear demand for both disposable and launderable types of cleanroom clothing. While disposable options offer convenience and eliminate cross-contamination risks, launderable garments provide a more sustainable and cost-effective solution for high-volume usage, particularly within established manufacturing operations. Key market trends include the development of advanced materials offering superior particle filtration, chemical resistance, and electrostatic discharge (ESD) properties, catering to the evolving needs of sensitive industries. However, the market faces certain restraints, including the high initial investment costs associated with establishing and maintaining cleanroom facilities and the availability of less stringent alternatives in certain low-risk applications. Despite these challenges, the increasing global focus on quality control, regulatory compliance, and the continuous innovation in cleanroom technology are expected to propel the market forward.

Cleanroom Clothing Company Market Share
This in-depth report offers a detailed analysis of the global cleanroom clothing market, providing critical insights for stakeholders across the electronic and semiconductor, pharmaceutical and biotechnology, and medical device industries. Covering the historical period of 2019-2024, the base and estimated year of 2025, and a robust forecast period of 2025-2033, this research illuminates market dynamics, key growth drivers, emerging opportunities, and the competitive landscape. With an estimated market size of over $5 million in the base year, the cleanroom clothing sector is poised for significant expansion, driven by stringent regulatory demands and the increasing need for contamination control in high-purity environments.
Cleanroom Clothing Market Concentration & Innovation
The global cleanroom clothing market exhibits a moderate level of concentration, with several key players dominating market share, estimated at over $3 million. Innovation remains a critical differentiator, fueled by advancements in material science, nanotechnology, and garment design to enhance particle shedding reduction and wearer comfort. Regulatory frameworks, particularly those governing pharmaceuticals and electronics manufacturing, play a pivotal role in shaping product development and market penetration, demanding compliance with stringent particle emission standards. Product substitutes, such as advanced sterilization techniques, present a potential challenge but are largely complementary to the essential protective function of cleanroom apparel. End-user trends are increasingly focused on sustainable materials, improved ergonomics, and integrated smart functionalities. Mergers and acquisitions (M&A) activity is anticipated to remain steady, with strategic acquisitions valued in the tens of millions aimed at expanding product portfolios and geographical reach, further influencing market concentration.
Cleanroom Clothing Industry Trends & Insights
The cleanroom clothing industry is experiencing robust growth, projected at a Compound Annual Growth Rate (CAGR) of approximately 6.5% during the forecast period. This expansion is primarily driven by the escalating demand for contamination-free environments across various high-technology sectors. The pharmaceutical and biotechnology industries, with their stringent requirements for sterile manufacturing processes, are significant contributors to this growth, accounting for an estimated 40% of market penetration. Similarly, the booming electronic and semiconductor sector, driven by the miniaturization of components and the production of sensitive microchips, necessitates advanced cleanroom apparel to prevent particulate contamination, representing another substantial market segment estimated at over 30% of the total market.
Technological disruptions are continuously reshaping the industry. Innovations in fabric technology, such as the development of low-shedding, antistatic, and chemically resistant materials, are paramount. Manufacturers are investing heavily in research and development to create garments that offer superior particle containment while ensuring wearer comfort and mobility, a key consumer preference. The adoption of disposable cleanroom clothing continues to rise due to its convenience and guaranteed sterility, particularly in critical applications where launderable options might pose a cross-contamination risk. However, launderable cleanroom clothing, while requiring a higher initial investment, offers a more sustainable and cost-effective solution for certain applications, with its market share estimated at over 35% of the total market.
Competitive dynamics are characterized by intense R&D efforts, strategic partnerships, and a focus on customized solutions for specific industry needs. Companies are differentiating themselves through superior product performance, compliance with international standards (e.g., ISO 14644), and a strong emphasis on customer service and technical support. The increasing complexity of manufacturing processes in sectors like advanced medical devices and quantum computing further amplifies the need for specialized cleanroom attire, creating new avenues for innovation and market growth. The overall market size is projected to exceed $10 million by 2033, underscoring the industry's significant economic impact.
Dominant Markets & Segments in Cleanroom Clothing
The Electronic and Semiconductor segment is a dominant force in the cleanroom clothing market, driven by an unyielding demand for ultra-clean manufacturing environments. The intricate nature of semiconductor fabrication, where even microscopic particles can render billions of dollars worth of products useless, necessitates the highest standards of cleanroom apparel. Economic policies supporting technological advancement and substantial infrastructure investments in semiconductor manufacturing hubs worldwide directly fuel the demand for specialized cleanroom suits, gloves, and accessories. The market penetration within this segment alone is estimated to be over 35% of the total market, with an annual growth rate exceeding 7%.
The Pharmaceutical and Biotechnology sector is another powerhouse within the cleanroom clothing market. Stringent regulatory mandates from bodies like the FDA and EMA dictate rigorous contamination control protocols throughout drug development, manufacturing, and packaging processes. The growing global demand for pharmaceuticals, coupled with the rise of biopharmaceuticals and advanced therapies, directly correlates with the need for sterile and particle-free environments. This segment's dominance is further solidified by the increasing complexity of sterile filling operations and the growing emphasis on preventing microbial contamination, contributing an estimated 30% to the overall market.
In terms of Types, Disposable cleanroom clothing holds a significant market share, estimated at over 60% of the total market. The inherent advantage of eliminating cross-contamination risks and the convenience of single-use applications in highly sensitive processes contribute to its widespread adoption. However, the Launderable segment, while smaller at approximately 40% market share, is experiencing steady growth due to its cost-effectiveness and sustainability benefits for less critical cleanroom applications, particularly in regions with established industrial laundry infrastructure.
Geographically, North America and Asia-Pacific are the leading regions in the cleanroom clothing market. North America's dominance stems from its advanced pharmaceutical and semiconductor industries, coupled with robust regulatory oversight. Asia-Pacific, particularly countries like China, South Korea, and Taiwan, is a rapidly growing hub for electronics manufacturing, driving substantial demand for cleanroom solutions. Favorable government initiatives promoting domestic manufacturing and significant foreign direct investment in high-tech industries are key drivers in these regions, with projected market values in the millions.
Cleanroom Clothing Product Developments
Recent product developments in the cleanroom clothing sector have focused on enhancing particle containment, wearer comfort, and material sustainability. Innovations include advanced multi-layer fabrics engineered for superior filtration of airborne particles, coupled with antistatic properties to prevent electrostatic discharge. The integration of micro-encapsulated antimicrobial agents in select garments offers an added layer of protection in pharmaceutical and medical environments. Furthermore, ergonomic designs and breathable materials are being prioritized to improve wearer comfort during extended use in controlled environments. These developments provide competitive advantages by addressing evolving industry needs for safety, efficiency, and compliance, with market adoption expected to drive sales in the millions.
Report Scope & Segmentation Analysis
This report meticulously analyzes the global cleanroom clothing market segmented by Application and Type. The Electronic and Semiconductor application segment is projected to witness a market size exceeding $4 million by 2033, driven by continuous advancements in microchip technology. The Pharmaceutical and Biotechnology segment, with its unwavering demand for sterile environments, is estimated to reach over $3 million in market value by 2033. The Medical Device Industry segment is expected to grow steadily, surpassing $1 million by the end of the forecast period, fueled by innovation in medical equipment. The Others segment, encompassing industries like aerospace and food processing, will contribute a growing market share.
Regarding Types, the Disposable cleanroom clothing segment is forecast to dominate, with a projected market size of over $6 million by 2033, due to its widespread adoption in critical applications for hygiene and contamination control. The Launderable cleanroom clothing segment, while smaller, is anticipated to reach a market size of over $4 million by 2033, offering a sustainable and cost-effective alternative for less stringent cleanroom environments. Growth projections for each segment are based on current market penetration rates and anticipated industry expansion, with competitive dynamics revolving around material innovation and cost-efficiency.
Key Drivers of Cleanroom Clothing Growth
The cleanroom clothing market is experiencing significant growth driven by several interconnected factors. Technological advancements in industries like electronics and pharmaceuticals demand increasingly stringent contamination control measures, directly boosting the need for high-performance cleanroom apparel. Economic growth in emerging economies has led to increased investment in manufacturing facilities requiring controlled environments. Furthermore, stringent regulatory frameworks imposed by global health and safety organizations mandate the use of specialized clothing to ensure product integrity and prevent contamination, especially in pharmaceutical and medical device manufacturing. The increasing complexity of research and development in biotechnology also fuels demand for advanced cleanroom solutions.
Challenges in the Cleanroom Clothing Sector
Despite its growth trajectory, the cleanroom clothing sector faces several challenges. Stringent regulatory compliance can be a significant barrier, requiring substantial investment in research, development, and certification processes. Supply chain disruptions, as witnessed in recent global events, can impact the availability and cost of raw materials, affecting production timelines and pricing. Intense competition from established players and new entrants necessitates continuous innovation and cost optimization to maintain market share. Furthermore, the perceived higher cost of high-performance cleanroom apparel compared to standard workwear can be a deterrent for some industries, necessitating a focus on demonstrating long-term value and ROI.
Emerging Opportunities in Cleanroom Clothing
The cleanroom clothing market is ripe with emerging opportunities. The development of smart textiles with integrated sensors for monitoring environmental conditions and wearer biometrics presents a significant avenue for innovation. The growing emphasis on sustainability is driving demand for eco-friendly and recyclable cleanroom apparel. Expansion into new geographical markets, particularly in developing regions with burgeoning high-tech industries, offers substantial growth potential. Furthermore, the increasing demand for specialized cleanroom solutions for niche applications, such as nanotechnology research and advanced cell therapy manufacturing, creates opportunities for tailored product development and market penetration.
Leading Players in the Cleanroom Clothing Market
- Ansell
- DuPont
- KM Corporation
- Worklon (Superior Uniform Group)
- 3M
- Kimberly-Clark
- Alpha Pro Tech
- Lakeland Inc
- Alsico High Tech
- Veltek Associates, Inc
- Uniform Technology (PIP)
- Micronclean
- Valutek
Key Developments in Cleanroom Clothing Industry
- 2023: DuPont launches a new line of advanced disposable cleanroom garments with enhanced particle filtration and chemical resistance for semiconductor manufacturing.
- 2023: Ansell expands its launderable cleanroom apparel portfolio with an emphasis on sustainable materials and improved durability.
- 2022: Kimberly-Clark introduces a novel, lightweight cleanroom suit designed for enhanced wearer comfort in pharmaceutical sterile manufacturing.
- 2021: 3M showcases innovative cleanroom tape and labeling solutions designed for critical environments, complementing their apparel offerings.
- 2020: Lakeland Inc acquires a specialized manufacturer of cleanroom gloves to broaden its product range and market reach.
Strategic Outlook for Cleanroom Clothing Market
The strategic outlook for the cleanroom clothing market is overwhelmingly positive, driven by continuous technological advancements and an ever-present demand for contamination control across critical industries. Future growth catalysts include the increasing adoption of advanced manufacturing processes, the development of smart cleanroom apparel, and a growing emphasis on sustainable and eco-friendly solutions. Companies that invest in research and development, focus on product differentiation, and strategically expand their global presence are well-positioned to capitalize on the substantial market potential estimated in the millions. The market's resilience and adaptability to evolving industry needs underscore its promising future.
Cleanroom Clothing Segmentation
-
1. Application
- 1.1. Electronic and Semiconductor
- 1.2. Pharmaceutical and Biotechnology
- 1.3. Medical Device Industry
- 1.4. Others
-
2. Types
- 2.1. Disposable
- 2.2. Launderable
Cleanroom Clothing Segmentation By Geography
-
1. North America
- 1.1. United States
- 1.2. Canada
- 1.3. Mexico
-
2. South America
- 2.1. Brazil
- 2.2. Argentina
- 2.3. Rest of South America
-
3. Europe
- 3.1. United Kingdom
- 3.2. Germany
- 3.3. France
- 3.4. Italy
- 3.5. Spain
- 3.6. Russia
- 3.7. Benelux
- 3.8. Nordics
- 3.9. Rest of Europe
-
4. Middle East & Africa
- 4.1. Turkey
- 4.2. Israel
- 4.3. GCC
- 4.4. North Africa
- 4.5. South Africa
- 4.6. Rest of Middle East & Africa
-
5. Asia Pacific
- 5.1. China
- 5.2. India
- 5.3. Japan
- 5.4. South Korea
- 5.5. ASEAN
- 5.6. Oceania
- 5.7. Rest of Asia Pacific
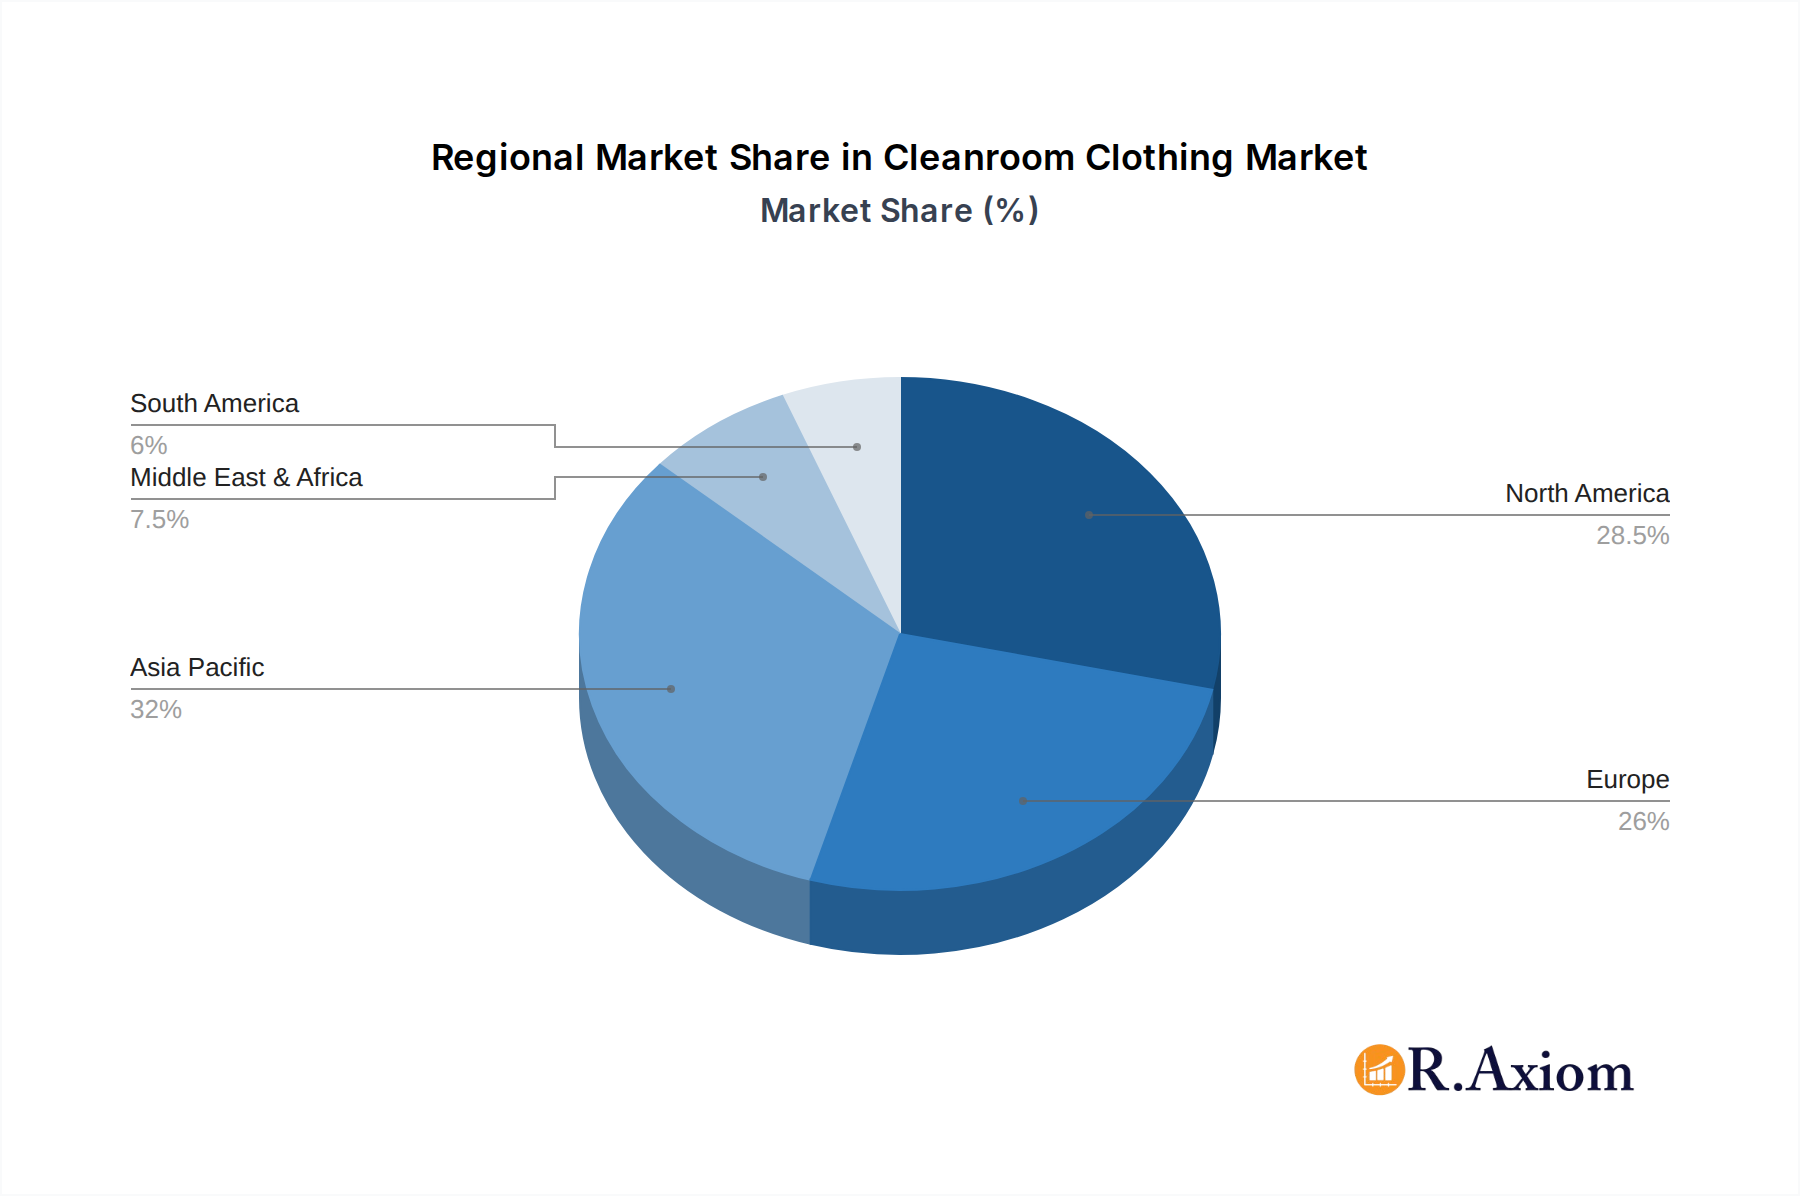
Cleanroom Clothing Regional Market Share
Geographic Coverage of Cleanroom Clothing
Cleanroom Clothing REPORT HIGHLIGHTS
| Aspects | Details |
|---|---|
| Study Period | 2020-2034 |
| Base Year | 2025 |
| Estimated Year | 2026 |
| Forecast Period | 2026-2034 |
| Historical Period | 2020-2025 |
| Growth Rate | CAGR of 4.1% from 2020-2034 |
| Segmentation |
|
Table of Contents
- 1. Introduction
- 1.1. Research Scope
- 1.2. Market Segmentation
- 1.3. Research Methodology
- 1.4. Definitions and Assumptions
- 2. Executive Summary
- 2.1. Introduction
- 3. Market Dynamics
- 3.1. Introduction
- 3.2. Market Drivers
- 3.3. Market Restrains
- 3.4. Market Trends
- 4. Market Factor Analysis
- 4.1. Porters Five Forces
- 4.2. Supply/Value Chain
- 4.3. PESTEL analysis
- 4.4. Market Entropy
- 4.5. Patent/Trademark Analysis
- 5. Global Cleanroom Clothing Analysis, Insights and Forecast, 2020-2032
- 5.1. Market Analysis, Insights and Forecast - by Application
- 5.1.1. Electronic and Semiconductor
- 5.1.2. Pharmaceutical and Biotechnology
- 5.1.3. Medical Device Industry
- 5.1.4. Others
- 5.2. Market Analysis, Insights and Forecast - by Types
- 5.2.1. Disposable
- 5.2.2. Launderable
- 5.3. Market Analysis, Insights and Forecast - by Region
- 5.3.1. North America
- 5.3.2. South America
- 5.3.3. Europe
- 5.3.4. Middle East & Africa
- 5.3.5. Asia Pacific
- 5.1. Market Analysis, Insights and Forecast - by Application
- 6. North America Cleanroom Clothing Analysis, Insights and Forecast, 2020-2032
- 6.1. Market Analysis, Insights and Forecast - by Application
- 6.1.1. Electronic and Semiconductor
- 6.1.2. Pharmaceutical and Biotechnology
- 6.1.3. Medical Device Industry
- 6.1.4. Others
- 6.2. Market Analysis, Insights and Forecast - by Types
- 6.2.1. Disposable
- 6.2.2. Launderable
- 6.1. Market Analysis, Insights and Forecast - by Application
- 7. South America Cleanroom Clothing Analysis, Insights and Forecast, 2020-2032
- 7.1. Market Analysis, Insights and Forecast - by Application
- 7.1.1. Electronic and Semiconductor
- 7.1.2. Pharmaceutical and Biotechnology
- 7.1.3. Medical Device Industry
- 7.1.4. Others
- 7.2. Market Analysis, Insights and Forecast - by Types
- 7.2.1. Disposable
- 7.2.2. Launderable
- 7.1. Market Analysis, Insights and Forecast - by Application
- 8. Europe Cleanroom Clothing Analysis, Insights and Forecast, 2020-2032
- 8.1. Market Analysis, Insights and Forecast - by Application
- 8.1.1. Electronic and Semiconductor
- 8.1.2. Pharmaceutical and Biotechnology
- 8.1.3. Medical Device Industry
- 8.1.4. Others
- 8.2. Market Analysis, Insights and Forecast - by Types
- 8.2.1. Disposable
- 8.2.2. Launderable
- 8.1. Market Analysis, Insights and Forecast - by Application
- 9. Middle East & Africa Cleanroom Clothing Analysis, Insights and Forecast, 2020-2032
- 9.1. Market Analysis, Insights and Forecast - by Application
- 9.1.1. Electronic and Semiconductor
- 9.1.2. Pharmaceutical and Biotechnology
- 9.1.3. Medical Device Industry
- 9.1.4. Others
- 9.2. Market Analysis, Insights and Forecast - by Types
- 9.2.1. Disposable
- 9.2.2. Launderable
- 9.1. Market Analysis, Insights and Forecast - by Application
- 10. Asia Pacific Cleanroom Clothing Analysis, Insights and Forecast, 2020-2032
- 10.1. Market Analysis, Insights and Forecast - by Application
- 10.1.1. Electronic and Semiconductor
- 10.1.2. Pharmaceutical and Biotechnology
- 10.1.3. Medical Device Industry
- 10.1.4. Others
- 10.2. Market Analysis, Insights and Forecast - by Types
- 10.2.1. Disposable
- 10.2.2. Launderable
- 10.1. Market Analysis, Insights and Forecast - by Application
- 11. Competitive Analysis
- 11.1. Global Market Share Analysis 2025
- 11.2. Company Profiles
- 11.2.1 Ansell
- 11.2.1.1. Overview
- 11.2.1.2. Products
- 11.2.1.3. SWOT Analysis
- 11.2.1.4. Recent Developments
- 11.2.1.5. Financials (Based on Availability)
- 11.2.2 DuPont
- 11.2.2.1. Overview
- 11.2.2.2. Products
- 11.2.2.3. SWOT Analysis
- 11.2.2.4. Recent Developments
- 11.2.2.5. Financials (Based on Availability)
- 11.2.3 KM Corporation
- 11.2.3.1. Overview
- 11.2.3.2. Products
- 11.2.3.3. SWOT Analysis
- 11.2.3.4. Recent Developments
- 11.2.3.5. Financials (Based on Availability)
- 11.2.4 Worklon (Superior Uniform Group)
- 11.2.4.1. Overview
- 11.2.4.2. Products
- 11.2.4.3. SWOT Analysis
- 11.2.4.4. Recent Developments
- 11.2.4.5. Financials (Based on Availability)
- 11.2.5 3M
- 11.2.5.1. Overview
- 11.2.5.2. Products
- 11.2.5.3. SWOT Analysis
- 11.2.5.4. Recent Developments
- 11.2.5.5. Financials (Based on Availability)
- 11.2.6 Kimberly-Clark
- 11.2.6.1. Overview
- 11.2.6.2. Products
- 11.2.6.3. SWOT Analysis
- 11.2.6.4. Recent Developments
- 11.2.6.5. Financials (Based on Availability)
- 11.2.7 Alpha Pro Tech
- 11.2.7.1. Overview
- 11.2.7.2. Products
- 11.2.7.3. SWOT Analysis
- 11.2.7.4. Recent Developments
- 11.2.7.5. Financials (Based on Availability)
- 11.2.8 Lakeland Inc
- 11.2.8.1. Overview
- 11.2.8.2. Products
- 11.2.8.3. SWOT Analysis
- 11.2.8.4. Recent Developments
- 11.2.8.5. Financials (Based on Availability)
- 11.2.9 Alsico High Tech
- 11.2.9.1. Overview
- 11.2.9.2. Products
- 11.2.9.3. SWOT Analysis
- 11.2.9.4. Recent Developments
- 11.2.9.5. Financials (Based on Availability)
- 11.2.10 Veltek Associates
- 11.2.10.1. Overview
- 11.2.10.2. Products
- 11.2.10.3. SWOT Analysis
- 11.2.10.4. Recent Developments
- 11.2.10.5. Financials (Based on Availability)
- 11.2.11 Inc
- 11.2.11.1. Overview
- 11.2.11.2. Products
- 11.2.11.3. SWOT Analysis
- 11.2.11.4. Recent Developments
- 11.2.11.5. Financials (Based on Availability)
- 11.2.12 Uniform Technology (PIP)
- 11.2.12.1. Overview
- 11.2.12.2. Products
- 11.2.12.3. SWOT Analysis
- 11.2.12.4. Recent Developments
- 11.2.12.5. Financials (Based on Availability)
- 11.2.13 Micronclean
- 11.2.13.1. Overview
- 11.2.13.2. Products
- 11.2.13.3. SWOT Analysis
- 11.2.13.4. Recent Developments
- 11.2.13.5. Financials (Based on Availability)
- 11.2.14 Valutek
- 11.2.14.1. Overview
- 11.2.14.2. Products
- 11.2.14.3. SWOT Analysis
- 11.2.14.4. Recent Developments
- 11.2.14.5. Financials (Based on Availability)
- 11.2.1 Ansell
List of Figures
- Figure 1: Global Cleanroom Clothing Revenue Breakdown (undefined, %) by Region 2025 & 2033
- Figure 2: Global Cleanroom Clothing Volume Breakdown (K, %) by Region 2025 & 2033
- Figure 3: North America Cleanroom Clothing Revenue (undefined), by Application 2025 & 2033
- Figure 4: North America Cleanroom Clothing Volume (K), by Application 2025 & 2033
- Figure 5: North America Cleanroom Clothing Revenue Share (%), by Application 2025 & 2033
- Figure 6: North America Cleanroom Clothing Volume Share (%), by Application 2025 & 2033
- Figure 7: North America Cleanroom Clothing Revenue (undefined), by Types 2025 & 2033
- Figure 8: North America Cleanroom Clothing Volume (K), by Types 2025 & 2033
- Figure 9: North America Cleanroom Clothing Revenue Share (%), by Types 2025 & 2033
- Figure 10: North America Cleanroom Clothing Volume Share (%), by Types 2025 & 2033
- Figure 11: North America Cleanroom Clothing Revenue (undefined), by Country 2025 & 2033
- Figure 12: North America Cleanroom Clothing Volume (K), by Country 2025 & 2033
- Figure 13: North America Cleanroom Clothing Revenue Share (%), by Country 2025 & 2033
- Figure 14: North America Cleanroom Clothing Volume Share (%), by Country 2025 & 2033
- Figure 15: South America Cleanroom Clothing Revenue (undefined), by Application 2025 & 2033
- Figure 16: South America Cleanroom Clothing Volume (K), by Application 2025 & 2033
- Figure 17: South America Cleanroom Clothing Revenue Share (%), by Application 2025 & 2033
- Figure 18: South America Cleanroom Clothing Volume Share (%), by Application 2025 & 2033
- Figure 19: South America Cleanroom Clothing Revenue (undefined), by Types 2025 & 2033
- Figure 20: South America Cleanroom Clothing Volume (K), by Types 2025 & 2033
- Figure 21: South America Cleanroom Clothing Revenue Share (%), by Types 2025 & 2033
- Figure 22: South America Cleanroom Clothing Volume Share (%), by Types 2025 & 2033
- Figure 23: South America Cleanroom Clothing Revenue (undefined), by Country 2025 & 2033
- Figure 24: South America Cleanroom Clothing Volume (K), by Country 2025 & 2033
- Figure 25: South America Cleanroom Clothing Revenue Share (%), by Country 2025 & 2033
- Figure 26: South America Cleanroom Clothing Volume Share (%), by Country 2025 & 2033
- Figure 27: Europe Cleanroom Clothing Revenue (undefined), by Application 2025 & 2033
- Figure 28: Europe Cleanroom Clothing Volume (K), by Application 2025 & 2033
- Figure 29: Europe Cleanroom Clothing Revenue Share (%), by Application 2025 & 2033
- Figure 30: Europe Cleanroom Clothing Volume Share (%), by Application 2025 & 2033
- Figure 31: Europe Cleanroom Clothing Revenue (undefined), by Types 2025 & 2033
- Figure 32: Europe Cleanroom Clothing Volume (K), by Types 2025 & 2033
- Figure 33: Europe Cleanroom Clothing Revenue Share (%), by Types 2025 & 2033
- Figure 34: Europe Cleanroom Clothing Volume Share (%), by Types 2025 & 2033
- Figure 35: Europe Cleanroom Clothing Revenue (undefined), by Country 2025 & 2033
- Figure 36: Europe Cleanroom Clothing Volume (K), by Country 2025 & 2033
- Figure 37: Europe Cleanroom Clothing Revenue Share (%), by Country 2025 & 2033
- Figure 38: Europe Cleanroom Clothing Volume Share (%), by Country 2025 & 2033
- Figure 39: Middle East & Africa Cleanroom Clothing Revenue (undefined), by Application 2025 & 2033
- Figure 40: Middle East & Africa Cleanroom Clothing Volume (K), by Application 2025 & 2033
- Figure 41: Middle East & Africa Cleanroom Clothing Revenue Share (%), by Application 2025 & 2033
- Figure 42: Middle East & Africa Cleanroom Clothing Volume Share (%), by Application 2025 & 2033
- Figure 43: Middle East & Africa Cleanroom Clothing Revenue (undefined), by Types 2025 & 2033
- Figure 44: Middle East & Africa Cleanroom Clothing Volume (K), by Types 2025 & 2033
- Figure 45: Middle East & Africa Cleanroom Clothing Revenue Share (%), by Types 2025 & 2033
- Figure 46: Middle East & Africa Cleanroom Clothing Volume Share (%), by Types 2025 & 2033
- Figure 47: Middle East & Africa Cleanroom Clothing Revenue (undefined), by Country 2025 & 2033
- Figure 48: Middle East & Africa Cleanroom Clothing Volume (K), by Country 2025 & 2033
- Figure 49: Middle East & Africa Cleanroom Clothing Revenue Share (%), by Country 2025 & 2033
- Figure 50: Middle East & Africa Cleanroom Clothing Volume Share (%), by Country 2025 & 2033
- Figure 51: Asia Pacific Cleanroom Clothing Revenue (undefined), by Application 2025 & 2033
- Figure 52: Asia Pacific Cleanroom Clothing Volume (K), by Application 2025 & 2033
- Figure 53: Asia Pacific Cleanroom Clothing Revenue Share (%), by Application 2025 & 2033
- Figure 54: Asia Pacific Cleanroom Clothing Volume Share (%), by Application 2025 & 2033
- Figure 55: Asia Pacific Cleanroom Clothing Revenue (undefined), by Types 2025 & 2033
- Figure 56: Asia Pacific Cleanroom Clothing Volume (K), by Types 2025 & 2033
- Figure 57: Asia Pacific Cleanroom Clothing Revenue Share (%), by Types 2025 & 2033
- Figure 58: Asia Pacific Cleanroom Clothing Volume Share (%), by Types 2025 & 2033
- Figure 59: Asia Pacific Cleanroom Clothing Revenue (undefined), by Country 2025 & 2033
- Figure 60: Asia Pacific Cleanroom Clothing Volume (K), by Country 2025 & 2033
- Figure 61: Asia Pacific Cleanroom Clothing Revenue Share (%), by Country 2025 & 2033
- Figure 62: Asia Pacific Cleanroom Clothing Volume Share (%), by Country 2025 & 2033
List of Tables
- Table 1: Global Cleanroom Clothing Revenue undefined Forecast, by Application 2020 & 2033
- Table 2: Global Cleanroom Clothing Volume K Forecast, by Application 2020 & 2033
- Table 3: Global Cleanroom Clothing Revenue undefined Forecast, by Types 2020 & 2033
- Table 4: Global Cleanroom Clothing Volume K Forecast, by Types 2020 & 2033
- Table 5: Global Cleanroom Clothing Revenue undefined Forecast, by Region 2020 & 2033
- Table 6: Global Cleanroom Clothing Volume K Forecast, by Region 2020 & 2033
- Table 7: Global Cleanroom Clothing Revenue undefined Forecast, by Application 2020 & 2033
- Table 8: Global Cleanroom Clothing Volume K Forecast, by Application 2020 & 2033
- Table 9: Global Cleanroom Clothing Revenue undefined Forecast, by Types 2020 & 2033
- Table 10: Global Cleanroom Clothing Volume K Forecast, by Types 2020 & 2033
- Table 11: Global Cleanroom Clothing Revenue undefined Forecast, by Country 2020 & 2033
- Table 12: Global Cleanroom Clothing Volume K Forecast, by Country 2020 & 2033
- Table 13: United States Cleanroom Clothing Revenue (undefined) Forecast, by Application 2020 & 2033
- Table 14: United States Cleanroom Clothing Volume (K) Forecast, by Application 2020 & 2033
- Table 15: Canada Cleanroom Clothing Revenue (undefined) Forecast, by Application 2020 & 2033
- Table 16: Canada Cleanroom Clothing Volume (K) Forecast, by Application 2020 & 2033
- Table 17: Mexico Cleanroom Clothing Revenue (undefined) Forecast, by Application 2020 & 2033
- Table 18: Mexico Cleanroom Clothing Volume (K) Forecast, by Application 2020 & 2033
- Table 19: Global Cleanroom Clothing Revenue undefined Forecast, by Application 2020 & 2033
- Table 20: Global Cleanroom Clothing Volume K Forecast, by Application 2020 & 2033
- Table 21: Global Cleanroom Clothing Revenue undefined Forecast, by Types 2020 & 2033
- Table 22: Global Cleanroom Clothing Volume K Forecast, by Types 2020 & 2033
- Table 23: Global Cleanroom Clothing Revenue undefined Forecast, by Country 2020 & 2033
- Table 24: Global Cleanroom Clothing Volume K Forecast, by Country 2020 & 2033
- Table 25: Brazil Cleanroom Clothing Revenue (undefined) Forecast, by Application 2020 & 2033
- Table 26: Brazil Cleanroom Clothing Volume (K) Forecast, by Application 2020 & 2033
- Table 27: Argentina Cleanroom Clothing Revenue (undefined) Forecast, by Application 2020 & 2033
- Table 28: Argentina Cleanroom Clothing Volume (K) Forecast, by Application 2020 & 2033
- Table 29: Rest of South America Cleanroom Clothing Revenue (undefined) Forecast, by Application 2020 & 2033
- Table 30: Rest of South America Cleanroom Clothing Volume (K) Forecast, by Application 2020 & 2033
- Table 31: Global Cleanroom Clothing Revenue undefined Forecast, by Application 2020 & 2033
- Table 32: Global Cleanroom Clothing Volume K Forecast, by Application 2020 & 2033
- Table 33: Global Cleanroom Clothing Revenue undefined Forecast, by Types 2020 & 2033
- Table 34: Global Cleanroom Clothing Volume K Forecast, by Types 2020 & 2033
- Table 35: Global Cleanroom Clothing Revenue undefined Forecast, by Country 2020 & 2033
- Table 36: Global Cleanroom Clothing Volume K Forecast, by Country 2020 & 2033
- Table 37: United Kingdom Cleanroom Clothing Revenue (undefined) Forecast, by Application 2020 & 2033
- Table 38: United Kingdom Cleanroom Clothing Volume (K) Forecast, by Application 2020 & 2033
- Table 39: Germany Cleanroom Clothing Revenue (undefined) Forecast, by Application 2020 & 2033
- Table 40: Germany Cleanroom Clothing Volume (K) Forecast, by Application 2020 & 2033
- Table 41: France Cleanroom Clothing Revenue (undefined) Forecast, by Application 2020 & 2033
- Table 42: France Cleanroom Clothing Volume (K) Forecast, by Application 2020 & 2033
- Table 43: Italy Cleanroom Clothing Revenue (undefined) Forecast, by Application 2020 & 2033
- Table 44: Italy Cleanroom Clothing Volume (K) Forecast, by Application 2020 & 2033
- Table 45: Spain Cleanroom Clothing Revenue (undefined) Forecast, by Application 2020 & 2033
- Table 46: Spain Cleanroom Clothing Volume (K) Forecast, by Application 2020 & 2033
- Table 47: Russia Cleanroom Clothing Revenue (undefined) Forecast, by Application 2020 & 2033
- Table 48: Russia Cleanroom Clothing Volume (K) Forecast, by Application 2020 & 2033
- Table 49: Benelux Cleanroom Clothing Revenue (undefined) Forecast, by Application 2020 & 2033
- Table 50: Benelux Cleanroom Clothing Volume (K) Forecast, by Application 2020 & 2033
- Table 51: Nordics Cleanroom Clothing Revenue (undefined) Forecast, by Application 2020 & 2033
- Table 52: Nordics Cleanroom Clothing Volume (K) Forecast, by Application 2020 & 2033
- Table 53: Rest of Europe Cleanroom Clothing Revenue (undefined) Forecast, by Application 2020 & 2033
- Table 54: Rest of Europe Cleanroom Clothing Volume (K) Forecast, by Application 2020 & 2033
- Table 55: Global Cleanroom Clothing Revenue undefined Forecast, by Application 2020 & 2033
- Table 56: Global Cleanroom Clothing Volume K Forecast, by Application 2020 & 2033
- Table 57: Global Cleanroom Clothing Revenue undefined Forecast, by Types 2020 & 2033
- Table 58: Global Cleanroom Clothing Volume K Forecast, by Types 2020 & 2033
- Table 59: Global Cleanroom Clothing Revenue undefined Forecast, by Country 2020 & 2033
- Table 60: Global Cleanroom Clothing Volume K Forecast, by Country 2020 & 2033
- Table 61: Turkey Cleanroom Clothing Revenue (undefined) Forecast, by Application 2020 & 2033
- Table 62: Turkey Cleanroom Clothing Volume (K) Forecast, by Application 2020 & 2033
- Table 63: Israel Cleanroom Clothing Revenue (undefined) Forecast, by Application 2020 & 2033
- Table 64: Israel Cleanroom Clothing Volume (K) Forecast, by Application 2020 & 2033
- Table 65: GCC Cleanroom Clothing Revenue (undefined) Forecast, by Application 2020 & 2033
- Table 66: GCC Cleanroom Clothing Volume (K) Forecast, by Application 2020 & 2033
- Table 67: North Africa Cleanroom Clothing Revenue (undefined) Forecast, by Application 2020 & 2033
- Table 68: North Africa Cleanroom Clothing Volume (K) Forecast, by Application 2020 & 2033
- Table 69: South Africa Cleanroom Clothing Revenue (undefined) Forecast, by Application 2020 & 2033
- Table 70: South Africa Cleanroom Clothing Volume (K) Forecast, by Application 2020 & 2033
- Table 71: Rest of Middle East & Africa Cleanroom Clothing Revenue (undefined) Forecast, by Application 2020 & 2033
- Table 72: Rest of Middle East & Africa Cleanroom Clothing Volume (K) Forecast, by Application 2020 & 2033
- Table 73: Global Cleanroom Clothing Revenue undefined Forecast, by Application 2020 & 2033
- Table 74: Global Cleanroom Clothing Volume K Forecast, by Application 2020 & 2033
- Table 75: Global Cleanroom Clothing Revenue undefined Forecast, by Types 2020 & 2033
- Table 76: Global Cleanroom Clothing Volume K Forecast, by Types 2020 & 2033
- Table 77: Global Cleanroom Clothing Revenue undefined Forecast, by Country 2020 & 2033
- Table 78: Global Cleanroom Clothing Volume K Forecast, by Country 2020 & 2033
- Table 79: China Cleanroom Clothing Revenue (undefined) Forecast, by Application 2020 & 2033
- Table 80: China Cleanroom Clothing Volume (K) Forecast, by Application 2020 & 2033
- Table 81: India Cleanroom Clothing Revenue (undefined) Forecast, by Application 2020 & 2033
- Table 82: India Cleanroom Clothing Volume (K) Forecast, by Application 2020 & 2033
- Table 83: Japan Cleanroom Clothing Revenue (undefined) Forecast, by Application 2020 & 2033
- Table 84: Japan Cleanroom Clothing Volume (K) Forecast, by Application 2020 & 2033
- Table 85: South Korea Cleanroom Clothing Revenue (undefined) Forecast, by Application 2020 & 2033
- Table 86: South Korea Cleanroom Clothing Volume (K) Forecast, by Application 2020 & 2033
- Table 87: ASEAN Cleanroom Clothing Revenue (undefined) Forecast, by Application 2020 & 2033
- Table 88: ASEAN Cleanroom Clothing Volume (K) Forecast, by Application 2020 & 2033
- Table 89: Oceania Cleanroom Clothing Revenue (undefined) Forecast, by Application 2020 & 2033
- Table 90: Oceania Cleanroom Clothing Volume (K) Forecast, by Application 2020 & 2033
- Table 91: Rest of Asia Pacific Cleanroom Clothing Revenue (undefined) Forecast, by Application 2020 & 2033
- Table 92: Rest of Asia Pacific Cleanroom Clothing Volume (K) Forecast, by Application 2020 & 2033
Frequently Asked Questions
1. What is the projected Compound Annual Growth Rate (CAGR) of the Cleanroom Clothing?
The projected CAGR is approximately 4.1%.
2. Which companies are prominent players in the Cleanroom Clothing?
Key companies in the market include Ansell, DuPont, KM Corporation, Worklon (Superior Uniform Group), 3M, Kimberly-Clark, Alpha Pro Tech, Lakeland Inc, Alsico High Tech, Veltek Associates, Inc, Uniform Technology (PIP), Micronclean, Valutek.
3. What are the main segments of the Cleanroom Clothing?
The market segments include Application, Types.
4. Can you provide details about the market size?
The market size is estimated to be USD XXX N/A as of 2022.
5. What are some drivers contributing to market growth?
N/A
6. What are the notable trends driving market growth?
N/A
7. Are there any restraints impacting market growth?
N/A
8. Can you provide examples of recent developments in the market?
N/A
9. What pricing options are available for accessing the report?
Pricing options include single-user, multi-user, and enterprise licenses priced at USD 3350.00, USD 5025.00, and USD 6700.00 respectively.
10. Is the market size provided in terms of value or volume?
The market size is provided in terms of value, measured in N/A and volume, measured in K.
11. Are there any specific market keywords associated with the report?
Yes, the market keyword associated with the report is "Cleanroom Clothing," which aids in identifying and referencing the specific market segment covered.
12. How do I determine which pricing option suits my needs best?
The pricing options vary based on user requirements and access needs. Individual users may opt for single-user licenses, while businesses requiring broader access may choose multi-user or enterprise licenses for cost-effective access to the report.
13. Are there any additional resources or data provided in the Cleanroom Clothing report?
While the report offers comprehensive insights, it's advisable to review the specific contents or supplementary materials provided to ascertain if additional resources or data are available.
14. How can I stay updated on further developments or reports in the Cleanroom Clothing?
To stay informed about further developments, trends, and reports in the Cleanroom Clothing, consider subscribing to industry newsletters, following relevant companies and organizations, or regularly checking reputable industry news sources and publications.
Methodology
Step 1 - Identification of Relevant Samples Size from Population Database


Step 2 - Approaches for Defining Global Market Size (Value, Volume* & Price*)

Note*: In applicable scenarios
Step 3 - Data Sources
Primary Research
- Web Analytics
- Survey Reports
- Research Institute
- Latest Research Reports
- Opinion Leaders
Secondary Research
- Annual Reports
- White Paper
- Latest Press Release
- Industry Association
- Paid Database
- Investor Presentations

Step 4 - Data Triangulation
Involves using different sources of information in order to increase the validity of a study
These sources are likely to be stakeholders in a program - participants, other researchers, program staff, other community members, and so on.
Then we put all data in single framework & apply various statistical tools to find out the dynamic on the market.
During the analysis stage, feedback from the stakeholder groups would be compared to determine areas of agreement as well as areas of divergence