

Key Insights
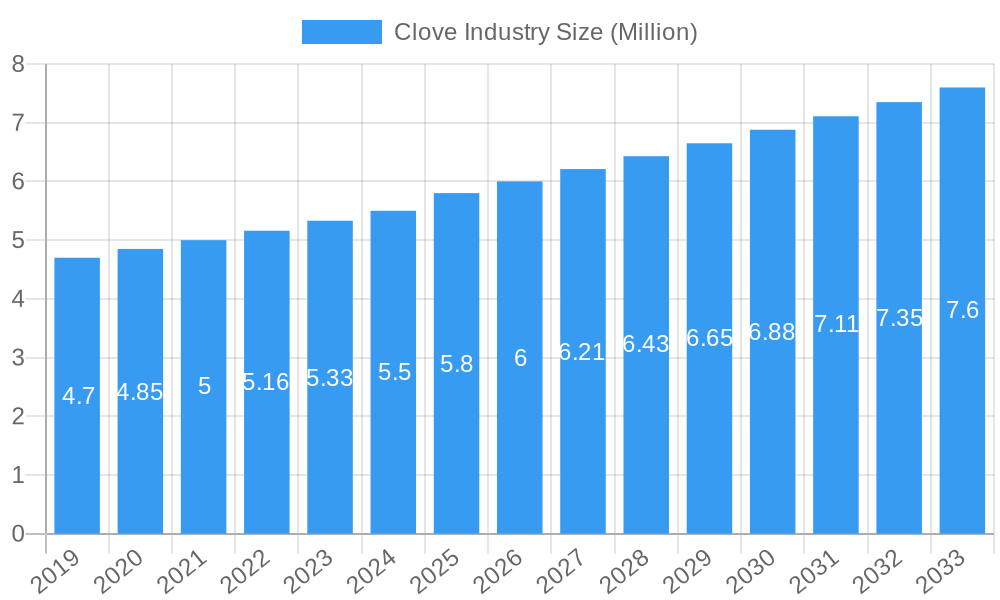
The global clove market is poised for steady growth, projected to reach a substantial USD 5.80 million in value by 2025, with a Compound Annual Growth Rate (CAGR) of 3.70% expected to propel it forward through 2033. This expansion is fueled by a confluence of factors, including the enduring demand for cloves as a vital spice in culinary applications worldwide, their significant utilization in the fragrance and flavor industries, and a growing recognition of their medicinal properties, particularly in traditional and herbal remedies. Emerging economies, especially within the Asia Pacific region, are anticipated to be significant drivers of consumption and production, owing to their deep-rooted cultural integration of cloves and expanding middle-class populations with increasing disposable incomes. The market's robust performance is also underpinned by innovation in product development, such as the increasing demand for clove oil and extract for various industrial and therapeutic uses.
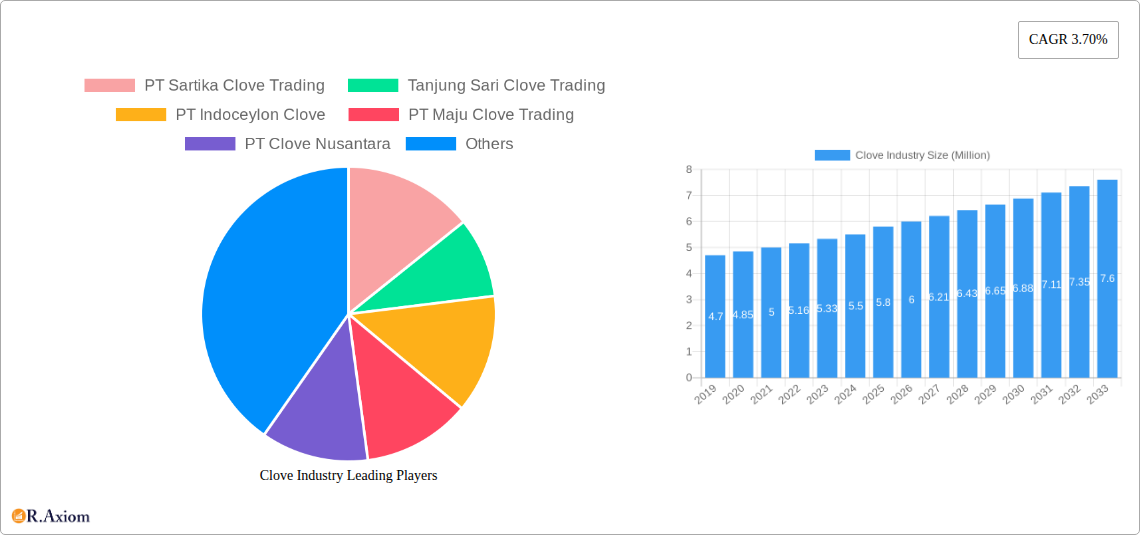
Clove Industry Market Size (In Million)
Despite the positive outlook, the clove industry faces certain challenges that could temper its growth trajectory. Supply chain volatilities, influenced by climatic conditions, crop diseases, and geopolitical factors in major producing regions, present a consistent restraint. Fluctuations in raw material prices due to these supply-side issues can impact profitability and market stability. Furthermore, stringent regulations pertaining to food safety and quality standards in key import markets necessitate adherence to rigorous compliance measures, adding to operational costs for producers. However, the market is also characterized by key players who are actively engaged in expanding their production capacities, forging strategic partnerships, and investing in research and development to enhance product quality and explore new applications, all of which contribute to the overall resilience and growth potential of the global clove industry.
Clove Industry Company Market Share
This comprehensive report delves into the dynamic global clove industry, offering an in-depth analysis of its current landscape and future trajectory. Covering a study period from 2019 to 2033, with a base and estimated year of 2025, this report provides critical insights for industry stakeholders, including producers, distributors, traders, and investors. The forecast period extends from 2025 to 2033, building upon a robust historical analysis from 2019 to 2024. We explore every facet of the clove market, from production and consumption to import/export dynamics, price trends, and emerging opportunities, all while highlighting the key players and transformative developments shaping this essential spice market. High-traffic keywords such as "clove market," "spice industry," "global clove production," "clove consumption trends," "clove prices," and "clove exports" are integrated throughout to maximize search visibility.
Clove Industry Market Concentration & Innovation
The global clove market exhibits a moderate level of concentration, with a few key players dominating significant portions of production and trade. For instance, Indonesian clove production alone accounts for an estimated 70% of global output, with PT Sartika Clove Trading and Tanjung Sari Clove Trading being prominent entities within this segment. Innovation in the clove industry is largely driven by advancements in cultivation techniques to improve yield and quality, as well as novel applications in the food, pharmaceutical, and fragrance sectors. Regulatory frameworks, particularly concerning food safety standards and phytosanitary requirements in importing nations, play a crucial role in shaping market access and trade flows. The availability of product substitutes, such as other aromatic spices like nutmeg and cinnamon, presents a competitive challenge, albeit with cloves offering unique flavor profiles. End-user trends indicate a growing demand for natural ingredients and health-promoting products, which benefits the clove market due to its perceived medicinal properties. Mergers and acquisitions (M&A) activities, while not intensely frequent, have occurred to consolidate market share and expand geographical reach. For example, a hypothetical M&A deal between PT Indoceylon Clove and PT Maju Clove Trading could be valued in the range of $10 Million to $50 Million, aiming to secure supply chains and enhance processing capabilities. This strategic consolidation helps companies navigate market volatility and R&D investments.
Clove Industry Industry Trends & Insights
The global clove industry is poised for steady growth, driven by an increasing global population, rising disposable incomes, and a persistent demand for aromatic spices in culinary applications and traditional medicine. The Compound Annual Growth Rate (CAGR) for the clove market is projected to be approximately 4.5% during the forecast period. Market penetration of processed clove products, such as essential oils and extracts, is also on the rise, indicating a shift towards value-added offerings. Technological disruptions are primarily focused on improving agricultural practices through precision farming, pest management, and post-harvest processing to maintain quality and reduce spoilage. For instance, the adoption of advanced drying techniques can preserve the volatile oils, a critical component of clove quality. Consumer preferences are increasingly leaning towards natural, ethically sourced, and organic products, creating opportunities for clove producers who can meet these stringent demands. The competitive dynamics within the industry are characterized by a balance between established large-scale producers and a multitude of smallholder farmers, particularly in key producing regions like Indonesia and Madagascar. The demand for cloves in the burgeoning natural health and wellness sector, fueled by their antioxidant and antiseptic properties, is a significant growth catalyst. Furthermore, the expanding processed food industry worldwide, incorporating cloves for flavor enhancement, directly contributes to market expansion. The exploration of novel applications for clove derivatives in the pharmaceutical industry, particularly in dental care and as antimicrobial agents, also presents a promising avenue for future market development.
Dominant Markets & Segments in Clove Industry
Production Analysis: Indonesia stands as the undisputed leader in global clove production, contributing approximately 70% of the world's supply. This dominance is driven by favorable climatic conditions, fertile volcanic soil, and a long history of cultivation. Key drivers of this dominance include government support for the spice sector, established farmer cooperatives, and extensive export infrastructure. Companies like PT Sartika Clove Trading and Tanjung Sari Clove Trading are major contributors to this production volume, processing and exporting millions of tons annually.
Consumption Analysis: The Asia-Pacific region, particularly India and Southeast Asian countries, represents the largest market for clove consumption. This is attributed to the integral role of cloves in their traditional cuisines, religious ceremonies, and medicinal practices. The demand in these regions is consistently high, with an estimated consumption volume of over 100 Million kilograms per year. Emerging markets in the Middle East and Africa are also showing significant growth in clove consumption due to evolving culinary preferences and increasing awareness of its health benefits.
Import Market Analysis (Value & Volume): The United States and European Union member states are major importers of cloves, driven by demand from the food and beverage industry, particularly in spice blends, baked goods, and savory dishes. The import market value for cloves is estimated to be around $500 Million annually. Factors influencing this segment include stringent quality control, the need for consistent supply chains, and consumer demand for exotic flavors. Countries in the Middle East also represent a significant import market, driven by their culinary traditions and the use of cloves in perfumery.
Export Market Analysis (Value & Volume): Indonesia dominates the global clove export market, with an estimated export volume exceeding 80 Million kilograms annually. The value of these exports is in the range of $400 Million. Major export destinations include India, Vietnam, and the United States. The competitive advantage of Indonesian cloves lies in their quality, aroma, and the scale of production, enabling them to cater to large international orders. Madagascar is another key exporter, contributing significantly to the global supply.
Price Trend Analysis: Clove prices are subject to significant volatility influenced by factors such as weather patterns affecting harvests, global demand fluctuations, and geopolitical events impacting supply chains. Historically, prices have ranged from $5 per kilogram to $15 per kilogram. The base year of 2025 is expected to see average prices stabilize around $8 per kilogram, with projections indicating a gradual increase to $10 per kilogram by 2033 due to sustained demand and potential supply constraints.
Clove Industry Product Developments
Product developments in the clove industry are increasingly focusing on value-added derivatives such as clove oil, oleoresins, and extracts, which offer concentrated flavor and bioactive compounds. These innovations cater to the demand for natural ingredients in the food and beverage, pharmaceutical, and cosmetic industries. Technological advancements in extraction methods ensure higher purity and potency, enhancing their competitive advantages. For instance, supercritical CO2 extraction yields high-quality clove oil with a broader spectrum of beneficial compounds, making it ideal for specialized applications. The development of standardized clove extracts also facilitates their integration into pharmaceutical formulations and dietary supplements.
Report Scope & Segmentation Analysis
This report segments the global clove market based on Production Analysis, Consumption Analysis, Import Market Analysis (Value & Volume), Export Market Analysis (Value & Volume), and Price Trend Analysis. Production is geographically segmented, highlighting key producing nations like Indonesia and Madagascar. Consumption is analyzed by region, with Asia-Pacific as the dominant consumer. The import and export markets are dissected by key trading countries and blocs, detailing both monetary value and tonnage. Price trends are examined historically and projected forward, considering various influencing factors. Each segment provides detailed market sizes, growth projections, and insights into competitive dynamics.
Key Drivers of Clove Industry Growth
The global clove industry is propelled by several key drivers. Firstly, the escalating demand for natural and organic ingredients across the food, beverage, and pharmaceutical sectors is a significant catalyst. Secondly, the expanding processed food industry worldwide, incorporating cloves for flavor enhancement and preservation, fuels consistent demand. Thirdly, the rising awareness of clove's health benefits, including its antioxidant, anti-inflammatory, and antimicrobial properties, is driving its use in traditional medicine and dietary supplements. Finally, technological advancements in cultivation and processing are improving yield, quality, and creating new value-added products, thereby expanding market opportunities.
Challenges in the Clove Industry Sector
Despite its growth potential, the clove industry faces several challenges. Price volatility due to weather-dependent harvests and speculative trading can impact profitability and planning. Stringent phytosanitary regulations and import restrictions in developed countries can hinder market access for some producers. Supply chain disruptions, often caused by logistical issues or geopolitical instability, can affect the timely delivery of cloves. Furthermore, the prevalence of monoculture farming in some regions can lead to increased vulnerability to pests and diseases, potentially impacting overall yield and quality. Intense competition among producers also exerts downward pressure on prices.
Emerging Opportunities in Clove Industry
Emerging opportunities in the clove industry lie in the growing demand for sustainable and ethically sourced cloves, creating a niche for certified producers. The increasing consumer interest in aromatherapy and natural fragrances presents a significant opportunity for high-quality clove oil. Furthermore, research into the potential pharmaceutical applications of eugenol, the primary component of clove oil, for pain management and as an anti-cancer agent, could unlock substantial future market growth. Exploring new geographical markets in Africa and Latin America, where culinary preferences are evolving, also offers untapped potential.
Leading Players in the Clove Industry Market
- PT Sartika Clove Trading
- Tanjung Sari Clove Trading
- PT Indoceylon Clove
- PT Maju Clove Trading
- PT Clove Nusantara
Key Developments in Clove Industry Industry
- 2023: Increased investment in precision agriculture techniques in Indonesia to optimize clove yields and quality.
- 2023 (Q4): Launch of new range of organic, fair-trade certified clove products by a European importer to meet growing consumer demand.
- 2024 (Q1): Significant price fluctuations observed due to adverse weather conditions affecting harvests in key producing regions.
- 2024 (Q2): Growing research interest in the pharmaceutical potential of eugenol derived from cloves, particularly for its analgesic properties.
- 2024 (Q3): Expansion of clove oil applications in the natural cosmetics and personal care industry.
Strategic Outlook for Clove Industry Market
The strategic outlook for the global clove industry remains positive, driven by sustained demand from established markets and the emergence of new applications. Companies that focus on value-added products, ensure supply chain resilience, and adhere to quality and sustainability standards are best positioned for long-term success. Embracing technological innovations in cultivation and processing, coupled with a keen understanding of evolving consumer preferences for natural and healthy ingredients, will be crucial for capitalizing on future market potential. The growing interest in the medicinal properties of cloves also presents a significant avenue for diversification and growth, particularly in the pharmaceutical and nutraceutical sectors.
Clove Industry Segmentation
- 1. Production Analysis
- 2. Consumption Analysis
- 3. Import Market Analysis (Value & Volume)
- 4. Export Market Analysis (Value & Volume)
- 5. Price Trend Analysis
Clove Industry Segmentation By Geography
-
1. North America
- 1.1. United States
-
2. Europe
- 2.1. United Kingdom
- 2.2. Germany
- 2.3. France
-
3. Asia Pacific
- 3.1. Indonesia
- 3.2. China
- 3.3. India
- 3.4. Singapore
- 3.5. Malaysia
- 3.6. Sri Lanka
- 3.7. Vietnam
- 4. Middle East
-
5. Madagascar
- 5.1. Kingdom of Saudi Arabia
- 5.2. United Arab Emirates
- 5.3. Kenya
- 5.4. Comoros
- 5.5. Tanzania
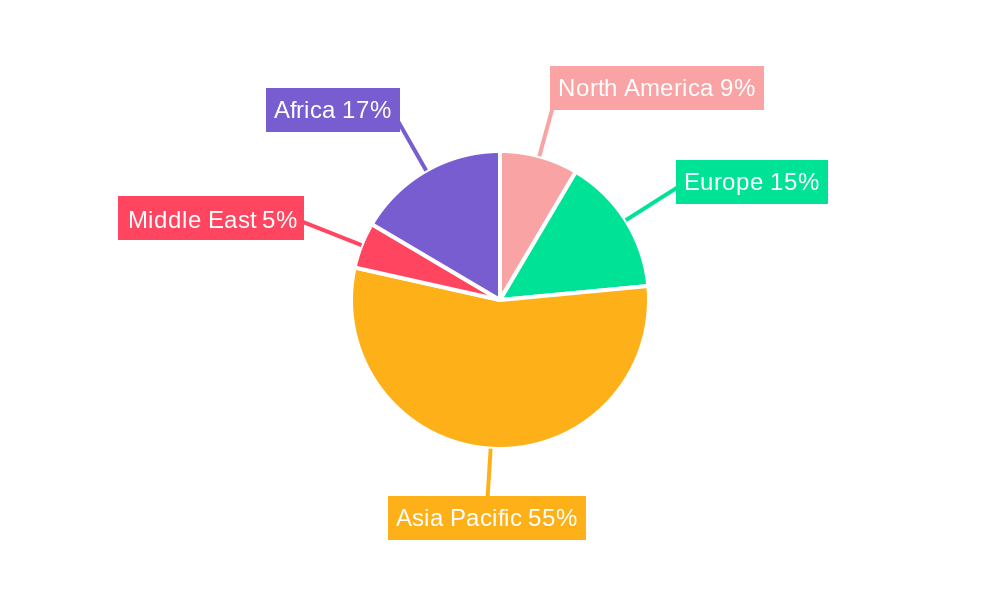
Clove Industry Regional Market Share
Geographic Coverage of Clove Industry
Clove Industry REPORT HIGHLIGHTS
| Aspects | Details |
|---|---|
| Study Period | 2020-2034 |
| Base Year | 2025 |
| Estimated Year | 2026 |
| Forecast Period | 2026-2034 |
| Historical Period | 2020-2025 |
| Growth Rate | CAGR of 3.70% from 2020-2034 |
| Segmentation |
|
Table of Contents
- 1. Introduction
- 1.1. Research Scope
- 1.2. Market Segmentation
- 1.3. Research Objective
- 1.4. Definitions and Assumptions
- 2. Executive Summary
- 2.1. Market Snapshot
- 3. Market Dynamics
- 3.1. Market Drivers
- 3.2. Market Restrains
- 3.3. Market Trends
- 3.4. Market Opportunities
- 4. Market Factor Analysis
- 4.1. Porters Five Forces
- 4.1.1. Bargaining Power of Suppliers
- 4.1.2. Bargaining Power of Buyers
- 4.1.3. Threat of New Entrants
- 4.1.4. Threat of Substitutes
- 4.1.5. Competitive Rivalry
- 4.2. PESTEL analysis
- 4.3. BCG Analysis
- 4.3.1. Stars (High Growth, High Market Share)
- 4.3.2. Cash Cows (Low Growth, High Market Share)
- 4.3.3. Question Mark (High Growth, Low Market Share)
- 4.3.4. Dogs (Low Growth, Low Market Share)
- 4.4. Ansoff Matrix Analysis
- 4.5. Supply Chain Analysis
- 4.6. Regulatory Landscape
- 4.7. Current Market Potential and Opportunity Assessment (TAM–SAM–SOM Framework)
- 4.8. RAX Analyst Note
- 4.1. Porters Five Forces
- 5. Market Analysis, Insights and Forecast 2021-2033
- 5.1. Market Analysis, Insights and Forecast - by Production Analysis
- 5.2. Market Analysis, Insights and Forecast - by Consumption Analysis
- 5.3. Market Analysis, Insights and Forecast - by Import Market Analysis (Value & Volume)
- 5.4. Market Analysis, Insights and Forecast - by Export Market Analysis (Value & Volume)
- 5.5. Market Analysis, Insights and Forecast - by Price Trend Analysis
- 5.6. Market Analysis, Insights and Forecast - by Region
- 5.6.1. North America
- 5.6.2. Europe
- 5.6.3. Asia Pacific
- 5.6.4. Middle East
- 5.6.5. Madagascar
- 6. Global Clove Industry Analysis, Insights and Forecast, 2021-2033
- 6.1. Market Analysis, Insights and Forecast - by Production Analysis
- 6.2. Market Analysis, Insights and Forecast - by Consumption Analysis
- 6.3. Market Analysis, Insights and Forecast - by Import Market Analysis (Value & Volume)
- 6.4. Market Analysis, Insights and Forecast - by Export Market Analysis (Value & Volume)
- 6.5. Market Analysis, Insights and Forecast - by Price Trend Analysis
- 7. North America Clove Industry Analysis, Insights and Forecast, 2020-2032
- 7.1. Market Analysis, Insights and Forecast - by Production Analysis
- 7.2. Market Analysis, Insights and Forecast - by Consumption Analysis
- 7.3. Market Analysis, Insights and Forecast - by Import Market Analysis (Value & Volume)
- 7.4. Market Analysis, Insights and Forecast - by Export Market Analysis (Value & Volume)
- 7.5. Market Analysis, Insights and Forecast - by Price Trend Analysis
- 8. Europe Clove Industry Analysis, Insights and Forecast, 2020-2032
- 8.1. Market Analysis, Insights and Forecast - by Production Analysis
- 8.2. Market Analysis, Insights and Forecast - by Consumption Analysis
- 8.3. Market Analysis, Insights and Forecast - by Import Market Analysis (Value & Volume)
- 8.4. Market Analysis, Insights and Forecast - by Export Market Analysis (Value & Volume)
- 8.5. Market Analysis, Insights and Forecast - by Price Trend Analysis
- 9. Asia Pacific Clove Industry Analysis, Insights and Forecast, 2020-2032
- 9.1. Market Analysis, Insights and Forecast - by Production Analysis
- 9.2. Market Analysis, Insights and Forecast - by Consumption Analysis
- 9.3. Market Analysis, Insights and Forecast - by Import Market Analysis (Value & Volume)
- 9.4. Market Analysis, Insights and Forecast - by Export Market Analysis (Value & Volume)
- 9.5. Market Analysis, Insights and Forecast - by Price Trend Analysis
- 10. Middle East Clove Industry Analysis, Insights and Forecast, 2020-2032
- 10.1. Market Analysis, Insights and Forecast - by Production Analysis
- 10.2. Market Analysis, Insights and Forecast - by Consumption Analysis
- 10.3. Market Analysis, Insights and Forecast - by Import Market Analysis (Value & Volume)
- 10.4. Market Analysis, Insights and Forecast - by Export Market Analysis (Value & Volume)
- 10.5. Market Analysis, Insights and Forecast - by Price Trend Analysis
- 11. Madagascar Clove Industry Analysis, Insights and Forecast, 2020-2032
- 11.1. Market Analysis, Insights and Forecast - by Production Analysis
- 11.2. Market Analysis, Insights and Forecast - by Consumption Analysis
- 11.3. Market Analysis, Insights and Forecast - by Import Market Analysis (Value & Volume)
- 11.4. Market Analysis, Insights and Forecast - by Export Market Analysis (Value & Volume)
- 11.5. Market Analysis, Insights and Forecast - by Price Trend Analysis
- 12. Competitive Analysis
- 12.1. Company Profiles
- 12.1.1 PT Sartika Clove Trading
- 12.1.1.1. Company Overview
- 12.1.1.2. Products
- 12.1.1.3. Company Financials
- 12.1.1.4. SWOT Analysis
- 12.1.2 Tanjung Sari Clove Trading
- 12.1.2.1. Company Overview
- 12.1.2.2. Products
- 12.1.2.3. Company Financials
- 12.1.2.4. SWOT Analysis
- 12.1.3 PT Indoceylon Clove
- 12.1.3.1. Company Overview
- 12.1.3.2. Products
- 12.1.3.3. Company Financials
- 12.1.3.4. SWOT Analysis
- 12.1.4 PT Maju Clove Trading
- 12.1.4.1. Company Overview
- 12.1.4.2. Products
- 12.1.4.3. Company Financials
- 12.1.4.4. SWOT Analysis
- 12.1.5 PT Clove Nusantara
- 12.1.5.1. Company Overview
- 12.1.5.2. Products
- 12.1.5.3. Company Financials
- 12.1.5.4. SWOT Analysis
- 12.1.1 PT Sartika Clove Trading
- 12.2. Market Entropy
- 12.2.1 Company's Key Areas Served
- 12.2.2 Recent Developments
- 12.3. Company Market Share Analysis 2025
- 12.3.1 Top 5 Companies Market Share Analysis
- 12.3.2 Top 3 Companies Market Share Analysis
- 12.4. List of Potential Customers
- 13. Research Methodology
List of Figures
- Figure 1: Global Clove Industry Revenue Breakdown (Million, %) by Region 2025 & 2033
- Figure 2: North America Clove Industry Revenue (Million), by Production Analysis 2025 & 2033
- Figure 3: North America Clove Industry Revenue Share (%), by Production Analysis 2025 & 2033
- Figure 4: North America Clove Industry Revenue (Million), by Consumption Analysis 2025 & 2033
- Figure 5: North America Clove Industry Revenue Share (%), by Consumption Analysis 2025 & 2033
- Figure 6: North America Clove Industry Revenue (Million), by Import Market Analysis (Value & Volume) 2025 & 2033
- Figure 7: North America Clove Industry Revenue Share (%), by Import Market Analysis (Value & Volume) 2025 & 2033
- Figure 8: North America Clove Industry Revenue (Million), by Export Market Analysis (Value & Volume) 2025 & 2033
- Figure 9: North America Clove Industry Revenue Share (%), by Export Market Analysis (Value & Volume) 2025 & 2033
- Figure 10: North America Clove Industry Revenue (Million), by Price Trend Analysis 2025 & 2033
- Figure 11: North America Clove Industry Revenue Share (%), by Price Trend Analysis 2025 & 2033
- Figure 12: North America Clove Industry Revenue (Million), by Country 2025 & 2033
- Figure 13: North America Clove Industry Revenue Share (%), by Country 2025 & 2033
- Figure 14: Europe Clove Industry Revenue (Million), by Production Analysis 2025 & 2033
- Figure 15: Europe Clove Industry Revenue Share (%), by Production Analysis 2025 & 2033
- Figure 16: Europe Clove Industry Revenue (Million), by Consumption Analysis 2025 & 2033
- Figure 17: Europe Clove Industry Revenue Share (%), by Consumption Analysis 2025 & 2033
- Figure 18: Europe Clove Industry Revenue (Million), by Import Market Analysis (Value & Volume) 2025 & 2033
- Figure 19: Europe Clove Industry Revenue Share (%), by Import Market Analysis (Value & Volume) 2025 & 2033
- Figure 20: Europe Clove Industry Revenue (Million), by Export Market Analysis (Value & Volume) 2025 & 2033
- Figure 21: Europe Clove Industry Revenue Share (%), by Export Market Analysis (Value & Volume) 2025 & 2033
- Figure 22: Europe Clove Industry Revenue (Million), by Price Trend Analysis 2025 & 2033
- Figure 23: Europe Clove Industry Revenue Share (%), by Price Trend Analysis 2025 & 2033
- Figure 24: Europe Clove Industry Revenue (Million), by Country 2025 & 2033
- Figure 25: Europe Clove Industry Revenue Share (%), by Country 2025 & 2033
- Figure 26: Asia Pacific Clove Industry Revenue (Million), by Production Analysis 2025 & 2033
- Figure 27: Asia Pacific Clove Industry Revenue Share (%), by Production Analysis 2025 & 2033
- Figure 28: Asia Pacific Clove Industry Revenue (Million), by Consumption Analysis 2025 & 2033
- Figure 29: Asia Pacific Clove Industry Revenue Share (%), by Consumption Analysis 2025 & 2033
- Figure 30: Asia Pacific Clove Industry Revenue (Million), by Import Market Analysis (Value & Volume) 2025 & 2033
- Figure 31: Asia Pacific Clove Industry Revenue Share (%), by Import Market Analysis (Value & Volume) 2025 & 2033
- Figure 32: Asia Pacific Clove Industry Revenue (Million), by Export Market Analysis (Value & Volume) 2025 & 2033
- Figure 33: Asia Pacific Clove Industry Revenue Share (%), by Export Market Analysis (Value & Volume) 2025 & 2033
- Figure 34: Asia Pacific Clove Industry Revenue (Million), by Price Trend Analysis 2025 & 2033
- Figure 35: Asia Pacific Clove Industry Revenue Share (%), by Price Trend Analysis 2025 & 2033
- Figure 36: Asia Pacific Clove Industry Revenue (Million), by Country 2025 & 2033
- Figure 37: Asia Pacific Clove Industry Revenue Share (%), by Country 2025 & 2033
- Figure 38: Middle East Clove Industry Revenue (Million), by Production Analysis 2025 & 2033
- Figure 39: Middle East Clove Industry Revenue Share (%), by Production Analysis 2025 & 2033
- Figure 40: Middle East Clove Industry Revenue (Million), by Consumption Analysis 2025 & 2033
- Figure 41: Middle East Clove Industry Revenue Share (%), by Consumption Analysis 2025 & 2033
- Figure 42: Middle East Clove Industry Revenue (Million), by Import Market Analysis (Value & Volume) 2025 & 2033
- Figure 43: Middle East Clove Industry Revenue Share (%), by Import Market Analysis (Value & Volume) 2025 & 2033
- Figure 44: Middle East Clove Industry Revenue (Million), by Export Market Analysis (Value & Volume) 2025 & 2033
- Figure 45: Middle East Clove Industry Revenue Share (%), by Export Market Analysis (Value & Volume) 2025 & 2033
- Figure 46: Middle East Clove Industry Revenue (Million), by Price Trend Analysis 2025 & 2033
- Figure 47: Middle East Clove Industry Revenue Share (%), by Price Trend Analysis 2025 & 2033
- Figure 48: Middle East Clove Industry Revenue (Million), by Country 2025 & 2033
- Figure 49: Middle East Clove Industry Revenue Share (%), by Country 2025 & 2033
- Figure 50: Madagascar Clove Industry Revenue (Million), by Production Analysis 2025 & 2033
- Figure 51: Madagascar Clove Industry Revenue Share (%), by Production Analysis 2025 & 2033
- Figure 52: Madagascar Clove Industry Revenue (Million), by Consumption Analysis 2025 & 2033
- Figure 53: Madagascar Clove Industry Revenue Share (%), by Consumption Analysis 2025 & 2033
- Figure 54: Madagascar Clove Industry Revenue (Million), by Import Market Analysis (Value & Volume) 2025 & 2033
- Figure 55: Madagascar Clove Industry Revenue Share (%), by Import Market Analysis (Value & Volume) 2025 & 2033
- Figure 56: Madagascar Clove Industry Revenue (Million), by Export Market Analysis (Value & Volume) 2025 & 2033
- Figure 57: Madagascar Clove Industry Revenue Share (%), by Export Market Analysis (Value & Volume) 2025 & 2033
- Figure 58: Madagascar Clove Industry Revenue (Million), by Price Trend Analysis 2025 & 2033
- Figure 59: Madagascar Clove Industry Revenue Share (%), by Price Trend Analysis 2025 & 2033
- Figure 60: Madagascar Clove Industry Revenue (Million), by Country 2025 & 2033
- Figure 61: Madagascar Clove Industry Revenue Share (%), by Country 2025 & 2033
List of Tables
- Table 1: Global Clove Industry Revenue Million Forecast, by Production Analysis 2020 & 2033
- Table 2: Global Clove Industry Revenue Million Forecast, by Consumption Analysis 2020 & 2033
- Table 3: Global Clove Industry Revenue Million Forecast, by Import Market Analysis (Value & Volume) 2020 & 2033
- Table 4: Global Clove Industry Revenue Million Forecast, by Export Market Analysis (Value & Volume) 2020 & 2033
- Table 5: Global Clove Industry Revenue Million Forecast, by Price Trend Analysis 2020 & 2033
- Table 6: Global Clove Industry Revenue Million Forecast, by Region 2020 & 2033
- Table 7: Global Clove Industry Revenue Million Forecast, by Production Analysis 2020 & 2033
- Table 8: Global Clove Industry Revenue Million Forecast, by Consumption Analysis 2020 & 2033
- Table 9: Global Clove Industry Revenue Million Forecast, by Import Market Analysis (Value & Volume) 2020 & 2033
- Table 10: Global Clove Industry Revenue Million Forecast, by Export Market Analysis (Value & Volume) 2020 & 2033
- Table 11: Global Clove Industry Revenue Million Forecast, by Price Trend Analysis 2020 & 2033
- Table 12: Global Clove Industry Revenue Million Forecast, by Country 2020 & 2033
- Table 13: United States Clove Industry Revenue (Million) Forecast, by Application 2020 & 2033
- Table 14: Global Clove Industry Revenue Million Forecast, by Production Analysis 2020 & 2033
- Table 15: Global Clove Industry Revenue Million Forecast, by Consumption Analysis 2020 & 2033
- Table 16: Global Clove Industry Revenue Million Forecast, by Import Market Analysis (Value & Volume) 2020 & 2033
- Table 17: Global Clove Industry Revenue Million Forecast, by Export Market Analysis (Value & Volume) 2020 & 2033
- Table 18: Global Clove Industry Revenue Million Forecast, by Price Trend Analysis 2020 & 2033
- Table 19: Global Clove Industry Revenue Million Forecast, by Country 2020 & 2033
- Table 20: United Kingdom Clove Industry Revenue (Million) Forecast, by Application 2020 & 2033
- Table 21: Germany Clove Industry Revenue (Million) Forecast, by Application 2020 & 2033
- Table 22: France Clove Industry Revenue (Million) Forecast, by Application 2020 & 2033
- Table 23: Global Clove Industry Revenue Million Forecast, by Production Analysis 2020 & 2033
- Table 24: Global Clove Industry Revenue Million Forecast, by Consumption Analysis 2020 & 2033
- Table 25: Global Clove Industry Revenue Million Forecast, by Import Market Analysis (Value & Volume) 2020 & 2033
- Table 26: Global Clove Industry Revenue Million Forecast, by Export Market Analysis (Value & Volume) 2020 & 2033
- Table 27: Global Clove Industry Revenue Million Forecast, by Price Trend Analysis 2020 & 2033
- Table 28: Global Clove Industry Revenue Million Forecast, by Country 2020 & 2033
- Table 29: Indonesia Clove Industry Revenue (Million) Forecast, by Application 2020 & 2033
- Table 30: China Clove Industry Revenue (Million) Forecast, by Application 2020 & 2033
- Table 31: India Clove Industry Revenue (Million) Forecast, by Application 2020 & 2033
- Table 32: Singapore Clove Industry Revenue (Million) Forecast, by Application 2020 & 2033
- Table 33: Malaysia Clove Industry Revenue (Million) Forecast, by Application 2020 & 2033
- Table 34: Sri Lanka Clove Industry Revenue (Million) Forecast, by Application 2020 & 2033
- Table 35: Vietnam Clove Industry Revenue (Million) Forecast, by Application 2020 & 2033
- Table 36: Global Clove Industry Revenue Million Forecast, by Production Analysis 2020 & 2033
- Table 37: Global Clove Industry Revenue Million Forecast, by Consumption Analysis 2020 & 2033
- Table 38: Global Clove Industry Revenue Million Forecast, by Import Market Analysis (Value & Volume) 2020 & 2033
- Table 39: Global Clove Industry Revenue Million Forecast, by Export Market Analysis (Value & Volume) 2020 & 2033
- Table 40: Global Clove Industry Revenue Million Forecast, by Price Trend Analysis 2020 & 2033
- Table 41: Global Clove Industry Revenue Million Forecast, by Country 2020 & 2033
- Table 42: Global Clove Industry Revenue Million Forecast, by Production Analysis 2020 & 2033
- Table 43: Global Clove Industry Revenue Million Forecast, by Consumption Analysis 2020 & 2033
- Table 44: Global Clove Industry Revenue Million Forecast, by Import Market Analysis (Value & Volume) 2020 & 2033
- Table 45: Global Clove Industry Revenue Million Forecast, by Export Market Analysis (Value & Volume) 2020 & 2033
- Table 46: Global Clove Industry Revenue Million Forecast, by Price Trend Analysis 2020 & 2033
- Table 47: Global Clove Industry Revenue Million Forecast, by Country 2020 & 2033
- Table 48: Kingdom of Saudi Arabia Clove Industry Revenue (Million) Forecast, by Application 2020 & 2033
- Table 49: United Arab Emirates Clove Industry Revenue (Million) Forecast, by Application 2020 & 2033
- Table 50: Kenya Clove Industry Revenue (Million) Forecast, by Application 2020 & 2033
- Table 51: Comoros Clove Industry Revenue (Million) Forecast, by Application 2020 & 2033
- Table 52: Tanzania Clove Industry Revenue (Million) Forecast, by Application 2020 & 2033
Frequently Asked Questions
1. What is the projected Compound Annual Growth Rate (CAGR) of the Clove Industry?
The projected CAGR is approximately 3.70%.
2. Which companies are prominent players in the Clove Industry?
Key companies in the market include PT Sartika Clove Trading , Tanjung Sari Clove Trading , PT Indoceylon Clove , PT Maju Clove Trading , PT Clove Nusantara.
3. What are the main segments of the Clove Industry?
The market segments include Production Analysis, Consumption Analysis, Import Market Analysis (Value & Volume), Export Market Analysis (Value & Volume), Price Trend Analysis.
4. Can you provide details about the market size?
The market size is estimated to be USD 5.80 Million as of 2022.
5. What are some drivers contributing to market growth?
Increasing Demand for Garlic Due to Various Uses in Industries; Rising Demad of Organic Garlic; Increasing Government Initiatives.
6. What are the notable trends driving market growth?
Increased Demand from Various Industries is Aiding the Production.
7. Are there any restraints impacting market growth?
Lack of Technical Knowledge of Farmers; Price Fluctuations.
8. Can you provide examples of recent developments in the market?
N/A
9. What pricing options are available for accessing the report?
Pricing options include single-user, multi-user, and enterprise licenses priced at USD 4750, USD 5250, and USD 8750 respectively.
10. Is the market size provided in terms of value or volume?
The market size is provided in terms of value, measured in Million.
11. Are there any specific market keywords associated with the report?
Yes, the market keyword associated with the report is "Clove Industry," which aids in identifying and referencing the specific market segment covered.
12. How do I determine which pricing option suits my needs best?
The pricing options vary based on user requirements and access needs. Individual users may opt for single-user licenses, while businesses requiring broader access may choose multi-user or enterprise licenses for cost-effective access to the report.
13. Are there any additional resources or data provided in the Clove Industry report?
While the report offers comprehensive insights, it's advisable to review the specific contents or supplementary materials provided to ascertain if additional resources or data are available.
14. How can I stay updated on further developments or reports in the Clove Industry?
To stay informed about further developments, trends, and reports in the Clove Industry, consider subscribing to industry newsletters, following relevant companies and organizations, or regularly checking reputable industry news sources and publications.
Methodology
Step 1 - Identification of Relevant Samples Size from Population Database


Step 2 - Approaches for Defining Global Market Size (Value, Volume* & Price*)

Note*: In applicable scenarios
Step 3 - Data Sources
Primary Research
- Web Analytics
- Survey Reports
- Research Institute
- Latest Research Reports
- Opinion Leaders
Secondary Research
- Annual Reports
- White Paper
- Latest Press Release
- Industry Association
- Paid Database
- Investor Presentations

Step 4 - Data Triangulation
Involves using different sources of information in order to increase the validity of a study
These sources are likely to be stakeholders in a program - participants, other researchers, program staff, other community members, and so on.
Then we put all data in single framework & apply various statistical tools to find out the dynamic on the market.
During the analysis stage, feedback from the stakeholder groups would be compared to determine areas of agreement as well as areas of divergence