
Key Insights
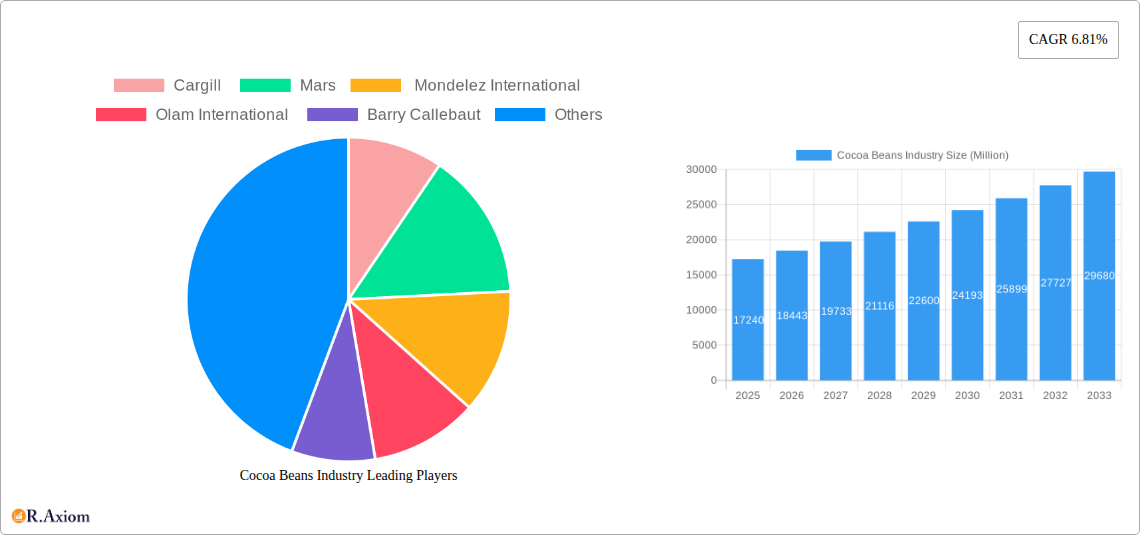
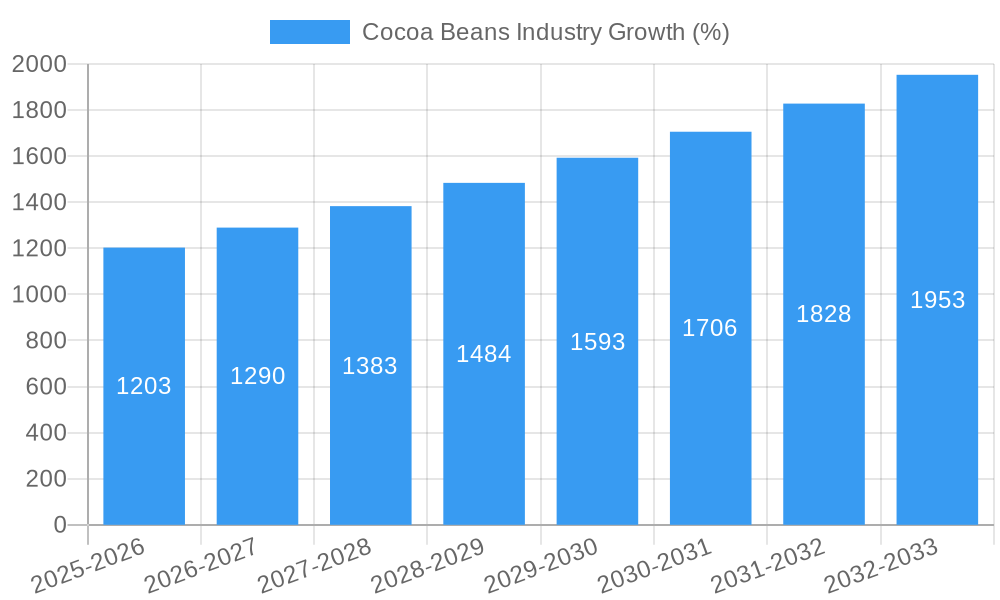
The global cocoa beans market, valued at $17.24 billion in 2025, is projected to experience robust growth, exhibiting a Compound Annual Growth Rate (CAGR) of 6.81% from 2025 to 2033. This expansion is driven by several key factors. The rising demand for chocolate and cocoa-based products across diverse food and beverage categories, particularly in developing economies with burgeoning middle classes, fuels significant market expansion. Furthermore, increasing consumer preference for premium and organic cocoa products, coupled with innovation in cocoa-derived ingredients for functional foods and health supplements, contributes to market growth. Strategic partnerships between cocoa producers and chocolate manufacturers, aimed at ensuring sustainable sourcing and ethical production practices, also play a significant role. However, the market faces challenges, including fluctuating cocoa bean prices influenced by weather patterns and global supply chain disruptions. Furthermore, concerns about deforestation and the sustainability of cocoa farming practices pose significant obstacles. Despite these constraints, the overall market outlook remains positive, with considerable opportunities for growth in regions like Asia-Pacific and South America, where consumption is rapidly increasing.
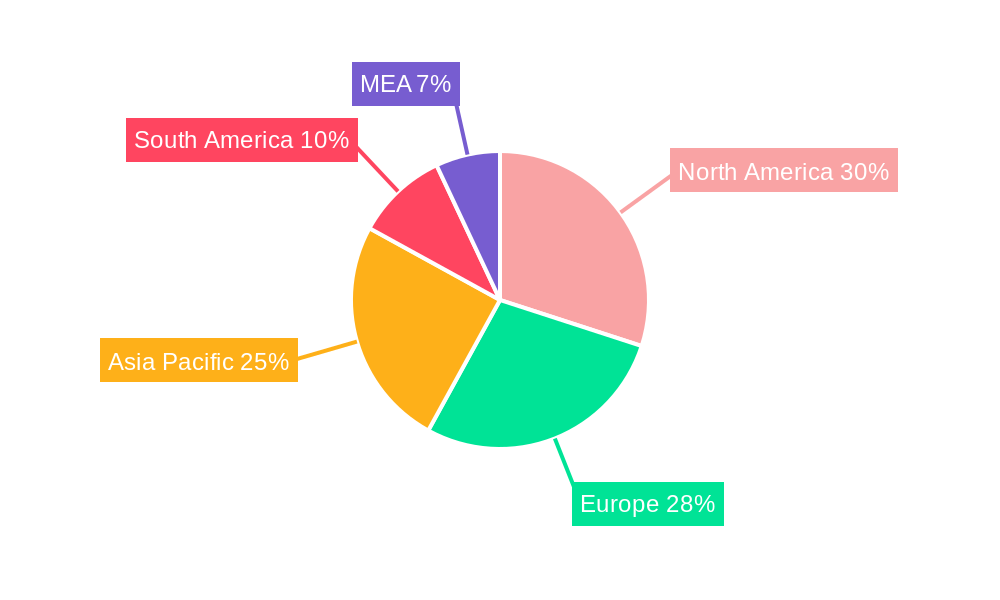
The market segmentation reveals a diverse landscape. Bulk cocoa beans constitute a significant portion of the market, followed by cocoa butter and cocoa powder. The confectionery industry remains the dominant end-user sector, followed by beverages and bakery products. Online retail channels are gaining traction, though supermarkets and hypermarkets continue to dominate sales. Key players like Cargill, Mars, Mondelez International, Olam International, and Barry Callebaut are shaping the market through their global reach and influence on supply chains. Geographical analysis reveals substantial market presence in North America and Europe, while Asia-Pacific and South America are emerging as high-growth regions due to rising per capita income and changing consumer preferences. The forecast period (2025-2033) promises further expansion, driven by sustained demand and industry initiatives towards sustainability.
Cocoa Beans Industry: A Comprehensive Market Report (2019-2033)
This detailed report provides a comprehensive analysis of the global cocoa beans industry, covering market size, segmentation, growth drivers, challenges, and future outlook from 2019 to 2033. The report utilizes data from the historical period (2019-2024), base year (2025), and estimated year (2025) to project the forecast period (2025-2033). Key players like Cargill, Mars, Mondelez International, Olam International, and Barry Callebaut are analyzed, providing invaluable insights for industry stakeholders.
Cocoa Beans Industry Market Concentration & Innovation
The cocoa beans industry exhibits moderate market concentration, with a few dominant players controlling a significant share. Cargill, Mars, Mondelez International, Olam International, and Barry Callebaut are key players, collectively holding an estimated xx% market share in 2025. Innovation is driven by increasing consumer demand for sustainably sourced cocoa, along with the development of new cocoa products and processing techniques. Regulatory frameworks, particularly concerning child labor and deforestation, are influencing industry practices. Product substitutes, like alternative sweeteners and plant-based chocolate alternatives, present a moderate competitive threat. End-user trends, such as the growing preference for premium chocolate and cocoa-based beverages, are shaping market growth. M&A activities in the industry have been moderate in recent years, with deal values averaging approximately xx Million USD annually during the historical period. Key acquisitions have focused on securing cocoa bean supply chains and expanding product portfolios.
Cocoa Beans Industry Industry Trends & Insights
The global cocoa beans market is projected to witness a CAGR of xx% during the forecast period (2025-2033). Several factors contribute to this growth: rising consumer disposable incomes, especially in emerging economies, fuels the demand for chocolate and cocoa-based products. Technological advancements in cocoa processing and sustainability initiatives are improving efficiency and reducing environmental impact. Changing consumer preferences, such as a growing preference for organic and fair-trade cocoa, are creating new opportunities. Intense competition among major players drives innovation and keeps prices competitive. Market penetration of cocoa products in various end-user industries (confectionery, beverages, bakery) remains high, with consistent growth expected in developing nations. The increasing popularity of premium and specialty cocoa products is also driving market expansion.
Dominant Markets & Segments in Cocoa Beans Industry
- Leading Region: West Africa (primarily Ivory Coast and Ghana) remains the dominant cocoa bean producing region, driven by favorable climatic conditions and established cultivation practices.
- Leading Country: Ivory Coast holds the largest market share in global cocoa bean production.
- Dominant Product Type: Bulk cocoa beans constitute the largest segment, owing to their widespread use in chocolate manufacturing.
- Dominant Processing Type: Fermented cocoa beans account for the majority of the market, as fermentation enhances flavor and aroma.
- Dominant End-User Industry: Confectionery remains the largest consumer of cocoa beans due to its extensive use in chocolate manufacturing.
- Dominant Sales Channel: Supermarkets/hypermarkets are the primary sales channel, followed by specialty stores and online retail.
Key Drivers: West Africa's dominance is underpinned by supportive government policies, readily available land, and a well-established agricultural infrastructure. However, challenges related to climate change, farmer incomes, and sustainability concerns are crucial aspects to address for continued dominance. The shift towards premiumization is particularly notable in the confectionery sector.
Cocoa Beans Industry Product Developments
Recent innovations have focused on enhancing cocoa bean quality, improving processing efficiency, and developing new cocoa-based products. This includes advancements in fermentation techniques for superior flavor profiles, development of more sustainable cocoa farming practices, and the introduction of value-added cocoa products (e.g., single-origin cocoa). These developments are aligning with growing consumer demand for premium and sustainable cocoa products and address the challenges posed by product substitutions.
Report Scope & Segmentation Analysis
This report segments the cocoa beans market based on product type (Bulk Cocoa Beans, Cocoa Butter, Cocoa Powder, Chocolate), processing type (Fermented, Non-Fermented), end-user industry (Confectionery, Beverages, Bakery Products), and sales channel (Online Retail, Supermarkets/Hypermarkets, Specialty Stores). Each segment's market size, growth projections, and competitive dynamics are analyzed. For example, the cocoa butter segment is projected to experience significant growth due to its increasing use in the cosmetics and pharmaceutical industries. The online retail channel is experiencing the fastest growth driven by expanding e-commerce platforms and increasing online purchasing power.
Key Drivers of Cocoa Beans Industry Growth
The cocoa beans industry's growth is fueled by several key factors, including rising global demand for chocolate and cocoa-based products, particularly in emerging markets, the increasing adoption of sustainable farming practices improving the industry's environmental profile, and technological advancements in processing and production, which enhance efficiency and quality. Favorable government policies, such as reduced import duties (as seen in India's 2022 budget), further boost market growth.
Challenges in the Cocoa Beans Industry Sector
The cocoa beans industry faces several significant challenges. Fluctuating cocoa bean prices due to weather patterns and supply chain disruptions impact profitability. Sustainability concerns related to deforestation and child labor in cocoa production create reputational risks and regulatory pressures. Competition from substitute products and rising input costs (e.g., labor, fertilizers) further constrain industry growth. These challenges collectively impact industry margins and long-term sustainability.
Emerging Opportunities in Cocoa Beans Industry
Emerging opportunities include the expansion into new markets with growing consumer demand for cocoa products, the growing popularity of premium, single-origin, and sustainably sourced cocoa, and the development of novel cocoa-based products with enhanced functionalities. Technological advancements, such as improved processing techniques and traceability solutions, also offer significant opportunities for market expansion.
Leading Players in the Cocoa Beans Industry Market
Key Developments in Cocoa Beans Industry Industry
- June 2021: Ivory Coast's initiative to build a biomass plant utilizing cocoa waste, supported by the US Trade and Development Agency, demonstrates a commitment to sustainability and waste reduction. This initiative could reduce reliance on fossil fuels and improve the environmental footprint of cocoa production.
- February 2022: India's reduction in cocoa bean import duty to 15% from 30% stimulates increased cocoa bean imports and enhances the availability of cocoa beans in the Indian market, boosting the confectionery, beverage, and bakery sectors.
- October 2022: The European Union's 442 Million USD commitment to support Ivory Coast's efforts to combat child labor and deforestation in cocoa production highlights a growing global focus on ethical sourcing and sustainability within the cocoa industry. This could lead to increased demand for certified sustainable cocoa beans.
Strategic Outlook for Cocoa Beans Industry Market
The cocoa beans market is poised for continued growth, driven by rising consumer demand, technological advancements, and a growing focus on sustainability. Strategic initiatives focused on ethical sourcing, supply chain transparency, product innovation, and expanding into new markets will be crucial for success. Companies leveraging sustainable practices and developing innovative cocoa-based products are well-positioned to capture a larger share of this expanding market.
Cocoa Beans Industry Segmentation
-
1. North America
- 1.1. United States
- 1.2. Canada
-
2. Europe
- 2.1. Germany
- 2.2. Netherland
- 2.3. United Kingdom
- 2.4. France
- 2.5. Belgium
- 2.6. Russia
-
3. Asia-Pacific
- 3.1. India
- 3.2. Malaysia
- 3.3. Indonesia
- 3.4. Singapore
- 3.5. Japan
-
4. South America
- 4.1. Brazil
- 4.2. Ecuador
-
5. Africa
- 5.1. Ghana
- 5.2. Ivory Coast
- 5.3. Nigeria
- 5.4. Cote D'lvoire
- 5.5. Cameroon
-
6. North America
- 6.1. United States
- 6.2. Canada
-
7. Europe
- 7.1. Germany
- 7.2. Netherland
- 7.3. United Kingdom
- 7.4. France
- 7.5. Belgium
- 7.6. Russia
-
8. Asia-Pacific
- 8.1. India
- 8.2. Malaysia
- 8.3. Indonesia
- 8.4. Singapore
- 8.5. Japan
-
9. South America
- 9.1. Brazil
- 9.2. Ecuador
-
10. Africa
- 10.1. Ghana
- 10.2. Ivory Coast
- 10.3. Nigeria
- 10.4. Cote D'lvoire
- 10.5. Cameroon
Cocoa Beans Industry Segmentation By Geography
-
1. North America
- 1.1. United States
- 1.2. Canada
- 1.3. Mexico
-
2. South America
- 2.1. Brazil
- 2.2. Argentina
- 2.3. Rest of South America
-
3. Europe
- 3.1. United Kingdom
- 3.2. Germany
- 3.3. France
- 3.4. Italy
- 3.5. Spain
- 3.6. Russia
- 3.7. Benelux
- 3.8. Nordics
- 3.9. Rest of Europe
-
4. Middle East & Africa
- 4.1. Turkey
- 4.2. Israel
- 4.3. GCC
- 4.4. North Africa
- 4.5. South Africa
- 4.6. Rest of Middle East & Africa
-
5. Asia Pacific
- 5.1. China
- 5.2. India
- 5.3. Japan
- 5.4. South Korea
- 5.5. ASEAN
- 5.6. Oceania
- 5.7. Rest of Asia Pacific
Cocoa Beans Industry REPORT HIGHLIGHTS
| Aspects | Details |
|---|---|
| Study Period | 2019-2033 |
| Base Year | 2024 |
| Estimated Year | 2025 |
| Forecast Period | 2025-2033 |
| Historical Period | 2019-2024 |
| Growth Rate | CAGR of 6.81% from 2019-2033 |
| Segmentation |
|
Table of Contents
- 1. Introduction
- 1.1. Research Scope
- 1.2. Market Segmentation
- 1.3. Research Methodology
- 1.4. Definitions and Assumptions
- 2. Executive Summary
- 2.1. Introduction
- 3. Market Dynamics
- 3.1. Introduction
- 3.2. Market Drivers
- 3.2.1. Increasing Demand for Indian Rice; Enhancing Production Capacities; Increasing Government Initiatives
- 3.3. Market Restrains
- 3.3.1. Abiotic and Biotic Stresses in Rice Cultivation; High Market Entry Costs
- 3.4. Market Trends
- 3.4.1. Wide Application of Cocoa in Different End-user Industries
- 4. Market Factor Analysis
- 4.1. Porters Five Forces
- 4.2. Supply/Value Chain
- 4.3. PESTEL analysis
- 4.4. Market Entropy
- 4.5. Patent/Trademark Analysis
- 5. Global Cocoa Beans Industry Analysis, Insights and Forecast, 2019-2031
- 5.1. Market Analysis, Insights and Forecast - by North America
- 5.1.1. United States
- 5.1.2. Canada
- 5.2. Market Analysis, Insights and Forecast - by Europe
- 5.2.1. Germany
- 5.2.2. Netherland
- 5.2.3. United Kingdom
- 5.2.4. France
- 5.2.5. Belgium
- 5.2.6. Russia
- 5.3. Market Analysis, Insights and Forecast - by Asia-Pacific
- 5.3.1. India
- 5.3.2. Malaysia
- 5.3.3. Indonesia
- 5.3.4. Singapore
- 5.3.5. Japan
- 5.4. Market Analysis, Insights and Forecast - by South America
- 5.4.1. Brazil
- 5.4.2. Ecuador
- 5.5. Market Analysis, Insights and Forecast - by Africa
- 5.5.1. Ghana
- 5.5.2. Ivory Coast
- 5.5.3. Nigeria
- 5.5.4. Cote D'lvoire
- 5.5.5. Cameroon
- 5.6. Market Analysis, Insights and Forecast - by North America
- 5.6.1. United States
- 5.6.2. Canada
- 5.7. Market Analysis, Insights and Forecast - by Europe
- 5.7.1. Germany
- 5.7.2. Netherland
- 5.7.3. United Kingdom
- 5.7.4. France
- 5.7.5. Belgium
- 5.7.6. Russia
- 5.8. Market Analysis, Insights and Forecast - by Asia-Pacific
- 5.8.1. India
- 5.8.2. Malaysia
- 5.8.3. Indonesia
- 5.8.4. Singapore
- 5.8.5. Japan
- 5.9. Market Analysis, Insights and Forecast - by South America
- 5.9.1. Brazil
- 5.9.2. Ecuador
- 5.10. Market Analysis, Insights and Forecast - by Africa
- 5.10.1. Ghana
- 5.10.2. Ivory Coast
- 5.10.3. Nigeria
- 5.10.4. Cote D'lvoire
- 5.10.5. Cameroon
- 5.11. Market Analysis, Insights and Forecast - by Region
- 5.11.1. North America
- 5.11.2. South America
- 5.11.3. Europe
- 5.11.4. Middle East & Africa
- 5.11.5. Asia Pacific
- 5.1. Market Analysis, Insights and Forecast - by North America
- 6. North America Cocoa Beans Industry Analysis, Insights and Forecast, 2019-2031
- 6.1. Market Analysis, Insights and Forecast - by North America
- 6.1.1. United States
- 6.1.2. Canada
- 6.2. Market Analysis, Insights and Forecast - by Europe
- 6.2.1. Germany
- 6.2.2. Netherland
- 6.2.3. United Kingdom
- 6.2.4. France
- 6.2.5. Belgium
- 6.2.6. Russia
- 6.3. Market Analysis, Insights and Forecast - by Asia-Pacific
- 6.3.1. India
- 6.3.2. Malaysia
- 6.3.3. Indonesia
- 6.3.4. Singapore
- 6.3.5. Japan
- 6.4. Market Analysis, Insights and Forecast - by South America
- 6.4.1. Brazil
- 6.4.2. Ecuador
- 6.5. Market Analysis, Insights and Forecast - by Africa
- 6.5.1. Ghana
- 6.5.2. Ivory Coast
- 6.5.3. Nigeria
- 6.5.4. Cote D'lvoire
- 6.5.5. Cameroon
- 6.6. Market Analysis, Insights and Forecast - by North America
- 6.6.1. United States
- 6.6.2. Canada
- 6.7. Market Analysis, Insights and Forecast - by Europe
- 6.7.1. Germany
- 6.7.2. Netherland
- 6.7.3. United Kingdom
- 6.7.4. France
- 6.7.5. Belgium
- 6.7.6. Russia
- 6.8. Market Analysis, Insights and Forecast - by Asia-Pacific
- 6.8.1. India
- 6.8.2. Malaysia
- 6.8.3. Indonesia
- 6.8.4. Singapore
- 6.8.5. Japan
- 6.9. Market Analysis, Insights and Forecast - by South America
- 6.9.1. Brazil
- 6.9.2. Ecuador
- 6.10. Market Analysis, Insights and Forecast - by Africa
- 6.10.1. Ghana
- 6.10.2. Ivory Coast
- 6.10.3. Nigeria
- 6.10.4. Cote D'lvoire
- 6.10.5. Cameroon
- 6.1. Market Analysis, Insights and Forecast - by North America
- 7. South America Cocoa Beans Industry Analysis, Insights and Forecast, 2019-2031
- 7.1. Market Analysis, Insights and Forecast - by North America
- 7.1.1. United States
- 7.1.2. Canada
- 7.2. Market Analysis, Insights and Forecast - by Europe
- 7.2.1. Germany
- 7.2.2. Netherland
- 7.2.3. United Kingdom
- 7.2.4. France
- 7.2.5. Belgium
- 7.2.6. Russia
- 7.3. Market Analysis, Insights and Forecast - by Asia-Pacific
- 7.3.1. India
- 7.3.2. Malaysia
- 7.3.3. Indonesia
- 7.3.4. Singapore
- 7.3.5. Japan
- 7.4. Market Analysis, Insights and Forecast - by South America
- 7.4.1. Brazil
- 7.4.2. Ecuador
- 7.5. Market Analysis, Insights and Forecast - by Africa
- 7.5.1. Ghana
- 7.5.2. Ivory Coast
- 7.5.3. Nigeria
- 7.5.4. Cote D'lvoire
- 7.5.5. Cameroon
- 7.6. Market Analysis, Insights and Forecast - by North America
- 7.6.1. United States
- 7.6.2. Canada
- 7.7. Market Analysis, Insights and Forecast - by Europe
- 7.7.1. Germany
- 7.7.2. Netherland
- 7.7.3. United Kingdom
- 7.7.4. France
- 7.7.5. Belgium
- 7.7.6. Russia
- 7.8. Market Analysis, Insights and Forecast - by Asia-Pacific
- 7.8.1. India
- 7.8.2. Malaysia
- 7.8.3. Indonesia
- 7.8.4. Singapore
- 7.8.5. Japan
- 7.9. Market Analysis, Insights and Forecast - by South America
- 7.9.1. Brazil
- 7.9.2. Ecuador
- 7.10. Market Analysis, Insights and Forecast - by Africa
- 7.10.1. Ghana
- 7.10.2. Ivory Coast
- 7.10.3. Nigeria
- 7.10.4. Cote D'lvoire
- 7.10.5. Cameroon
- 7.1. Market Analysis, Insights and Forecast - by North America
- 8. Europe Cocoa Beans Industry Analysis, Insights and Forecast, 2019-2031
- 8.1. Market Analysis, Insights and Forecast - by North America
- 8.1.1. United States
- 8.1.2. Canada
- 8.2. Market Analysis, Insights and Forecast - by Europe
- 8.2.1. Germany
- 8.2.2. Netherland
- 8.2.3. United Kingdom
- 8.2.4. France
- 8.2.5. Belgium
- 8.2.6. Russia
- 8.3. Market Analysis, Insights and Forecast - by Asia-Pacific
- 8.3.1. India
- 8.3.2. Malaysia
- 8.3.3. Indonesia
- 8.3.4. Singapore
- 8.3.5. Japan
- 8.4. Market Analysis, Insights and Forecast - by South America
- 8.4.1. Brazil
- 8.4.2. Ecuador
- 8.5. Market Analysis, Insights and Forecast - by Africa
- 8.5.1. Ghana
- 8.5.2. Ivory Coast
- 8.5.3. Nigeria
- 8.5.4. Cote D'lvoire
- 8.5.5. Cameroon
- 8.6. Market Analysis, Insights and Forecast - by North America
- 8.6.1. United States
- 8.6.2. Canada
- 8.7. Market Analysis, Insights and Forecast - by Europe
- 8.7.1. Germany
- 8.7.2. Netherland
- 8.7.3. United Kingdom
- 8.7.4. France
- 8.7.5. Belgium
- 8.7.6. Russia
- 8.8. Market Analysis, Insights and Forecast - by Asia-Pacific
- 8.8.1. India
- 8.8.2. Malaysia
- 8.8.3. Indonesia
- 8.8.4. Singapore
- 8.8.5. Japan
- 8.9. Market Analysis, Insights and Forecast - by South America
- 8.9.1. Brazil
- 8.9.2. Ecuador
- 8.10. Market Analysis, Insights and Forecast - by Africa
- 8.10.1. Ghana
- 8.10.2. Ivory Coast
- 8.10.3. Nigeria
- 8.10.4. Cote D'lvoire
- 8.10.5. Cameroon
- 8.1. Market Analysis, Insights and Forecast - by North America
- 9. Middle East & Africa Cocoa Beans Industry Analysis, Insights and Forecast, 2019-2031
- 9.1. Market Analysis, Insights and Forecast - by North America
- 9.1.1. United States
- 9.1.2. Canada
- 9.2. Market Analysis, Insights and Forecast - by Europe
- 9.2.1. Germany
- 9.2.2. Netherland
- 9.2.3. United Kingdom
- 9.2.4. France
- 9.2.5. Belgium
- 9.2.6. Russia
- 9.3. Market Analysis, Insights and Forecast - by Asia-Pacific
- 9.3.1. India
- 9.3.2. Malaysia
- 9.3.3. Indonesia
- 9.3.4. Singapore
- 9.3.5. Japan
- 9.4. Market Analysis, Insights and Forecast - by South America
- 9.4.1. Brazil
- 9.4.2. Ecuador
- 9.5. Market Analysis, Insights and Forecast - by Africa
- 9.5.1. Ghana
- 9.5.2. Ivory Coast
- 9.5.3. Nigeria
- 9.5.4. Cote D'lvoire
- 9.5.5. Cameroon
- 9.6. Market Analysis, Insights and Forecast - by North America
- 9.6.1. United States
- 9.6.2. Canada
- 9.7. Market Analysis, Insights and Forecast - by Europe
- 9.7.1. Germany
- 9.7.2. Netherland
- 9.7.3. United Kingdom
- 9.7.4. France
- 9.7.5. Belgium
- 9.7.6. Russia
- 9.8. Market Analysis, Insights and Forecast - by Asia-Pacific
- 9.8.1. India
- 9.8.2. Malaysia
- 9.8.3. Indonesia
- 9.8.4. Singapore
- 9.8.5. Japan
- 9.9. Market Analysis, Insights and Forecast - by South America
- 9.9.1. Brazil
- 9.9.2. Ecuador
- 9.10. Market Analysis, Insights and Forecast - by Africa
- 9.10.1. Ghana
- 9.10.2. Ivory Coast
- 9.10.3. Nigeria
- 9.10.4. Cote D'lvoire
- 9.10.5. Cameroon
- 9.1. Market Analysis, Insights and Forecast - by North America
- 10. Asia Pacific Cocoa Beans Industry Analysis, Insights and Forecast, 2019-2031
- 10.1. Market Analysis, Insights and Forecast - by North America
- 10.1.1. United States
- 10.1.2. Canada
- 10.2. Market Analysis, Insights and Forecast - by Europe
- 10.2.1. Germany
- 10.2.2. Netherland
- 10.2.3. United Kingdom
- 10.2.4. France
- 10.2.5. Belgium
- 10.2.6. Russia
- 10.3. Market Analysis, Insights and Forecast - by Asia-Pacific
- 10.3.1. India
- 10.3.2. Malaysia
- 10.3.3. Indonesia
- 10.3.4. Singapore
- 10.3.5. Japan
- 10.4. Market Analysis, Insights and Forecast - by South America
- 10.4.1. Brazil
- 10.4.2. Ecuador
- 10.5. Market Analysis, Insights and Forecast - by Africa
- 10.5.1. Ghana
- 10.5.2. Ivory Coast
- 10.5.3. Nigeria
- 10.5.4. Cote D'lvoire
- 10.5.5. Cameroon
- 10.6. Market Analysis, Insights and Forecast - by North America
- 10.6.1. United States
- 10.6.2. Canada
- 10.7. Market Analysis, Insights and Forecast - by Europe
- 10.7.1. Germany
- 10.7.2. Netherland
- 10.7.3. United Kingdom
- 10.7.4. France
- 10.7.5. Belgium
- 10.7.6. Russia
- 10.8. Market Analysis, Insights and Forecast - by Asia-Pacific
- 10.8.1. India
- 10.8.2. Malaysia
- 10.8.3. Indonesia
- 10.8.4. Singapore
- 10.8.5. Japan
- 10.9. Market Analysis, Insights and Forecast - by South America
- 10.9.1. Brazil
- 10.9.2. Ecuador
- 10.10. Market Analysis, Insights and Forecast - by Africa
- 10.10.1. Ghana
- 10.10.2. Ivory Coast
- 10.10.3. Nigeria
- 10.10.4. Cote D'lvoire
- 10.10.5. Cameroon
- 10.1. Market Analysis, Insights and Forecast - by North America
- 11. North America Cocoa Beans Industry Analysis, Insights and Forecast, 2019-2031
- 11.1. Market Analysis, Insights and Forecast - By Country/Sub-region
- 11.1.1 United States
- 11.1.2 Canada
- 11.1.3 Mexico
- 12. Europe Cocoa Beans Industry Analysis, Insights and Forecast, 2019-2031
- 12.1. Market Analysis, Insights and Forecast - By Country/Sub-region
- 12.1.1 Germany
- 12.1.2 United Kingdom
- 12.1.3 France
- 12.1.4 Spain
- 12.1.5 Italy
- 12.1.6 Spain
- 12.1.7 Belgium
- 12.1.8 Netherland
- 12.1.9 Nordics
- 12.1.10 Rest of Europe
- 13. Asia Pacific Cocoa Beans Industry Analysis, Insights and Forecast, 2019-2031
- 13.1. Market Analysis, Insights and Forecast - By Country/Sub-region
- 13.1.1 China
- 13.1.2 Japan
- 13.1.3 India
- 13.1.4 South Korea
- 13.1.5 Southeast Asia
- 13.1.6 Australia
- 13.1.7 Indonesia
- 13.1.8 Phillipes
- 13.1.9 Singapore
- 13.1.10 Thailandc
- 13.1.11 Rest of Asia Pacific
- 14. South America Cocoa Beans Industry Analysis, Insights and Forecast, 2019-2031
- 14.1. Market Analysis, Insights and Forecast - By Country/Sub-region
- 14.1.1 Brazil
- 14.1.2 Argentina
- 14.1.3 Peru
- 14.1.4 Chile
- 14.1.5 Colombia
- 14.1.6 Ecuador
- 14.1.7 Venezuela
- 14.1.8 Rest of South America
- 15. MEA Cocoa Beans Industry Analysis, Insights and Forecast, 2019-2031
- 15.1. Market Analysis, Insights and Forecast - By Country/Sub-region
- 15.1.1 United Arab Emirates
- 15.1.2 Saudi Arabia
- 15.1.3 South Africa
- 15.1.4 Rest of Middle East and Africa
- 16. Competitive Analysis
- 16.1. Global Market Share Analysis 2024
- 16.2. Company Profiles
- 16.2.1 Cargill
- 16.2.1.1. Overview
- 16.2.1.2. Products
- 16.2.1.3. SWOT Analysis
- 16.2.1.4. Recent Developments
- 16.2.1.5. Financials (Based on Availability)
- 16.2.2 Mars
- 16.2.2.1. Overview
- 16.2.2.2. Products
- 16.2.2.3. SWOT Analysis
- 16.2.2.4. Recent Developments
- 16.2.2.5. Financials (Based on Availability)
- 16.2.3 Mondelez International
- 16.2.3.1. Overview
- 16.2.3.2. Products
- 16.2.3.3. SWOT Analysis
- 16.2.3.4. Recent Developments
- 16.2.3.5. Financials (Based on Availability)
- 16.2.4 Olam International
- 16.2.4.1. Overview
- 16.2.4.2. Products
- 16.2.4.3. SWOT Analysis
- 16.2.4.4. Recent Developments
- 16.2.4.5. Financials (Based on Availability)
- 16.2.5 Barry Callebaut
- 16.2.5.1. Overview
- 16.2.5.2. Products
- 16.2.5.3. SWOT Analysis
- 16.2.5.4. Recent Developments
- 16.2.5.5. Financials (Based on Availability)
- 16.2.1 Cargill
List of Figures
- Figure 1: Global Cocoa Beans Industry Revenue Breakdown (Million, %) by Region 2024 & 2032
- Figure 2: North America Cocoa Beans Industry Revenue (Million), by Country 2024 & 2032
- Figure 3: North America Cocoa Beans Industry Revenue Share (%), by Country 2024 & 2032
- Figure 4: Europe Cocoa Beans Industry Revenue (Million), by Country 2024 & 2032
- Figure 5: Europe Cocoa Beans Industry Revenue Share (%), by Country 2024 & 2032
- Figure 6: Asia Pacific Cocoa Beans Industry Revenue (Million), by Country 2024 & 2032
- Figure 7: Asia Pacific Cocoa Beans Industry Revenue Share (%), by Country 2024 & 2032
- Figure 8: South America Cocoa Beans Industry Revenue (Million), by Country 2024 & 2032
- Figure 9: South America Cocoa Beans Industry Revenue Share (%), by Country 2024 & 2032
- Figure 10: MEA Cocoa Beans Industry Revenue (Million), by Country 2024 & 2032
- Figure 11: MEA Cocoa Beans Industry Revenue Share (%), by Country 2024 & 2032
- Figure 12: North America Cocoa Beans Industry Revenue (Million), by North America 2024 & 2032
- Figure 13: North America Cocoa Beans Industry Revenue Share (%), by North America 2024 & 2032
- Figure 14: North America Cocoa Beans Industry Revenue (Million), by Europe 2024 & 2032
- Figure 15: North America Cocoa Beans Industry Revenue Share (%), by Europe 2024 & 2032
- Figure 16: North America Cocoa Beans Industry Revenue (Million), by Asia-Pacific 2024 & 2032
- Figure 17: North America Cocoa Beans Industry Revenue Share (%), by Asia-Pacific 2024 & 2032
- Figure 18: North America Cocoa Beans Industry Revenue (Million), by South America 2024 & 2032
- Figure 19: North America Cocoa Beans Industry Revenue Share (%), by South America 2024 & 2032
- Figure 20: North America Cocoa Beans Industry Revenue (Million), by Africa 2024 & 2032
- Figure 21: North America Cocoa Beans Industry Revenue Share (%), by Africa 2024 & 2032
- Figure 22: North America Cocoa Beans Industry Revenue (Million), by North America 2024 & 2032
- Figure 23: North America Cocoa Beans Industry Revenue Share (%), by North America 2024 & 2032
- Figure 24: North America Cocoa Beans Industry Revenue (Million), by Europe 2024 & 2032
- Figure 25: North America Cocoa Beans Industry Revenue Share (%), by Europe 2024 & 2032
- Figure 26: North America Cocoa Beans Industry Revenue (Million), by Asia-Pacific 2024 & 2032
- Figure 27: North America Cocoa Beans Industry Revenue Share (%), by Asia-Pacific 2024 & 2032
- Figure 28: North America Cocoa Beans Industry Revenue (Million), by South America 2024 & 2032
- Figure 29: North America Cocoa Beans Industry Revenue Share (%), by South America 2024 & 2032
- Figure 30: North America Cocoa Beans Industry Revenue (Million), by Africa 2024 & 2032
- Figure 31: North America Cocoa Beans Industry Revenue Share (%), by Africa 2024 & 2032
- Figure 32: North America Cocoa Beans Industry Revenue (Million), by Country 2024 & 2032
- Figure 33: North America Cocoa Beans Industry Revenue Share (%), by Country 2024 & 2032
- Figure 34: South America Cocoa Beans Industry Revenue (Million), by North America 2024 & 2032
- Figure 35: South America Cocoa Beans Industry Revenue Share (%), by North America 2024 & 2032
- Figure 36: South America Cocoa Beans Industry Revenue (Million), by Europe 2024 & 2032
- Figure 37: South America Cocoa Beans Industry Revenue Share (%), by Europe 2024 & 2032
- Figure 38: South America Cocoa Beans Industry Revenue (Million), by Asia-Pacific 2024 & 2032
- Figure 39: South America Cocoa Beans Industry Revenue Share (%), by Asia-Pacific 2024 & 2032
- Figure 40: South America Cocoa Beans Industry Revenue (Million), by South America 2024 & 2032
- Figure 41: South America Cocoa Beans Industry Revenue Share (%), by South America 2024 & 2032
- Figure 42: South America Cocoa Beans Industry Revenue (Million), by Africa 2024 & 2032
- Figure 43: South America Cocoa Beans Industry Revenue Share (%), by Africa 2024 & 2032
- Figure 44: South America Cocoa Beans Industry Revenue (Million), by North America 2024 & 2032
- Figure 45: South America Cocoa Beans Industry Revenue Share (%), by North America 2024 & 2032
- Figure 46: South America Cocoa Beans Industry Revenue (Million), by Europe 2024 & 2032
- Figure 47: South America Cocoa Beans Industry Revenue Share (%), by Europe 2024 & 2032
- Figure 48: South America Cocoa Beans Industry Revenue (Million), by Asia-Pacific 2024 & 2032
- Figure 49: South America Cocoa Beans Industry Revenue Share (%), by Asia-Pacific 2024 & 2032
- Figure 50: South America Cocoa Beans Industry Revenue (Million), by South America 2024 & 2032
- Figure 51: South America Cocoa Beans Industry Revenue Share (%), by South America 2024 & 2032
- Figure 52: South America Cocoa Beans Industry Revenue (Million), by Africa 2024 & 2032
- Figure 53: South America Cocoa Beans Industry Revenue Share (%), by Africa 2024 & 2032
- Figure 54: South America Cocoa Beans Industry Revenue (Million), by Country 2024 & 2032
- Figure 55: South America Cocoa Beans Industry Revenue Share (%), by Country 2024 & 2032
- Figure 56: Europe Cocoa Beans Industry Revenue (Million), by North America 2024 & 2032
- Figure 57: Europe Cocoa Beans Industry Revenue Share (%), by North America 2024 & 2032
- Figure 58: Europe Cocoa Beans Industry Revenue (Million), by Europe 2024 & 2032
- Figure 59: Europe Cocoa Beans Industry Revenue Share (%), by Europe 2024 & 2032
- Figure 60: Europe Cocoa Beans Industry Revenue (Million), by Asia-Pacific 2024 & 2032
- Figure 61: Europe Cocoa Beans Industry Revenue Share (%), by Asia-Pacific 2024 & 2032
- Figure 62: Europe Cocoa Beans Industry Revenue (Million), by South America 2024 & 2032
- Figure 63: Europe Cocoa Beans Industry Revenue Share (%), by South America 2024 & 2032
- Figure 64: Europe Cocoa Beans Industry Revenue (Million), by Africa 2024 & 2032
- Figure 65: Europe Cocoa Beans Industry Revenue Share (%), by Africa 2024 & 2032
- Figure 66: Europe Cocoa Beans Industry Revenue (Million), by North America 2024 & 2032
- Figure 67: Europe Cocoa Beans Industry Revenue Share (%), by North America 2024 & 2032
- Figure 68: Europe Cocoa Beans Industry Revenue (Million), by Europe 2024 & 2032
- Figure 69: Europe Cocoa Beans Industry Revenue Share (%), by Europe 2024 & 2032
- Figure 70: Europe Cocoa Beans Industry Revenue (Million), by Asia-Pacific 2024 & 2032
- Figure 71: Europe Cocoa Beans Industry Revenue Share (%), by Asia-Pacific 2024 & 2032
- Figure 72: Europe Cocoa Beans Industry Revenue (Million), by South America 2024 & 2032
- Figure 73: Europe Cocoa Beans Industry Revenue Share (%), by South America 2024 & 2032
- Figure 74: Europe Cocoa Beans Industry Revenue (Million), by Africa 2024 & 2032
- Figure 75: Europe Cocoa Beans Industry Revenue Share (%), by Africa 2024 & 2032
- Figure 76: Europe Cocoa Beans Industry Revenue (Million), by Country 2024 & 2032
- Figure 77: Europe Cocoa Beans Industry Revenue Share (%), by Country 2024 & 2032
- Figure 78: Middle East & Africa Cocoa Beans Industry Revenue (Million), by North America 2024 & 2032
- Figure 79: Middle East & Africa Cocoa Beans Industry Revenue Share (%), by North America 2024 & 2032
- Figure 80: Middle East & Africa Cocoa Beans Industry Revenue (Million), by Europe 2024 & 2032
- Figure 81: Middle East & Africa Cocoa Beans Industry Revenue Share (%), by Europe 2024 & 2032
- Figure 82: Middle East & Africa Cocoa Beans Industry Revenue (Million), by Asia-Pacific 2024 & 2032
- Figure 83: Middle East & Africa Cocoa Beans Industry Revenue Share (%), by Asia-Pacific 2024 & 2032
- Figure 84: Middle East & Africa Cocoa Beans Industry Revenue (Million), by South America 2024 & 2032
- Figure 85: Middle East & Africa Cocoa Beans Industry Revenue Share (%), by South America 2024 & 2032
- Figure 86: Middle East & Africa Cocoa Beans Industry Revenue (Million), by Africa 2024 & 2032
- Figure 87: Middle East & Africa Cocoa Beans Industry Revenue Share (%), by Africa 2024 & 2032
- Figure 88: Middle East & Africa Cocoa Beans Industry Revenue (Million), by North America 2024 & 2032
- Figure 89: Middle East & Africa Cocoa Beans Industry Revenue Share (%), by North America 2024 & 2032
- Figure 90: Middle East & Africa Cocoa Beans Industry Revenue (Million), by Europe 2024 & 2032
- Figure 91: Middle East & Africa Cocoa Beans Industry Revenue Share (%), by Europe 2024 & 2032
- Figure 92: Middle East & Africa Cocoa Beans Industry Revenue (Million), by Asia-Pacific 2024 & 2032
- Figure 93: Middle East & Africa Cocoa Beans Industry Revenue Share (%), by Asia-Pacific 2024 & 2032
- Figure 94: Middle East & Africa Cocoa Beans Industry Revenue (Million), by South America 2024 & 2032
- Figure 95: Middle East & Africa Cocoa Beans Industry Revenue Share (%), by South America 2024 & 2032
- Figure 96: Middle East & Africa Cocoa Beans Industry Revenue (Million), by Africa 2024 & 2032
- Figure 97: Middle East & Africa Cocoa Beans Industry Revenue Share (%), by Africa 2024 & 2032
- Figure 98: Middle East & Africa Cocoa Beans Industry Revenue (Million), by Country 2024 & 2032
- Figure 99: Middle East & Africa Cocoa Beans Industry Revenue Share (%), by Country 2024 & 2032
- Figure 100: Asia Pacific Cocoa Beans Industry Revenue (Million), by North America 2024 & 2032
- Figure 101: Asia Pacific Cocoa Beans Industry Revenue Share (%), by North America 2024 & 2032
- Figure 102: Asia Pacific Cocoa Beans Industry Revenue (Million), by Europe 2024 & 2032
- Figure 103: Asia Pacific Cocoa Beans Industry Revenue Share (%), by Europe 2024 & 2032
- Figure 104: Asia Pacific Cocoa Beans Industry Revenue (Million), by Asia-Pacific 2024 & 2032
- Figure 105: Asia Pacific Cocoa Beans Industry Revenue Share (%), by Asia-Pacific 2024 & 2032
- Figure 106: Asia Pacific Cocoa Beans Industry Revenue (Million), by South America 2024 & 2032
- Figure 107: Asia Pacific Cocoa Beans Industry Revenue Share (%), by South America 2024 & 2032
- Figure 108: Asia Pacific Cocoa Beans Industry Revenue (Million), by Africa 2024 & 2032
- Figure 109: Asia Pacific Cocoa Beans Industry Revenue Share (%), by Africa 2024 & 2032
- Figure 110: Asia Pacific Cocoa Beans Industry Revenue (Million), by North America 2024 & 2032
- Figure 111: Asia Pacific Cocoa Beans Industry Revenue Share (%), by North America 2024 & 2032
- Figure 112: Asia Pacific Cocoa Beans Industry Revenue (Million), by Europe 2024 & 2032
- Figure 113: Asia Pacific Cocoa Beans Industry Revenue Share (%), by Europe 2024 & 2032
- Figure 114: Asia Pacific Cocoa Beans Industry Revenue (Million), by Asia-Pacific 2024 & 2032
- Figure 115: Asia Pacific Cocoa Beans Industry Revenue Share (%), by Asia-Pacific 2024 & 2032
- Figure 116: Asia Pacific Cocoa Beans Industry Revenue (Million), by South America 2024 & 2032
- Figure 117: Asia Pacific Cocoa Beans Industry Revenue Share (%), by South America 2024 & 2032
- Figure 118: Asia Pacific Cocoa Beans Industry Revenue (Million), by Africa 2024 & 2032
- Figure 119: Asia Pacific Cocoa Beans Industry Revenue Share (%), by Africa 2024 & 2032
- Figure 120: Asia Pacific Cocoa Beans Industry Revenue (Million), by Country 2024 & 2032
- Figure 121: Asia Pacific Cocoa Beans Industry Revenue Share (%), by Country 2024 & 2032
List of Tables
- Table 1: Global Cocoa Beans Industry Revenue Million Forecast, by Region 2019 & 2032
- Table 2: Global Cocoa Beans Industry Revenue Million Forecast, by North America 2019 & 2032
- Table 3: Global Cocoa Beans Industry Revenue Million Forecast, by Europe 2019 & 2032
- Table 4: Global Cocoa Beans Industry Revenue Million Forecast, by Asia-Pacific 2019 & 2032
- Table 5: Global Cocoa Beans Industry Revenue Million Forecast, by South America 2019 & 2032
- Table 6: Global Cocoa Beans Industry Revenue Million Forecast, by Africa 2019 & 2032
- Table 7: Global Cocoa Beans Industry Revenue Million Forecast, by North America 2019 & 2032
- Table 8: Global Cocoa Beans Industry Revenue Million Forecast, by Europe 2019 & 2032
- Table 9: Global Cocoa Beans Industry Revenue Million Forecast, by Asia-Pacific 2019 & 2032
- Table 10: Global Cocoa Beans Industry Revenue Million Forecast, by South America 2019 & 2032
- Table 11: Global Cocoa Beans Industry Revenue Million Forecast, by Africa 2019 & 2032
- Table 12: Global Cocoa Beans Industry Revenue Million Forecast, by Region 2019 & 2032
- Table 13: Global Cocoa Beans Industry Revenue Million Forecast, by Country 2019 & 2032
- Table 14: United States Cocoa Beans Industry Revenue (Million) Forecast, by Application 2019 & 2032
- Table 15: Canada Cocoa Beans Industry Revenue (Million) Forecast, by Application 2019 & 2032
- Table 16: Mexico Cocoa Beans Industry Revenue (Million) Forecast, by Application 2019 & 2032
- Table 17: Global Cocoa Beans Industry Revenue Million Forecast, by Country 2019 & 2032
- Table 18: Germany Cocoa Beans Industry Revenue (Million) Forecast, by Application 2019 & 2032
- Table 19: United Kingdom Cocoa Beans Industry Revenue (Million) Forecast, by Application 2019 & 2032
- Table 20: France Cocoa Beans Industry Revenue (Million) Forecast, by Application 2019 & 2032
- Table 21: Spain Cocoa Beans Industry Revenue (Million) Forecast, by Application 2019 & 2032
- Table 22: Italy Cocoa Beans Industry Revenue (Million) Forecast, by Application 2019 & 2032
- Table 23: Spain Cocoa Beans Industry Revenue (Million) Forecast, by Application 2019 & 2032
- Table 24: Belgium Cocoa Beans Industry Revenue (Million) Forecast, by Application 2019 & 2032
- Table 25: Netherland Cocoa Beans Industry Revenue (Million) Forecast, by Application 2019 & 2032
- Table 26: Nordics Cocoa Beans Industry Revenue (Million) Forecast, by Application 2019 & 2032
- Table 27: Rest of Europe Cocoa Beans Industry Revenue (Million) Forecast, by Application 2019 & 2032
- Table 28: Global Cocoa Beans Industry Revenue Million Forecast, by Country 2019 & 2032
- Table 29: China Cocoa Beans Industry Revenue (Million) Forecast, by Application 2019 & 2032
- Table 30: Japan Cocoa Beans Industry Revenue (Million) Forecast, by Application 2019 & 2032
- Table 31: India Cocoa Beans Industry Revenue (Million) Forecast, by Application 2019 & 2032
- Table 32: South Korea Cocoa Beans Industry Revenue (Million) Forecast, by Application 2019 & 2032
- Table 33: Southeast Asia Cocoa Beans Industry Revenue (Million) Forecast, by Application 2019 & 2032
- Table 34: Australia Cocoa Beans Industry Revenue (Million) Forecast, by Application 2019 & 2032
- Table 35: Indonesia Cocoa Beans Industry Revenue (Million) Forecast, by Application 2019 & 2032
- Table 36: Phillipes Cocoa Beans Industry Revenue (Million) Forecast, by Application 2019 & 2032
- Table 37: Singapore Cocoa Beans Industry Revenue (Million) Forecast, by Application 2019 & 2032
- Table 38: Thailandc Cocoa Beans Industry Revenue (Million) Forecast, by Application 2019 & 2032
- Table 39: Rest of Asia Pacific Cocoa Beans Industry Revenue (Million) Forecast, by Application 2019 & 2032
- Table 40: Global Cocoa Beans Industry Revenue Million Forecast, by Country 2019 & 2032
- Table 41: Brazil Cocoa Beans Industry Revenue (Million) Forecast, by Application 2019 & 2032
- Table 42: Argentina Cocoa Beans Industry Revenue (Million) Forecast, by Application 2019 & 2032
- Table 43: Peru Cocoa Beans Industry Revenue (Million) Forecast, by Application 2019 & 2032
- Table 44: Chile Cocoa Beans Industry Revenue (Million) Forecast, by Application 2019 & 2032
- Table 45: Colombia Cocoa Beans Industry Revenue (Million) Forecast, by Application 2019 & 2032
- Table 46: Ecuador Cocoa Beans Industry Revenue (Million) Forecast, by Application 2019 & 2032
- Table 47: Venezuela Cocoa Beans Industry Revenue (Million) Forecast, by Application 2019 & 2032
- Table 48: Rest of South America Cocoa Beans Industry Revenue (Million) Forecast, by Application 2019 & 2032
- Table 49: Global Cocoa Beans Industry Revenue Million Forecast, by Country 2019 & 2032
- Table 50: United Arab Emirates Cocoa Beans Industry Revenue (Million) Forecast, by Application 2019 & 2032
- Table 51: Saudi Arabia Cocoa Beans Industry Revenue (Million) Forecast, by Application 2019 & 2032
- Table 52: South Africa Cocoa Beans Industry Revenue (Million) Forecast, by Application 2019 & 2032
- Table 53: Rest of Middle East and Africa Cocoa Beans Industry Revenue (Million) Forecast, by Application 2019 & 2032
- Table 54: Global Cocoa Beans Industry Revenue Million Forecast, by North America 2019 & 2032
- Table 55: Global Cocoa Beans Industry Revenue Million Forecast, by Europe 2019 & 2032
- Table 56: Global Cocoa Beans Industry Revenue Million Forecast, by Asia-Pacific 2019 & 2032
- Table 57: Global Cocoa Beans Industry Revenue Million Forecast, by South America 2019 & 2032
- Table 58: Global Cocoa Beans Industry Revenue Million Forecast, by Africa 2019 & 2032
- Table 59: Global Cocoa Beans Industry Revenue Million Forecast, by North America 2019 & 2032
- Table 60: Global Cocoa Beans Industry Revenue Million Forecast, by Europe 2019 & 2032
- Table 61: Global Cocoa Beans Industry Revenue Million Forecast, by Asia-Pacific 2019 & 2032
- Table 62: Global Cocoa Beans Industry Revenue Million Forecast, by South America 2019 & 2032
- Table 63: Global Cocoa Beans Industry Revenue Million Forecast, by Africa 2019 & 2032
- Table 64: Global Cocoa Beans Industry Revenue Million Forecast, by Country 2019 & 2032
- Table 65: United States Cocoa Beans Industry Revenue (Million) Forecast, by Application 2019 & 2032
- Table 66: Canada Cocoa Beans Industry Revenue (Million) Forecast, by Application 2019 & 2032
- Table 67: Mexico Cocoa Beans Industry Revenue (Million) Forecast, by Application 2019 & 2032
- Table 68: Global Cocoa Beans Industry Revenue Million Forecast, by North America 2019 & 2032
- Table 69: Global Cocoa Beans Industry Revenue Million Forecast, by Europe 2019 & 2032
- Table 70: Global Cocoa Beans Industry Revenue Million Forecast, by Asia-Pacific 2019 & 2032
- Table 71: Global Cocoa Beans Industry Revenue Million Forecast, by South America 2019 & 2032
- Table 72: Global Cocoa Beans Industry Revenue Million Forecast, by Africa 2019 & 2032
- Table 73: Global Cocoa Beans Industry Revenue Million Forecast, by North America 2019 & 2032
- Table 74: Global Cocoa Beans Industry Revenue Million Forecast, by Europe 2019 & 2032
- Table 75: Global Cocoa Beans Industry Revenue Million Forecast, by Asia-Pacific 2019 & 2032
- Table 76: Global Cocoa Beans Industry Revenue Million Forecast, by South America 2019 & 2032
- Table 77: Global Cocoa Beans Industry Revenue Million Forecast, by Africa 2019 & 2032
- Table 78: Global Cocoa Beans Industry Revenue Million Forecast, by Country 2019 & 2032
- Table 79: Brazil Cocoa Beans Industry Revenue (Million) Forecast, by Application 2019 & 2032
- Table 80: Argentina Cocoa Beans Industry Revenue (Million) Forecast, by Application 2019 & 2032
- Table 81: Rest of South America Cocoa Beans Industry Revenue (Million) Forecast, by Application 2019 & 2032
- Table 82: Global Cocoa Beans Industry Revenue Million Forecast, by North America 2019 & 2032
- Table 83: Global Cocoa Beans Industry Revenue Million Forecast, by Europe 2019 & 2032
- Table 84: Global Cocoa Beans Industry Revenue Million Forecast, by Asia-Pacific 2019 & 2032
- Table 85: Global Cocoa Beans Industry Revenue Million Forecast, by South America 2019 & 2032
- Table 86: Global Cocoa Beans Industry Revenue Million Forecast, by Africa 2019 & 2032
- Table 87: Global Cocoa Beans Industry Revenue Million Forecast, by North America 2019 & 2032
- Table 88: Global Cocoa Beans Industry Revenue Million Forecast, by Europe 2019 & 2032
- Table 89: Global Cocoa Beans Industry Revenue Million Forecast, by Asia-Pacific 2019 & 2032
- Table 90: Global Cocoa Beans Industry Revenue Million Forecast, by South America 2019 & 2032
- Table 91: Global Cocoa Beans Industry Revenue Million Forecast, by Africa 2019 & 2032
- Table 92: Global Cocoa Beans Industry Revenue Million Forecast, by Country 2019 & 2032
- Table 93: United Kingdom Cocoa Beans Industry Revenue (Million) Forecast, by Application 2019 & 2032
- Table 94: Germany Cocoa Beans Industry Revenue (Million) Forecast, by Application 2019 & 2032
- Table 95: France Cocoa Beans Industry Revenue (Million) Forecast, by Application 2019 & 2032
- Table 96: Italy Cocoa Beans Industry Revenue (Million) Forecast, by Application 2019 & 2032
- Table 97: Spain Cocoa Beans Industry Revenue (Million) Forecast, by Application 2019 & 2032
- Table 98: Russia Cocoa Beans Industry Revenue (Million) Forecast, by Application 2019 & 2032
- Table 99: Benelux Cocoa Beans Industry Revenue (Million) Forecast, by Application 2019 & 2032
- Table 100: Nordics Cocoa Beans Industry Revenue (Million) Forecast, by Application 2019 & 2032
- Table 101: Rest of Europe Cocoa Beans Industry Revenue (Million) Forecast, by Application 2019 & 2032
- Table 102: Global Cocoa Beans Industry Revenue Million Forecast, by North America 2019 & 2032
- Table 103: Global Cocoa Beans Industry Revenue Million Forecast, by Europe 2019 & 2032
- Table 104: Global Cocoa Beans Industry Revenue Million Forecast, by Asia-Pacific 2019 & 2032
- Table 105: Global Cocoa Beans Industry Revenue Million Forecast, by South America 2019 & 2032
- Table 106: Global Cocoa Beans Industry Revenue Million Forecast, by Africa 2019 & 2032
- Table 107: Global Cocoa Beans Industry Revenue Million Forecast, by North America 2019 & 2032
- Table 108: Global Cocoa Beans Industry Revenue Million Forecast, by Europe 2019 & 2032
- Table 109: Global Cocoa Beans Industry Revenue Million Forecast, by Asia-Pacific 2019 & 2032
- Table 110: Global Cocoa Beans Industry Revenue Million Forecast, by South America 2019 & 2032
- Table 111: Global Cocoa Beans Industry Revenue Million Forecast, by Africa 2019 & 2032
- Table 112: Global Cocoa Beans Industry Revenue Million Forecast, by Country 2019 & 2032
- Table 113: Turkey Cocoa Beans Industry Revenue (Million) Forecast, by Application 2019 & 2032
- Table 114: Israel Cocoa Beans Industry Revenue (Million) Forecast, by Application 2019 & 2032
- Table 115: GCC Cocoa Beans Industry Revenue (Million) Forecast, by Application 2019 & 2032
- Table 116: North Africa Cocoa Beans Industry Revenue (Million) Forecast, by Application 2019 & 2032
- Table 117: South Africa Cocoa Beans Industry Revenue (Million) Forecast, by Application 2019 & 2032
- Table 118: Rest of Middle East & Africa Cocoa Beans Industry Revenue (Million) Forecast, by Application 2019 & 2032
- Table 119: Global Cocoa Beans Industry Revenue Million Forecast, by North America 2019 & 2032
- Table 120: Global Cocoa Beans Industry Revenue Million Forecast, by Europe 2019 & 2032
- Table 121: Global Cocoa Beans Industry Revenue Million Forecast, by Asia-Pacific 2019 & 2032
- Table 122: Global Cocoa Beans Industry Revenue Million Forecast, by South America 2019 & 2032
- Table 123: Global Cocoa Beans Industry Revenue Million Forecast, by Africa 2019 & 2032
- Table 124: Global Cocoa Beans Industry Revenue Million Forecast, by North America 2019 & 2032
- Table 125: Global Cocoa Beans Industry Revenue Million Forecast, by Europe 2019 & 2032
- Table 126: Global Cocoa Beans Industry Revenue Million Forecast, by Asia-Pacific 2019 & 2032
- Table 127: Global Cocoa Beans Industry Revenue Million Forecast, by South America 2019 & 2032
- Table 128: Global Cocoa Beans Industry Revenue Million Forecast, by Africa 2019 & 2032
- Table 129: Global Cocoa Beans Industry Revenue Million Forecast, by Country 2019 & 2032
- Table 130: China Cocoa Beans Industry Revenue (Million) Forecast, by Application 2019 & 2032
- Table 131: India Cocoa Beans Industry Revenue (Million) Forecast, by Application 2019 & 2032
- Table 132: Japan Cocoa Beans Industry Revenue (Million) Forecast, by Application 2019 & 2032
- Table 133: South Korea Cocoa Beans Industry Revenue (Million) Forecast, by Application 2019 & 2032
- Table 134: ASEAN Cocoa Beans Industry Revenue (Million) Forecast, by Application 2019 & 2032
- Table 135: Oceania Cocoa Beans Industry Revenue (Million) Forecast, by Application 2019 & 2032
- Table 136: Rest of Asia Pacific Cocoa Beans Industry Revenue (Million) Forecast, by Application 2019 & 2032
Frequently Asked Questions
1. What is the projected Compound Annual Growth Rate (CAGR) of the Cocoa Beans Industry?
The projected CAGR is approximately 6.81%.
2. Which companies are prominent players in the Cocoa Beans Industry?
Key companies in the market include Cargill , Mars, Mondelez International , Olam International , Barry Callebaut.
3. What are the main segments of the Cocoa Beans Industry?
The market segments include North America, Europe, Asia-Pacific, South America, Africa, North America, Europe, Asia-Pacific, South America, Africa.
4. Can you provide details about the market size?
The market size is estimated to be USD 17.24 Million as of 2022.
5. What are some drivers contributing to market growth?
Increasing Demand for Indian Rice; Enhancing Production Capacities; Increasing Government Initiatives.
6. What are the notable trends driving market growth?
Wide Application of Cocoa in Different End-user Industries.
7. Are there any restraints impacting market growth?
Abiotic and Biotic Stresses in Rice Cultivation; High Market Entry Costs.
8. Can you provide examples of recent developments in the market?
October 2022: The European Union and its partners have collectively planned to raise 450 million euros (USD442 million) to support Ivory Coast's push to tackle child labor and deforestation linked to cocoa production.
9. What pricing options are available for accessing the report?
Pricing options include single-user, multi-user, and enterprise licenses priced at USD 4750, USD 5250, and USD 8750 respectively.
10. Is the market size provided in terms of value or volume?
The market size is provided in terms of value, measured in Million.
11. Are there any specific market keywords associated with the report?
Yes, the market keyword associated with the report is "Cocoa Beans Industry," which aids in identifying and referencing the specific market segment covered.
12. How do I determine which pricing option suits my needs best?
The pricing options vary based on user requirements and access needs. Individual users may opt for single-user licenses, while businesses requiring broader access may choose multi-user or enterprise licenses for cost-effective access to the report.
13. Are there any additional resources or data provided in the Cocoa Beans Industry report?
While the report offers comprehensive insights, it's advisable to review the specific contents or supplementary materials provided to ascertain if additional resources or data are available.
14. How can I stay updated on further developments or reports in the Cocoa Beans Industry?
To stay informed about further developments, trends, and reports in the Cocoa Beans Industry, consider subscribing to industry newsletters, following relevant companies and organizations, or regularly checking reputable industry news sources and publications.
Methodology
Step 1 - Identification of Relevant Samples Size from Population Database


Step 2 - Approaches for Defining Global Market Size (Value, Volume* & Price*)

Note*: In applicable scenarios
Step 3 - Data Sources
Primary Research
- Web Analytics
- Survey Reports
- Research Institute
- Latest Research Reports
- Opinion Leaders
Secondary Research
- Annual Reports
- White Paper
- Latest Press Release
- Industry Association
- Paid Database
- Investor Presentations

Step 4 - Data Triangulation
Involves using different sources of information in order to increase the validity of a study
These sources are likely to be stakeholders in a program - participants, other researchers, program staff, other community members, and so on.
Then we put all data in single framework & apply various statistical tools to find out the dynamic on the market.
During the analysis stage, feedback from the stakeholder groups would be compared to determine areas of agreement as well as areas of divergence


