

Key Insights
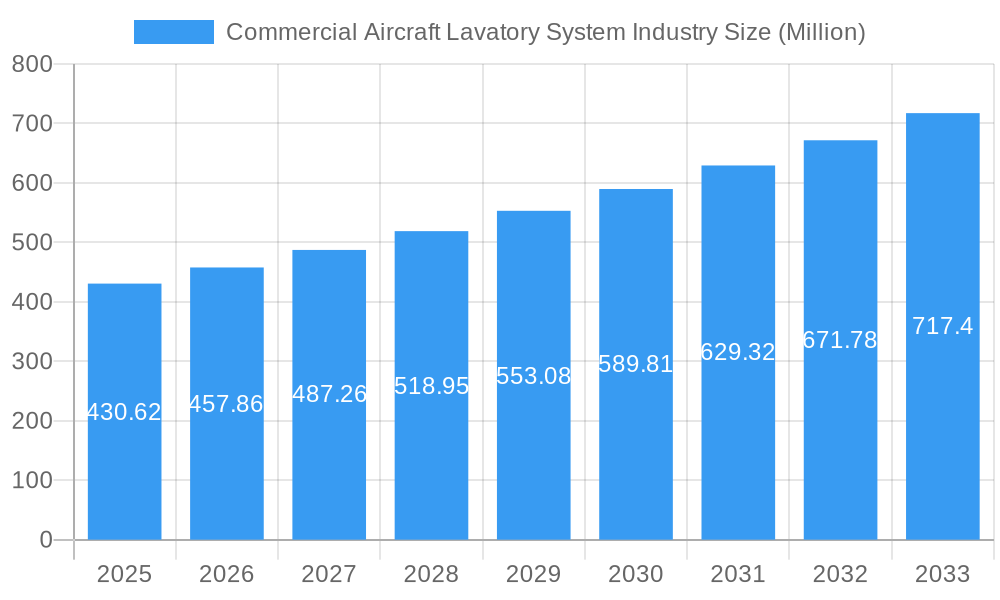
The global commercial aircraft lavatory system market is experiencing robust growth, projected to reach \$430.62 million in 2025 and maintain a Compound Annual Growth Rate (CAGR) of 6.22% from 2025 to 2033. This expansion is fueled by several key factors. The increasing number of air travelers globally necessitates a higher demand for aircraft, leading to a corresponding rise in the need for lavatory systems. Furthermore, technological advancements are driving the adoption of more efficient, lightweight, and sustainable lavatory solutions. Airlines are increasingly prioritizing passenger comfort and experience, leading to investments in improved lavatory designs and features. The growing preference for eco-friendly materials and designs further contributes to market growth, as airlines strive to reduce their environmental impact. The market is segmented by aircraft type (narrow-body, wide-body, regional jets), with wide-body aircraft likely exhibiting the highest growth due to their larger passenger capacity. Key players like Safran, Collins Aerospace, and Geven SPA are driving innovation and competition within the market, constantly introducing new products and services to meet evolving industry needs. Regional variations exist, with North America and Europe currently holding significant market shares due to the high concentration of aircraft manufacturers and airlines in these regions; however, the Asia-Pacific region is poised for substantial growth in the coming years, driven by increasing air travel demand within the region.
Commercial Aircraft Lavatory System Industry Market Size (In Million)
The competitive landscape is characterized by a mix of established players and emerging companies. Larger companies leverage their extensive experience and global reach to capture significant market share. Smaller companies often focus on niche markets and specialized technologies, providing innovation and competition. Strategic partnerships and mergers & acquisitions are common strategies employed to enhance market position and technological capabilities. Future growth will be influenced by factors such as fluctuating fuel prices (affecting airline budgets), economic conditions (influencing passenger demand), and technological developments (driving innovation in lavatory design and materials). The consistent growth projected for the market indicates a promising outlook for manufacturers and suppliers of commercial aircraft lavatory systems. Sustained investment in research and development is crucial for companies to maintain a competitive edge and cater to evolving market needs.
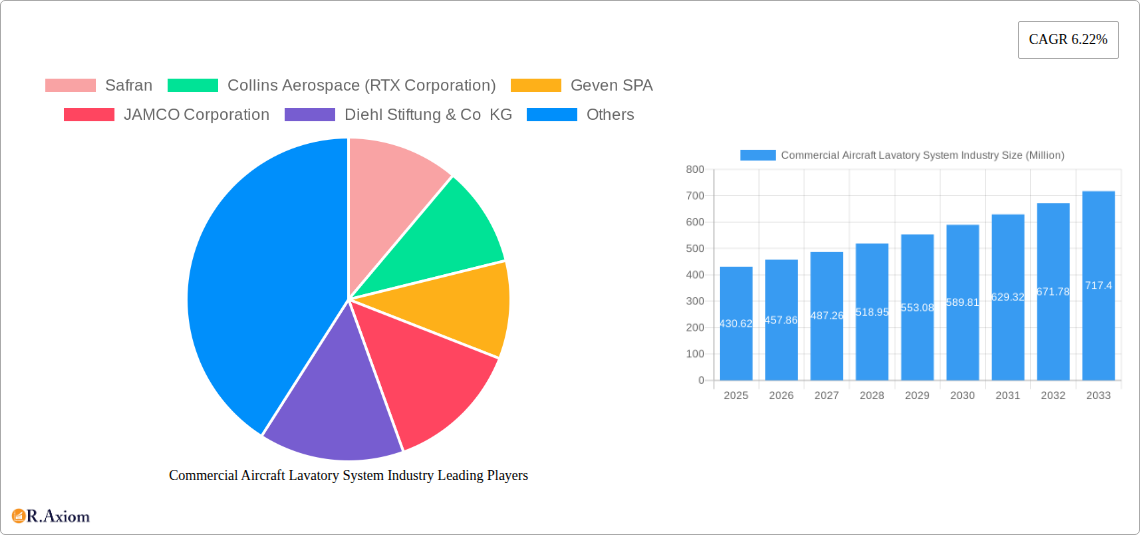
Commercial Aircraft Lavatory System Industry Company Market Share
This comprehensive report provides an in-depth analysis of the Commercial Aircraft Lavatory System industry, offering crucial insights for stakeholders seeking to navigate this dynamic market. The study period covers 2019-2033, with a focus on 2025 as the base and estimated year, and a forecast period of 2025-2033. The historical period analyzed is 2019-2024. The report includes detailed segmentation by aircraft type (Narrow-body, Wide-body, Regional Jets) and incorporates data on market size, growth projections, competitive dynamics, and key industry players like Safran, Collins Aerospace (RTX Corporation), Geven SPA, JAMCO Corporation, Diehl Stiftung & Co KG, The NORDAM Group LLC, Yokohama Aerospace America Inc, Satys, Hong Kong Aircraft Engineering Company Limited, and CIRCOR Aerospace.
Commercial Aircraft Lavatory System Industry Market Concentration & Innovation
The Commercial Aircraft Lavatory System market exhibits a moderately concentrated structure, with a few major players holding significant market share. Safran and Collins Aerospace, for example, command a combined xx% market share in 2025, driven by their extensive product portfolios and global presence. However, several regional players and niche specialists contribute to the overall competitive landscape, resulting in a dynamic environment with opportunities for both consolidation and innovation. Market concentration is influenced by factors such as economies of scale, technological advancements, and access to supply chains.
Innovation Drivers:
- Lightweight materials: The focus on fuel efficiency is driving the adoption of lightweight lavatory components, reducing overall aircraft weight and operational costs.
- Advanced waste management systems: Innovations in vacuum toilet systems and waste disposal technologies improve hygiene and reduce environmental impact.
- Improved ergonomics and design: Emphasis on user experience and accessibility is leading to enhanced lavatory designs for passenger comfort.
- Smart lavatory technologies: Integration of sensors and digital interfaces enables real-time monitoring, predictive maintenance, and optimized resource management.
Regulatory Frameworks:
Stringent safety and environmental regulations influence lavatory system design and manufacturing. Compliance requirements necessitate continuous innovation in materials, waste management, and hygiene protocols.
Mergers & Acquisitions (M&A) Activity:
The past five years have witnessed xx M&A deals in this industry, with a total value of approximately $xx Million. These deals reflect strategic efforts to expand product portfolios, enhance technological capabilities, and gain access to new markets. The average deal value was approximately $xx Million.
Commercial Aircraft Lavatory System Industry Industry Trends & Insights
The global commercial aircraft lavatory system market is experiencing robust growth, projected to achieve a CAGR of xx% during the forecast period (2025-2033). This growth is propelled by several key factors:
- Rising Air Travel Demand: The increasing global air passenger traffic is a primary driver, demanding more lavatory systems across various aircraft types.
- Technological Advancements: Innovations in lightweight materials, waste management, and smart technologies are boosting market growth.
- Focus on Passenger Comfort: Airlines are increasingly prioritizing passenger experience, leading to investment in advanced and more comfortable lavatory systems.
- Fleet Modernization: The ongoing renewal and expansion of aircraft fleets across major airlines fuels demand.
Market penetration of advanced lavatory systems, such as those featuring integrated waste management and smart technologies, is currently estimated at xx%, projected to increase to xx% by 2033. However, competitive dynamics, characterized by fierce rivalry among established players and emerging entrants, impact growth trajectories and pricing strategies.
Dominant Markets & Segments in Commercial Aircraft Lavatory System Industry
The North American region holds a dominant position in the commercial aircraft lavatory system market, accounting for approximately xx% of the global market share in 2025. This dominance is primarily attributed to:
- Large domestic and international air travel markets: High passenger traffic fuels demand.
- Strong presence of major aircraft manufacturers and suppliers: Proximity to key players fosters industry growth.
- Robust aerospace infrastructure: Well-developed manufacturing and maintenance facilities support industry expansion.
Aircraft Type Segmentation:
- Narrow-body aircraft: This segment dominates the market due to the large number of narrow-body aircraft in operation globally. Growth is driven by the increasing demand for short-haul and regional flights.
- Wide-body aircraft: The wide-body segment demonstrates significant growth potential, driven by expansion in long-haul routes and the growing preference for premium travel experiences.
- Regional jets: This segment is expected to witness moderate growth, largely aligned with the expansion of regional air travel networks.
Further analysis shows that the narrow-body segment is projected to capture the largest market share during the forecast period, representing approximately xx% of the total market value by 2033. This is due to the sheer volume of narrow-body aircraft currently in service and those projected to enter service in the coming years.
Commercial Aircraft Lavatory System Industry Product Developments
Recent product innovations focus on lightweighting, improved hygiene, and sustainability. Manufacturers are incorporating advanced materials such as composites and advanced polymers to reduce weight and improve fuel efficiency. Self-cleaning and automated waste management systems are becoming increasingly prevalent, enhancing hygiene and reducing maintenance requirements. Moreover, the integration of smart technologies provides real-time monitoring and predictive maintenance, further optimizing operational efficiency. The market fit for these advancements is strong, driven by airline priorities for operational cost reduction and enhanced passenger satisfaction.
Report Scope & Segmentation Analysis
This report provides a comprehensive analysis of the commercial aircraft lavatory system market, segmented by aircraft type:
Narrow-body aircraft: This segment is characterized by high volume and competitive pricing, with a focus on efficient and cost-effective solutions. Market growth is anticipated to be xx% CAGR.
Wide-body aircraft: This segment emphasizes premium features and advanced technologies to cater to the demands of long-haul flights. Growth is projected at a xx% CAGR.
Regional jets: This segment experiences moderate growth, driven by the expansion of regional air travel networks. The CAGR for this segment is expected to be xx%. Competitive dynamics within each segment vary, influenced by factors such as pricing strategies, product features, and technological advancements.
Key Drivers of Commercial Aircraft Lavatory System Industry Growth
Several key factors are driving the growth of the commercial aircraft lavatory system industry:
- Increased air passenger traffic: Global air travel continues to grow, demanding a larger number of lavatory systems.
- Technological advancements: Innovations in materials, waste management, and smart technologies are enhancing system performance and efficiency.
- Stringent safety and environmental regulations: Regulatory compliance necessitates ongoing technological improvements and innovation.
- Focus on passenger experience: Airlines are prioritizing improved passenger comfort and hygiene, which is reflected in their investment in advanced lavatory systems.
Challenges in the Commercial Aircraft Lavatory System Industry Sector
Challenges facing the industry include:
- Supply chain disruptions: Global supply chain volatility can impact the timely delivery of components and affect production schedules. This resulted in a xx% increase in production costs in 2022.
- Stringent regulatory compliance: Meeting evolving safety and environmental standards can be costly and complex.
- Intense competition: The market is characterized by a high degree of competition among established players and emerging entrants. This has resulted in pricing pressure across various segments.
Emerging Opportunities in Commercial Aircraft Lavatory System Industry
The industry presents several emerging opportunities:
- Growing demand for sustainable solutions: Airlines are increasingly prioritizing environmentally friendly lavatory systems.
- Development of smart technologies: Integration of sensors and data analytics enables predictive maintenance and optimized resource management.
- Expansion into new markets: Emerging economies are experiencing growth in air travel, presenting new opportunities for market penetration.
Leading Players in the Commercial Aircraft Lavatory System Industry Market
- Safran
- Collins Aerospace (RTX Corporation)
- Geven SPA
- JAMCO Corporation
- Diehl Stiftung & Co KG
- The NORDAM Group LLC
- Yokohama Aerospace America Inc
- Satys
- Hong Kong Aircraft Engineering Company Limited
- CIRCOR Aerospace
Key Developments in Commercial Aircraft Lavatory System Industry Industry
- January 2023: Safran launched a new lightweight lavatory system featuring advanced waste management technology.
- June 2022: Collins Aerospace acquired a smaller lavatory system manufacturer, expanding its product portfolio.
- October 2021: Geven SPA announced a strategic partnership with a leading composite materials supplier to enhance product development.
Strategic Outlook for Commercial Aircraft Lavatory System Industry Market
The commercial aircraft lavatory system market is poised for continued growth, driven by factors such as increasing air passenger traffic, technological innovation, and a strong focus on passenger experience. Opportunities exist in the development and adoption of sustainable and smart lavatory systems. Key players are likely to pursue strategies focused on innovation, strategic partnerships, and expansion into new markets to maintain and enhance their competitive positions in this dynamic industry. The long-term outlook remains positive, anticipating sustained growth and transformation throughout the forecast period.
Commercial Aircraft Lavatory System Industry Segmentation
- 1. Production Analysis
- 2. Consumption Analysis
- 3. Import Market Analysis (Value & Volume)
- 4. Export Market Analysis (Value & Volume)
- 5. Price Trend Analysis
Commercial Aircraft Lavatory System Industry Segmentation By Geography
-
1. North America
- 1.1. United States
- 1.2. Canada
-
2. Europe
- 2.1. United Kingdom
- 2.2. Germany
- 2.3. France
- 2.4. Italy
- 2.5. Russia
- 2.6. Rest of Europe
-
3. Asia Pacific
- 3.1. China
- 3.2. India
- 3.3. Japan
- 3.4. South Korea
- 3.5. Rest of Asia Pacific
-
4. Latin America
- 4.1. Brazil
- 4.2. Mexico
- 4.3. Rest of Latin America
-
5. Middle East and Africa
- 5.1. United Arab Emirates
- 5.2. Saudi Arabia
- 5.3. Qatar
- 5.4. South Africa
- 5.5. Rest of Middle East and Africa
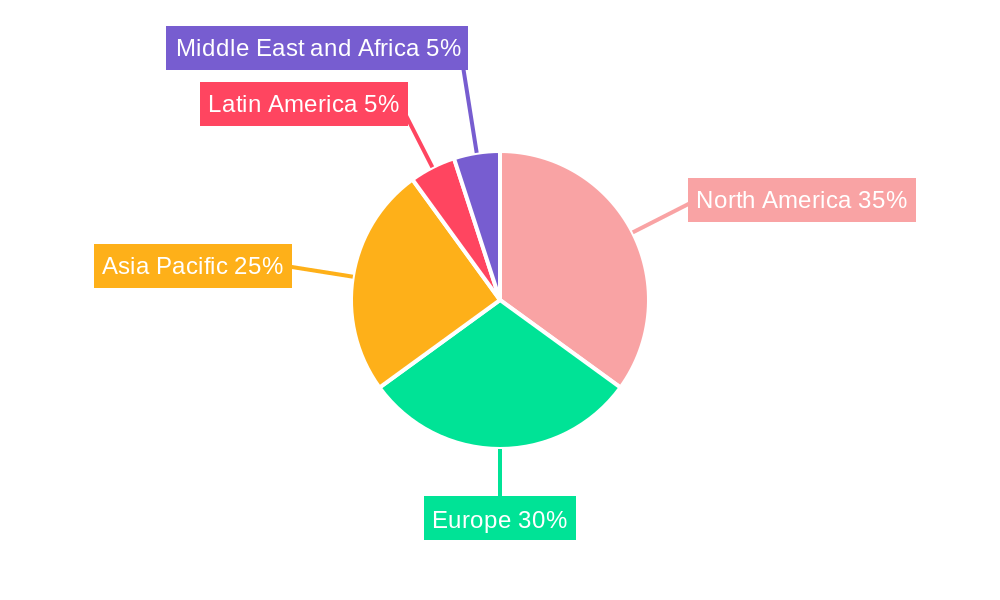
Commercial Aircraft Lavatory System Industry Regional Market Share
Geographic Coverage of Commercial Aircraft Lavatory System Industry
Commercial Aircraft Lavatory System Industry REPORT HIGHLIGHTS
| Aspects | Details |
|---|---|
| Study Period | 2020-2034 |
| Base Year | 2025 |
| Estimated Year | 2026 |
| Forecast Period | 2026-2034 |
| Historical Period | 2020-2025 |
| Growth Rate | CAGR of 6.22% from 2020-2034 |
| Segmentation |
|
Table of Contents
- 1. Introduction
- 1.1. Research Scope
- 1.2. Market Segmentation
- 1.3. Research Objective
- 1.4. Definitions and Assumptions
- 2. Executive Summary
- 2.1. Market Snapshot
- 3. Market Dynamics
- 3.1. Market Drivers
- 3.2. Market Restrains
- 3.3. Market Trends
- 3.4. Market Opportunities
- 4. Market Factor Analysis
- 4.1. Porters Five Forces
- 4.1.1. Bargaining Power of Suppliers
- 4.1.2. Bargaining Power of Buyers
- 4.1.3. Threat of New Entrants
- 4.1.4. Threat of Substitutes
- 4.1.5. Competitive Rivalry
- 4.2. PESTEL analysis
- 4.3. BCG Analysis
- 4.3.1. Stars (High Growth, High Market Share)
- 4.3.2. Cash Cows (Low Growth, High Market Share)
- 4.3.3. Question Mark (High Growth, Low Market Share)
- 4.3.4. Dogs (Low Growth, Low Market Share)
- 4.4. Ansoff Matrix Analysis
- 4.5. Supply Chain Analysis
- 4.6. Regulatory Landscape
- 4.7. Current Market Potential and Opportunity Assessment (TAM–SAM–SOM Framework)
- 4.8. RAX Analyst Note
- 4.1. Porters Five Forces
- 5. Market Analysis, Insights and Forecast 2021-2033
- 5.1. Market Analysis, Insights and Forecast - by Production Analysis
- 5.2. Market Analysis, Insights and Forecast - by Consumption Analysis
- 5.3. Market Analysis, Insights and Forecast - by Import Market Analysis (Value & Volume)
- 5.4. Market Analysis, Insights and Forecast - by Export Market Analysis (Value & Volume)
- 5.5. Market Analysis, Insights and Forecast - by Price Trend Analysis
- 5.6. Market Analysis, Insights and Forecast - by Region
- 5.6.1. North America
- 5.6.2. Europe
- 5.6.3. Asia Pacific
- 5.6.4. Latin America
- 5.6.5. Middle East and Africa
- 6. Global Commercial Aircraft Lavatory System Industry Analysis, Insights and Forecast, 2021-2033
- 6.1. Market Analysis, Insights and Forecast - by Production Analysis
- 6.2. Market Analysis, Insights and Forecast - by Consumption Analysis
- 6.3. Market Analysis, Insights and Forecast - by Import Market Analysis (Value & Volume)
- 6.4. Market Analysis, Insights and Forecast - by Export Market Analysis (Value & Volume)
- 6.5. Market Analysis, Insights and Forecast - by Price Trend Analysis
- 7. North America Commercial Aircraft Lavatory System Industry Analysis, Insights and Forecast, 2020-2032
- 7.1. Market Analysis, Insights and Forecast - by Production Analysis
- 7.2. Market Analysis, Insights and Forecast - by Consumption Analysis
- 7.3. Market Analysis, Insights and Forecast - by Import Market Analysis (Value & Volume)
- 7.4. Market Analysis, Insights and Forecast - by Export Market Analysis (Value & Volume)
- 7.5. Market Analysis, Insights and Forecast - by Price Trend Analysis
- 8. Europe Commercial Aircraft Lavatory System Industry Analysis, Insights and Forecast, 2020-2032
- 8.1. Market Analysis, Insights and Forecast - by Production Analysis
- 8.2. Market Analysis, Insights and Forecast - by Consumption Analysis
- 8.3. Market Analysis, Insights and Forecast - by Import Market Analysis (Value & Volume)
- 8.4. Market Analysis, Insights and Forecast - by Export Market Analysis (Value & Volume)
- 8.5. Market Analysis, Insights and Forecast - by Price Trend Analysis
- 9. Asia Pacific Commercial Aircraft Lavatory System Industry Analysis, Insights and Forecast, 2020-2032
- 9.1. Market Analysis, Insights and Forecast - by Production Analysis
- 9.2. Market Analysis, Insights and Forecast - by Consumption Analysis
- 9.3. Market Analysis, Insights and Forecast - by Import Market Analysis (Value & Volume)
- 9.4. Market Analysis, Insights and Forecast - by Export Market Analysis (Value & Volume)
- 9.5. Market Analysis, Insights and Forecast - by Price Trend Analysis
- 10. Latin America Commercial Aircraft Lavatory System Industry Analysis, Insights and Forecast, 2020-2032
- 10.1. Market Analysis, Insights and Forecast - by Production Analysis
- 10.2. Market Analysis, Insights and Forecast - by Consumption Analysis
- 10.3. Market Analysis, Insights and Forecast - by Import Market Analysis (Value & Volume)
- 10.4. Market Analysis, Insights and Forecast - by Export Market Analysis (Value & Volume)
- 10.5. Market Analysis, Insights and Forecast - by Price Trend Analysis
- 11. Middle East and Africa Commercial Aircraft Lavatory System Industry Analysis, Insights and Forecast, 2020-2032
- 11.1. Market Analysis, Insights and Forecast - by Production Analysis
- 11.2. Market Analysis, Insights and Forecast - by Consumption Analysis
- 11.3. Market Analysis, Insights and Forecast - by Import Market Analysis (Value & Volume)
- 11.4. Market Analysis, Insights and Forecast - by Export Market Analysis (Value & Volume)
- 11.5. Market Analysis, Insights and Forecast - by Price Trend Analysis
- 12. Competitive Analysis
- 12.1. Company Profiles
- 12.1.1 Safran
- 12.1.1.1. Company Overview
- 12.1.1.2. Products
- 12.1.1.3. Company Financials
- 12.1.1.4. SWOT Analysis
- 12.1.2 Collins Aerospace (RTX Corporation)
- 12.1.2.1. Company Overview
- 12.1.2.2. Products
- 12.1.2.3. Company Financials
- 12.1.2.4. SWOT Analysis
- 12.1.3 Geven SPA
- 12.1.3.1. Company Overview
- 12.1.3.2. Products
- 12.1.3.3. Company Financials
- 12.1.3.4. SWOT Analysis
- 12.1.4 JAMCO Corporation
- 12.1.4.1. Company Overview
- 12.1.4.2. Products
- 12.1.4.3. Company Financials
- 12.1.4.4. SWOT Analysis
- 12.1.5 Diehl Stiftung & Co KG
- 12.1.5.1. Company Overview
- 12.1.5.2. Products
- 12.1.5.3. Company Financials
- 12.1.5.4. SWOT Analysis
- 12.1.6 The NORDAM Group LLC
- 12.1.6.1. Company Overview
- 12.1.6.2. Products
- 12.1.6.3. Company Financials
- 12.1.6.4. SWOT Analysis
- 12.1.7 Yokohama Aerospace America Inc
- 12.1.7.1. Company Overview
- 12.1.7.2. Products
- 12.1.7.3. Company Financials
- 12.1.7.4. SWOT Analysis
- 12.1.8 Satys
- 12.1.8.1. Company Overview
- 12.1.8.2. Products
- 12.1.8.3. Company Financials
- 12.1.8.4. SWOT Analysis
- 12.1.9 Hong Kong Aircraft Engineering Company Limited
- 12.1.9.1. Company Overview
- 12.1.9.2. Products
- 12.1.9.3. Company Financials
- 12.1.9.4. SWOT Analysis
- 12.1.10 CIRCOR Aerospac
- 12.1.10.1. Company Overview
- 12.1.10.2. Products
- 12.1.10.3. Company Financials
- 12.1.10.4. SWOT Analysis
- 12.1.1 Safran
- 12.2. Market Entropy
- 12.2.1 Company's Key Areas Served
- 12.2.2 Recent Developments
- 12.3. Company Market Share Analysis 2025
- 12.3.1 Top 5 Companies Market Share Analysis
- 12.3.2 Top 3 Companies Market Share Analysis
- 12.4. List of Potential Customers
- 13. Research Methodology
List of Figures
- Figure 1: Global Commercial Aircraft Lavatory System Industry Revenue Breakdown (Million, %) by Region 2025 & 2033
- Figure 2: North America Commercial Aircraft Lavatory System Industry Revenue (Million), by Production Analysis 2025 & 2033
- Figure 3: North America Commercial Aircraft Lavatory System Industry Revenue Share (%), by Production Analysis 2025 & 2033
- Figure 4: North America Commercial Aircraft Lavatory System Industry Revenue (Million), by Consumption Analysis 2025 & 2033
- Figure 5: North America Commercial Aircraft Lavatory System Industry Revenue Share (%), by Consumption Analysis 2025 & 2033
- Figure 6: North America Commercial Aircraft Lavatory System Industry Revenue (Million), by Import Market Analysis (Value & Volume) 2025 & 2033
- Figure 7: North America Commercial Aircraft Lavatory System Industry Revenue Share (%), by Import Market Analysis (Value & Volume) 2025 & 2033
- Figure 8: North America Commercial Aircraft Lavatory System Industry Revenue (Million), by Export Market Analysis (Value & Volume) 2025 & 2033
- Figure 9: North America Commercial Aircraft Lavatory System Industry Revenue Share (%), by Export Market Analysis (Value & Volume) 2025 & 2033
- Figure 10: North America Commercial Aircraft Lavatory System Industry Revenue (Million), by Price Trend Analysis 2025 & 2033
- Figure 11: North America Commercial Aircraft Lavatory System Industry Revenue Share (%), by Price Trend Analysis 2025 & 2033
- Figure 12: North America Commercial Aircraft Lavatory System Industry Revenue (Million), by Country 2025 & 2033
- Figure 13: North America Commercial Aircraft Lavatory System Industry Revenue Share (%), by Country 2025 & 2033
- Figure 14: Europe Commercial Aircraft Lavatory System Industry Revenue (Million), by Production Analysis 2025 & 2033
- Figure 15: Europe Commercial Aircraft Lavatory System Industry Revenue Share (%), by Production Analysis 2025 & 2033
- Figure 16: Europe Commercial Aircraft Lavatory System Industry Revenue (Million), by Consumption Analysis 2025 & 2033
- Figure 17: Europe Commercial Aircraft Lavatory System Industry Revenue Share (%), by Consumption Analysis 2025 & 2033
- Figure 18: Europe Commercial Aircraft Lavatory System Industry Revenue (Million), by Import Market Analysis (Value & Volume) 2025 & 2033
- Figure 19: Europe Commercial Aircraft Lavatory System Industry Revenue Share (%), by Import Market Analysis (Value & Volume) 2025 & 2033
- Figure 20: Europe Commercial Aircraft Lavatory System Industry Revenue (Million), by Export Market Analysis (Value & Volume) 2025 & 2033
- Figure 21: Europe Commercial Aircraft Lavatory System Industry Revenue Share (%), by Export Market Analysis (Value & Volume) 2025 & 2033
- Figure 22: Europe Commercial Aircraft Lavatory System Industry Revenue (Million), by Price Trend Analysis 2025 & 2033
- Figure 23: Europe Commercial Aircraft Lavatory System Industry Revenue Share (%), by Price Trend Analysis 2025 & 2033
- Figure 24: Europe Commercial Aircraft Lavatory System Industry Revenue (Million), by Country 2025 & 2033
- Figure 25: Europe Commercial Aircraft Lavatory System Industry Revenue Share (%), by Country 2025 & 2033
- Figure 26: Asia Pacific Commercial Aircraft Lavatory System Industry Revenue (Million), by Production Analysis 2025 & 2033
- Figure 27: Asia Pacific Commercial Aircraft Lavatory System Industry Revenue Share (%), by Production Analysis 2025 & 2033
- Figure 28: Asia Pacific Commercial Aircraft Lavatory System Industry Revenue (Million), by Consumption Analysis 2025 & 2033
- Figure 29: Asia Pacific Commercial Aircraft Lavatory System Industry Revenue Share (%), by Consumption Analysis 2025 & 2033
- Figure 30: Asia Pacific Commercial Aircraft Lavatory System Industry Revenue (Million), by Import Market Analysis (Value & Volume) 2025 & 2033
- Figure 31: Asia Pacific Commercial Aircraft Lavatory System Industry Revenue Share (%), by Import Market Analysis (Value & Volume) 2025 & 2033
- Figure 32: Asia Pacific Commercial Aircraft Lavatory System Industry Revenue (Million), by Export Market Analysis (Value & Volume) 2025 & 2033
- Figure 33: Asia Pacific Commercial Aircraft Lavatory System Industry Revenue Share (%), by Export Market Analysis (Value & Volume) 2025 & 2033
- Figure 34: Asia Pacific Commercial Aircraft Lavatory System Industry Revenue (Million), by Price Trend Analysis 2025 & 2033
- Figure 35: Asia Pacific Commercial Aircraft Lavatory System Industry Revenue Share (%), by Price Trend Analysis 2025 & 2033
- Figure 36: Asia Pacific Commercial Aircraft Lavatory System Industry Revenue (Million), by Country 2025 & 2033
- Figure 37: Asia Pacific Commercial Aircraft Lavatory System Industry Revenue Share (%), by Country 2025 & 2033
- Figure 38: Latin America Commercial Aircraft Lavatory System Industry Revenue (Million), by Production Analysis 2025 & 2033
- Figure 39: Latin America Commercial Aircraft Lavatory System Industry Revenue Share (%), by Production Analysis 2025 & 2033
- Figure 40: Latin America Commercial Aircraft Lavatory System Industry Revenue (Million), by Consumption Analysis 2025 & 2033
- Figure 41: Latin America Commercial Aircraft Lavatory System Industry Revenue Share (%), by Consumption Analysis 2025 & 2033
- Figure 42: Latin America Commercial Aircraft Lavatory System Industry Revenue (Million), by Import Market Analysis (Value & Volume) 2025 & 2033
- Figure 43: Latin America Commercial Aircraft Lavatory System Industry Revenue Share (%), by Import Market Analysis (Value & Volume) 2025 & 2033
- Figure 44: Latin America Commercial Aircraft Lavatory System Industry Revenue (Million), by Export Market Analysis (Value & Volume) 2025 & 2033
- Figure 45: Latin America Commercial Aircraft Lavatory System Industry Revenue Share (%), by Export Market Analysis (Value & Volume) 2025 & 2033
- Figure 46: Latin America Commercial Aircraft Lavatory System Industry Revenue (Million), by Price Trend Analysis 2025 & 2033
- Figure 47: Latin America Commercial Aircraft Lavatory System Industry Revenue Share (%), by Price Trend Analysis 2025 & 2033
- Figure 48: Latin America Commercial Aircraft Lavatory System Industry Revenue (Million), by Country 2025 & 2033
- Figure 49: Latin America Commercial Aircraft Lavatory System Industry Revenue Share (%), by Country 2025 & 2033
- Figure 50: Middle East and Africa Commercial Aircraft Lavatory System Industry Revenue (Million), by Production Analysis 2025 & 2033
- Figure 51: Middle East and Africa Commercial Aircraft Lavatory System Industry Revenue Share (%), by Production Analysis 2025 & 2033
- Figure 52: Middle East and Africa Commercial Aircraft Lavatory System Industry Revenue (Million), by Consumption Analysis 2025 & 2033
- Figure 53: Middle East and Africa Commercial Aircraft Lavatory System Industry Revenue Share (%), by Consumption Analysis 2025 & 2033
- Figure 54: Middle East and Africa Commercial Aircraft Lavatory System Industry Revenue (Million), by Import Market Analysis (Value & Volume) 2025 & 2033
- Figure 55: Middle East and Africa Commercial Aircraft Lavatory System Industry Revenue Share (%), by Import Market Analysis (Value & Volume) 2025 & 2033
- Figure 56: Middle East and Africa Commercial Aircraft Lavatory System Industry Revenue (Million), by Export Market Analysis (Value & Volume) 2025 & 2033
- Figure 57: Middle East and Africa Commercial Aircraft Lavatory System Industry Revenue Share (%), by Export Market Analysis (Value & Volume) 2025 & 2033
- Figure 58: Middle East and Africa Commercial Aircraft Lavatory System Industry Revenue (Million), by Price Trend Analysis 2025 & 2033
- Figure 59: Middle East and Africa Commercial Aircraft Lavatory System Industry Revenue Share (%), by Price Trend Analysis 2025 & 2033
- Figure 60: Middle East and Africa Commercial Aircraft Lavatory System Industry Revenue (Million), by Country 2025 & 2033
- Figure 61: Middle East and Africa Commercial Aircraft Lavatory System Industry Revenue Share (%), by Country 2025 & 2033
List of Tables
- Table 1: Global Commercial Aircraft Lavatory System Industry Revenue Million Forecast, by Production Analysis 2020 & 2033
- Table 2: Global Commercial Aircraft Lavatory System Industry Revenue Million Forecast, by Consumption Analysis 2020 & 2033
- Table 3: Global Commercial Aircraft Lavatory System Industry Revenue Million Forecast, by Import Market Analysis (Value & Volume) 2020 & 2033
- Table 4: Global Commercial Aircraft Lavatory System Industry Revenue Million Forecast, by Export Market Analysis (Value & Volume) 2020 & 2033
- Table 5: Global Commercial Aircraft Lavatory System Industry Revenue Million Forecast, by Price Trend Analysis 2020 & 2033
- Table 6: Global Commercial Aircraft Lavatory System Industry Revenue Million Forecast, by Region 2020 & 2033
- Table 7: Global Commercial Aircraft Lavatory System Industry Revenue Million Forecast, by Production Analysis 2020 & 2033
- Table 8: Global Commercial Aircraft Lavatory System Industry Revenue Million Forecast, by Consumption Analysis 2020 & 2033
- Table 9: Global Commercial Aircraft Lavatory System Industry Revenue Million Forecast, by Import Market Analysis (Value & Volume) 2020 & 2033
- Table 10: Global Commercial Aircraft Lavatory System Industry Revenue Million Forecast, by Export Market Analysis (Value & Volume) 2020 & 2033
- Table 11: Global Commercial Aircraft Lavatory System Industry Revenue Million Forecast, by Price Trend Analysis 2020 & 2033
- Table 12: Global Commercial Aircraft Lavatory System Industry Revenue Million Forecast, by Country 2020 & 2033
- Table 13: United States Commercial Aircraft Lavatory System Industry Revenue (Million) Forecast, by Application 2020 & 2033
- Table 14: Canada Commercial Aircraft Lavatory System Industry Revenue (Million) Forecast, by Application 2020 & 2033
- Table 15: Global Commercial Aircraft Lavatory System Industry Revenue Million Forecast, by Production Analysis 2020 & 2033
- Table 16: Global Commercial Aircraft Lavatory System Industry Revenue Million Forecast, by Consumption Analysis 2020 & 2033
- Table 17: Global Commercial Aircraft Lavatory System Industry Revenue Million Forecast, by Import Market Analysis (Value & Volume) 2020 & 2033
- Table 18: Global Commercial Aircraft Lavatory System Industry Revenue Million Forecast, by Export Market Analysis (Value & Volume) 2020 & 2033
- Table 19: Global Commercial Aircraft Lavatory System Industry Revenue Million Forecast, by Price Trend Analysis 2020 & 2033
- Table 20: Global Commercial Aircraft Lavatory System Industry Revenue Million Forecast, by Country 2020 & 2033
- Table 21: United Kingdom Commercial Aircraft Lavatory System Industry Revenue (Million) Forecast, by Application 2020 & 2033
- Table 22: Germany Commercial Aircraft Lavatory System Industry Revenue (Million) Forecast, by Application 2020 & 2033
- Table 23: France Commercial Aircraft Lavatory System Industry Revenue (Million) Forecast, by Application 2020 & 2033
- Table 24: Italy Commercial Aircraft Lavatory System Industry Revenue (Million) Forecast, by Application 2020 & 2033
- Table 25: Russia Commercial Aircraft Lavatory System Industry Revenue (Million) Forecast, by Application 2020 & 2033
- Table 26: Rest of Europe Commercial Aircraft Lavatory System Industry Revenue (Million) Forecast, by Application 2020 & 2033
- Table 27: Global Commercial Aircraft Lavatory System Industry Revenue Million Forecast, by Production Analysis 2020 & 2033
- Table 28: Global Commercial Aircraft Lavatory System Industry Revenue Million Forecast, by Consumption Analysis 2020 & 2033
- Table 29: Global Commercial Aircraft Lavatory System Industry Revenue Million Forecast, by Import Market Analysis (Value & Volume) 2020 & 2033
- Table 30: Global Commercial Aircraft Lavatory System Industry Revenue Million Forecast, by Export Market Analysis (Value & Volume) 2020 & 2033
- Table 31: Global Commercial Aircraft Lavatory System Industry Revenue Million Forecast, by Price Trend Analysis 2020 & 2033
- Table 32: Global Commercial Aircraft Lavatory System Industry Revenue Million Forecast, by Country 2020 & 2033
- Table 33: China Commercial Aircraft Lavatory System Industry Revenue (Million) Forecast, by Application 2020 & 2033
- Table 34: India Commercial Aircraft Lavatory System Industry Revenue (Million) Forecast, by Application 2020 & 2033
- Table 35: Japan Commercial Aircraft Lavatory System Industry Revenue (Million) Forecast, by Application 2020 & 2033
- Table 36: South Korea Commercial Aircraft Lavatory System Industry Revenue (Million) Forecast, by Application 2020 & 2033
- Table 37: Rest of Asia Pacific Commercial Aircraft Lavatory System Industry Revenue (Million) Forecast, by Application 2020 & 2033
- Table 38: Global Commercial Aircraft Lavatory System Industry Revenue Million Forecast, by Production Analysis 2020 & 2033
- Table 39: Global Commercial Aircraft Lavatory System Industry Revenue Million Forecast, by Consumption Analysis 2020 & 2033
- Table 40: Global Commercial Aircraft Lavatory System Industry Revenue Million Forecast, by Import Market Analysis (Value & Volume) 2020 & 2033
- Table 41: Global Commercial Aircraft Lavatory System Industry Revenue Million Forecast, by Export Market Analysis (Value & Volume) 2020 & 2033
- Table 42: Global Commercial Aircraft Lavatory System Industry Revenue Million Forecast, by Price Trend Analysis 2020 & 2033
- Table 43: Global Commercial Aircraft Lavatory System Industry Revenue Million Forecast, by Country 2020 & 2033
- Table 44: Brazil Commercial Aircraft Lavatory System Industry Revenue (Million) Forecast, by Application 2020 & 2033
- Table 45: Mexico Commercial Aircraft Lavatory System Industry Revenue (Million) Forecast, by Application 2020 & 2033
- Table 46: Rest of Latin America Commercial Aircraft Lavatory System Industry Revenue (Million) Forecast, by Application 2020 & 2033
- Table 47: Global Commercial Aircraft Lavatory System Industry Revenue Million Forecast, by Production Analysis 2020 & 2033
- Table 48: Global Commercial Aircraft Lavatory System Industry Revenue Million Forecast, by Consumption Analysis 2020 & 2033
- Table 49: Global Commercial Aircraft Lavatory System Industry Revenue Million Forecast, by Import Market Analysis (Value & Volume) 2020 & 2033
- Table 50: Global Commercial Aircraft Lavatory System Industry Revenue Million Forecast, by Export Market Analysis (Value & Volume) 2020 & 2033
- Table 51: Global Commercial Aircraft Lavatory System Industry Revenue Million Forecast, by Price Trend Analysis 2020 & 2033
- Table 52: Global Commercial Aircraft Lavatory System Industry Revenue Million Forecast, by Country 2020 & 2033
- Table 53: United Arab Emirates Commercial Aircraft Lavatory System Industry Revenue (Million) Forecast, by Application 2020 & 2033
- Table 54: Saudi Arabia Commercial Aircraft Lavatory System Industry Revenue (Million) Forecast, by Application 2020 & 2033
- Table 55: Qatar Commercial Aircraft Lavatory System Industry Revenue (Million) Forecast, by Application 2020 & 2033
- Table 56: South Africa Commercial Aircraft Lavatory System Industry Revenue (Million) Forecast, by Application 2020 & 2033
- Table 57: Rest of Middle East and Africa Commercial Aircraft Lavatory System Industry Revenue (Million) Forecast, by Application 2020 & 2033
Frequently Asked Questions
1. What is the projected Compound Annual Growth Rate (CAGR) of the Commercial Aircraft Lavatory System Industry?
The projected CAGR is approximately 6.22%.
2. Which companies are prominent players in the Commercial Aircraft Lavatory System Industry?
Key companies in the market include Safran, Collins Aerospace (RTX Corporation), Geven SPA, JAMCO Corporation, Diehl Stiftung & Co KG, The NORDAM Group LLC, Yokohama Aerospace America Inc, Satys, Hong Kong Aircraft Engineering Company Limited, CIRCOR Aerospac.
3. What are the main segments of the Commercial Aircraft Lavatory System Industry?
The market segments include Production Analysis, Consumption Analysis, Import Market Analysis (Value & Volume), Export Market Analysis (Value & Volume), Price Trend Analysis.
4. Can you provide details about the market size?
The market size is estimated to be USD 430.62 Million as of 2022.
5. What are some drivers contributing to market growth?
N/A
6. What are the notable trends driving market growth?
Wide-body Segment is Dominate Market Share During the Forecast Period.
7. Are there any restraints impacting market growth?
N/A
8. Can you provide examples of recent developments in the market?
N/A
9. What pricing options are available for accessing the report?
Pricing options include single-user, multi-user, and enterprise licenses priced at USD 4750, USD 5250, and USD 8750 respectively.
10. Is the market size provided in terms of value or volume?
The market size is provided in terms of value, measured in Million.
11. Are there any specific market keywords associated with the report?
Yes, the market keyword associated with the report is "Commercial Aircraft Lavatory System Industry," which aids in identifying and referencing the specific market segment covered.
12. How do I determine which pricing option suits my needs best?
The pricing options vary based on user requirements and access needs. Individual users may opt for single-user licenses, while businesses requiring broader access may choose multi-user or enterprise licenses for cost-effective access to the report.
13. Are there any additional resources or data provided in the Commercial Aircraft Lavatory System Industry report?
While the report offers comprehensive insights, it's advisable to review the specific contents or supplementary materials provided to ascertain if additional resources or data are available.
14. How can I stay updated on further developments or reports in the Commercial Aircraft Lavatory System Industry?
To stay informed about further developments, trends, and reports in the Commercial Aircraft Lavatory System Industry, consider subscribing to industry newsletters, following relevant companies and organizations, or regularly checking reputable industry news sources and publications.
Methodology
Step 1 - Identification of Relevant Samples Size from Population Database


Step 2 - Approaches for Defining Global Market Size (Value, Volume* & Price*)

Note*: In applicable scenarios
Step 3 - Data Sources
Primary Research
- Web Analytics
- Survey Reports
- Research Institute
- Latest Research Reports
- Opinion Leaders
Secondary Research
- Annual Reports
- White Paper
- Latest Press Release
- Industry Association
- Paid Database
- Investor Presentations

Step 4 - Data Triangulation
Involves using different sources of information in order to increase the validity of a study
These sources are likely to be stakeholders in a program - participants, other researchers, program staff, other community members, and so on.
Then we put all data in single framework & apply various statistical tools to find out the dynamic on the market.
During the analysis stage, feedback from the stakeholder groups would be compared to determine areas of agreement as well as areas of divergence