


Key Insights
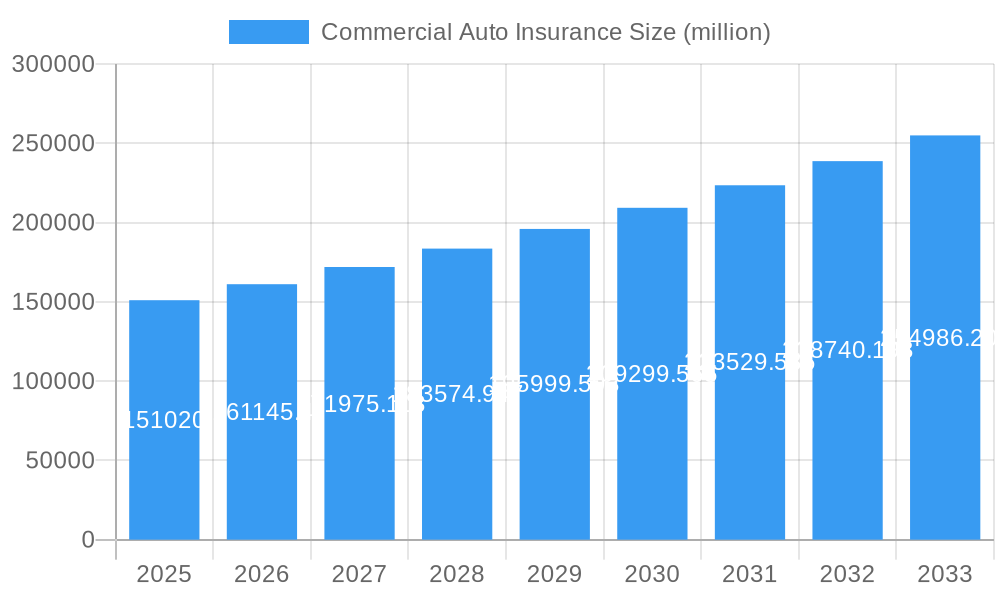
The global commercial auto insurance market is projected for robust expansion, currently valued at an estimated $151.02 billion in 2025 and anticipated to grow at a compound annual growth rate (CAGR) of 6.5% through 2033. This significant growth is propelled by a dynamic interplay of factors, including the escalating volume of commercial vehicle fleets on roads worldwide and the increasing complexity of regulatory landscapes that necessitate comprehensive insurance coverage. Furthermore, advancements in telematics and connected vehicle technologies are playing a crucial role, enabling insurers to offer more personalized risk assessments and tailored policies, thereby driving demand. The burgeoning e-commerce sector, with its reliance on efficient logistics and delivery services, further fuels the need for commercial auto insurance, as does the general expansion of business activities requiring transportation of goods and services. These underlying economic and technological shifts create a fertile ground for sustained market development, making commercial auto insurance a critical component of business risk management.
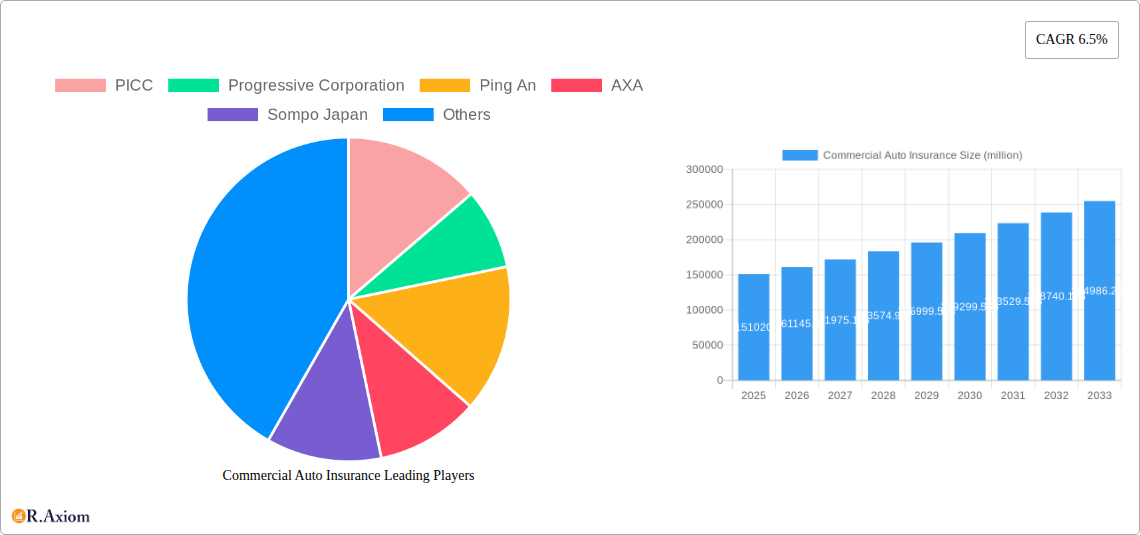
Commercial Auto Insurance Market Size (In Billion)

The market is segmented across key applications, with passenger cars and commercial vehicles representing the primary segments, each with distinct risk profiles and insurance needs. Within the types of insurance, liability and physical damage coverage are fundamental, with a growing emphasis on broader protection and ancillary services. Leading global players such as PICC, Progressive Corporation, Ping An, AXA, and Sompo Japan are actively shaping the competitive landscape through strategic mergers, acquisitions, and innovative product development. Their focus on digital transformation, customer experience enhancement, and the integration of AI for underwriting and claims processing are key trends defining the industry. While the market benefits from strong growth drivers, it also faces certain restraints, including increasing claim frequencies due to distracted driving and adverse weather conditions, as well as the persistent challenge of fraud. Insurers are actively addressing these by leveraging data analytics and technological solutions to mitigate risks and improve profitability, ensuring the continued resilience and evolution of the commercial auto insurance sector.
Commercial Auto Insurance Company Market Share
This comprehensive report delves into the global Commercial Auto Insurance market, offering a detailed analysis from 2019 to 2033, with a base and estimated year of 2025 and a forecast period from 2025 to 2033. Covering historical data from 2019-2024, this report is an indispensable resource for understanding market dynamics, strategic planning, and investment decisions within the commercial vehicle insurance sector. We analyze critical segments including Passenger Car and Commercial Vehicle applications, and Liability Insurance, Physical Damage Insurance, and Other policy types. Industry developments are meticulously examined to provide forward-looking insights.
Commercial Auto Insurance Market Concentration & Innovation
The commercial auto insurance market exhibits a moderate to high concentration, with leading players accounting for a substantial portion of the global market share. In 2025, the combined market share of the top five companies is projected to be over $500 million, underscoring the competitive landscape. Innovation is a key differentiator, driven by the increasing adoption of telematics, AI-powered risk assessment, and usage-based insurance (UBI) models. Regulatory frameworks, such as stringent safety standards and data privacy laws, also significantly influence market strategies and product development. While product substitutes like self-insurance and captive risk management exist, the inherent risks associated with commercial vehicle operations continue to favor traditional insurance solutions. End-user trends point towards a demand for more personalized coverage, flexible policy options, and efficient claims processing. Mergers and acquisitions (M&A) activity is ongoing, with notable transactions in the historical period valued at over $50 million, aiming to enhance market reach and technological capabilities.
Commercial Auto Insurance Industry Trends & Insights
The commercial auto insurance industry is poised for robust growth, driven by several pivotal trends. The projected Compound Annual Growth Rate (CAGR) from 2025 to 2033 is estimated at 6.5%, indicating sustained expansion. Market penetration for commercial auto insurance is expected to rise, especially in emerging economies due to increasing vehicle fleets and evolving business landscapes. Technological advancements are revolutionizing the sector. Telematics and IoT devices are enabling real-time risk monitoring, accident reconstruction, and proactive safety interventions, leading to reduced claims and improved underwriting accuracy. The rise of autonomous and semi-autonomous vehicles presents both opportunities and challenges, necessitating new insurance models and risk assessment methodologies. Consumer preferences are shifting towards digital-first interactions, demanding seamless online policy management, instant quotes, and expedited claims settlement. Insurers are responding by investing heavily in digital transformation and customer experience enhancement. The competitive dynamics are intensifying, with established players leveraging their scale and data analytics while InsurTech startups are disrupting traditional models with innovative solutions. The increasing cost of vehicle repairs, coupled with rising medical expenses for accident victims, contributes to upward pressure on premiums, necessitating efficient cost management and pricing strategies.
Dominant Markets & Segments in Commercial Auto Insurance
The global commercial auto insurance market's dominance varies across regions and segments. North America currently holds the largest market share, driven by a mature insurance market, extensive transportation networks, and stringent regulatory requirements. Within North America, the United States remains the leading country, with a market size projected to exceed $200 million in 2025.
Application: Passenger Car
- Key Drivers: The increasing use of passenger cars for commercial purposes, such as ride-sharing services and delivery operations, significantly contributes to this segment's growth. Economic policies that support small businesses and the gig economy further bolster demand.
- Dominance Analysis: This segment is characterized by a high volume of policies, but often with lower individual policy values compared to heavy commercial vehicles. Insurers are focusing on developing specialized products and pricing models to cater to the unique risks associated with passenger car fleets, including driver behavior and mileage-based assessments.
Application: Commercial Vehicle
- Key Drivers: The backbone of logistics and supply chains, commercial vehicles (trucks, vans, buses) represent a substantial and growing segment. Economic growth, e-commerce expansion, and infrastructure development projects are major catalysts. Stricter emissions regulations also drive demand for newer, more technologically advanced commercial vehicles, which often come with higher insurance costs.
- Dominance Analysis: This segment commands higher premium values due to the significant financial stakes involved in commercial vehicle operations. The risk profile is influenced by factors like vehicle type, cargo carried, route complexity, and driver experience. Insurers are innovating with fleet management solutions and specialized coverage for high-value commercial fleets.
Type: Liability Insurance
- Key Drivers: Mandated by law in most jurisdictions, liability insurance is a fundamental component of commercial auto policies. Its growth is directly linked to the number of registered commercial vehicles and the increasing value of potential third-party damages. Economic policies that promote business activity necessitate robust liability coverage.
- Dominance Analysis: Liability insurance consistently represents the largest segment in terms of market share. It covers damages to third parties for bodily injury or property damage. The increasing frequency and severity of accidents, coupled with rising legal awards, contribute to the sustained demand and premium growth in this area.
Type: Physical Damage Insurance
- Key Drivers: Protecting the insured vehicle from collision, theft, fire, and other damages, physical damage insurance is crucial for businesses to mitigate financial losses. Economic stability and the value of commercial vehicle fleets directly influence the demand for this coverage. Advancements in vehicle safety technology, while reducing accident severity, can also lead to higher repair costs, impacting premium calculations.
- Dominance Analysis: This segment is the second-largest by market share. It includes comprehensive and collision coverage. The increasing sophistication and cost of commercial vehicles, particularly those equipped with advanced driver-assistance systems (ADAS) and alternative powertrains, are driving up the cost of physical damage insurance.
Type: Others
- Key Drivers: This category encompasses a range of specialized coverages, including uninsured/underinsured motorist, medical payments, towing and labor, and cargo insurance. Growth in this segment is often tied to specific industry needs and evolving risk landscapes, such as the increased demand for cargo insurance due to rising e-commerce volumes.
- Dominance Analysis: While smaller than liability and physical damage insurance, the "others" segment is experiencing growth as businesses seek more tailored and comprehensive risk management solutions. The rising value of goods transported and the increasing complexity of delivery operations are fueling demand for specialized add-ons.
Commercial Auto Insurance Product Developments
Product development in commercial auto insurance is rapidly evolving, driven by technological integration and a desire for tailored solutions. Telematics-driven usage-based insurance (UBI) is a prominent innovation, allowing premiums to be adjusted based on actual driving behavior, mileage, and safety metrics, thereby rewarding safer fleets. Cyber insurance is increasingly being bundled or offered as an add-on to cover risks associated with connected vehicles and digital fleet management systems. Parametric insurance, triggered by predefined events like natural disasters impacting vehicle operations, is emerging as an alternative for specific risk mitigation. These developments offer competitive advantages by enhancing customer retention, attracting new segments, and providing more accurate risk pricing. The focus is on creating agile, data-informed products that meet the dynamic needs of modern commercial enterprises.
Report Scope & Segmentation Analysis
This report provides an exhaustive analysis of the global commercial auto insurance market. The segmentation covers:
Application: Passenger Car
This segment is projected to grow at a CAGR of 5.8% from 2025-2033, reaching an estimated market size of $50 million by 2033. It is driven by the expanding gig economy and the increasing utilization of passenger vehicles for commercial deliveries and services. Competitive dynamics are characterized by a focus on micro-segmentation and flexible pricing models.
Application: Commercial Vehicle
Projected to experience a CAGR of 7.1% from 2025-2033, this segment is estimated to reach $450 million by 2033. Its growth is intrinsically linked to global trade, e-commerce, and industrial output. The competitive landscape is dominated by large, established insurers offering comprehensive fleet management solutions.
Type: Liability Insurance
Expected to grow at a CAGR of 6.3% from 2025-2033, this segment is forecast to reach $250 million by 2033. It is a foundational coverage, driven by regulatory mandates and the inherent risks of vehicle operation. Competitive advantages lie in underwriting expertise and claims handling efficiency.
Type: Physical Damage Insurance
With a projected CAGR of 6.7% from 2025-2033, this segment is estimated to reach $230 million by 2033. It is influenced by the increasing value of commercial fleets and the cost of vehicle repairs. Innovations in ADAS and alternative powertrains are shaping its future competitive dynamics.
Type: Others
This segment, encompassing specialized coverages, is anticipated to grow at a CAGR of 7.5% from 2025-2033, reaching an estimated $20 million by 2033. Its growth is fueled by emerging risks and the demand for bespoke insurance solutions, offering opportunities for niche market players.
Key Drivers of Commercial Auto Insurance Growth
Several factors are propelling the growth of the commercial auto insurance market. Technological Advancements such as telematics and AI are enhancing risk assessment and fraud detection, leading to more accurate pricing and reduced losses. Economic Growth globally, particularly in emerging markets, results in increased commercial vehicle fleets and higher demand for insurance. Evolving Regulatory Landscapes, including stricter safety standards and environmental regulations, mandate comprehensive coverage and incentivize adoption of safer vehicles, indirectly boosting insurance demand. The proliferation of the Gig Economy and e-commerce fuels the use of passenger cars and light commercial vehicles for business purposes, creating new customer segments. Finally, the increasing Complexity of Supply Chains necessitates robust cargo and liability coverage, further driving market expansion.
Challenges in the Commercial Auto Insurance Sector
The commercial auto insurance sector faces several significant challenges that can impede growth. Rising Claims Costs, driven by inflation in vehicle repair parts, labor, and medical expenses, put pressure on profitability. Intensifying Competition from traditional insurers and InsurTech startups leads to price wars and a need for continuous innovation. Regulatory Hurdles, including varying compliance requirements across different jurisdictions and evolving data privacy laws, can complicate market entry and product design. Supply Chain Disruptions, impacting the availability of vehicle parts, can lead to prolonged repair times and increased claims payouts. Furthermore, Talent Shortages in specialized underwriting and claims handling roles can affect service quality and operational efficiency.
Emerging Opportunities in Commercial Auto Insurance
Despite challenges, significant opportunities exist in the commercial auto insurance market. The Expansion of Electric Vehicles (EVs) presents a new frontier for specialized insurance products, considering their unique maintenance and repair requirements. The burgeoning Autonomous Vehicle (AV) Market, while long-term, will necessitate entirely new insurance frameworks and risk models. Data Analytics and AI offer immense potential for hyper-personalization of policies, proactive risk management, and improved customer experience. The Growth of Emerging Markets, with increasing industrialization and logistics needs, provides fertile ground for market expansion. Finally, the development of Usage-Based Insurance (UBI) and Pay-As-You-Drive (PAYD) models caters to the demand for flexible and cost-effective coverage, particularly for small and medium-sized enterprises.
Leading Players in the Commercial Auto Insurance Market
- PICC
- Progressive Corporation
- Ping An
- AXA
- Sompo Japan
- Tokyo Marine
- Travelers Group
- Liberty Mutual Group
- Zurich
- CPIC
- Nationwide
- Mitsui Sumitomo Insurance
- Aviva
- Berkshire Hathaway
- Old Republic International
- Auto Owners Grp.
- Generali Group
- MAPFRE
- Chubb
- AmTrust NGH
Key Developments in Commercial Auto Insurance Industry
- 2023 Q4: Progressive Corporation launches a new telematics program for commercial fleets, offering real-time driver behavior insights and potential premium discounts.
- 2024 Q1: AXA announces an investment of $25 million in InsurTech startup specializing in AI-driven claims processing for commercial auto.
- 2024 Q2: Travelers Group expands its usage-based insurance offerings for medium-sized commercial vehicles, focusing on accident prevention.
- 2024 Q3: Liberty Mutual Group acquires a specialist commercial auto broker, enhancing its distribution network and customer reach.
- 2024 Q4: Zurich partners with a leading autonomous vehicle technology developer to explore future insurance solutions for AVs.
- 2025 Q1 (Projected): Sompo Japan plans to introduce a new policy covering cyber risks associated with connected commercial vehicles.
- 2025 Q2 (Projected): Nationwide rolls out enhanced telematics data analytics for its commercial auto policyholders to improve safety scores.
- 2025 Q3 (Projected): Ping An explores a pilot program for parametric insurance triggered by severe weather events affecting commercial vehicle operations in specific regions.
- 2025 Q4 (Projected): Mitsui Sumitomo Insurance focuses on developing specialized coverage for electric commercial vehicle fleets.
- 2026 Q1 (Projected): Berkshire Hathaway's commercial insurance arm explores strategic partnerships to leverage advanced data analytics for underwriting.
- 2026 Q2 (Projected): Old Republic International enhances its digital platform for commercial auto policy management and claims submission.
- 2026 Q3 (Projected): Auto Owners Group explores offerings for the growing last-mile delivery segment.
- 2026 Q4 (Projected): Generali Group invests in a new risk assessment tool for commercial trucking operations.
- 2027 Q1 (Projected): MAPFRE expands its commercial auto product line to include more customizable options for small businesses.
- 2027 Q2 (Projected): Chubb enhances its fraud detection capabilities through AI integration in commercial auto claims processing.
- 2027 Q3 (Projected): AmTrust NGH focuses on expanding its reach in the independent contractor commercial auto segment.
- 2027 Q4 (Projected): Aviva continues to refine its telematics offerings, focusing on driver behavior modification programs.
- 2028 (Projected): Significant regulatory shifts are anticipated in data utilization for commercial auto insurance across major markets.
- 2029 (Projected): Early adoption of advanced ADAS technologies in commercial fleets leads to a noticeable reduction in accident severity.
- 2030 (Projected): The market begins to see initial insurance products tailored for Level 4 autonomous commercial vehicles.
Strategic Outlook for Commercial Auto Insurance Market
The strategic outlook for the commercial auto insurance market is one of sustained growth and transformation. Insurers that successfully embrace digital technologies, leverage advanced data analytics for personalized risk assessment, and develop innovative products for emerging segments like electric and autonomous vehicles will gain a significant competitive edge. The focus will shift from traditional reactive claims handling to proactive risk management, emphasizing driver safety and operational efficiency. Strategic partnerships with telematics providers, fleet management companies, and technology developers will be crucial for staying ahead of the curve. The market's future hinges on adaptability, customer-centricity, and a proactive approach to navigating evolving risks and opportunities in the dynamic commercial transportation landscape.
Commercial Auto Insurance Segmentation
-
1. Application
- 1.1. Passenger Car
- 1.2. Commercial Vehicle
-
2. Types
- 2.1. Liability Insurance
- 2.2. Physical Damage Insurance
- 2.3. Others
Commercial Auto Insurance Segmentation By Geography
-
1. North America
- 1.1. United States
- 1.2. Canada
- 1.3. Mexico
-
2. South America
- 2.1. Brazil
- 2.2. Argentina
- 2.3. Rest of South America
-
3. Europe
- 3.1. United Kingdom
- 3.2. Germany
- 3.3. France
- 3.4. Italy
- 3.5. Spain
- 3.6. Russia
- 3.7. Benelux
- 3.8. Nordics
- 3.9. Rest of Europe
-
4. Middle East & Africa
- 4.1. Turkey
- 4.2. Israel
- 4.3. GCC
- 4.4. North Africa
- 4.5. South Africa
- 4.6. Rest of Middle East & Africa
-
5. Asia Pacific
- 5.1. China
- 5.2. India
- 5.3. Japan
- 5.4. South Korea
- 5.5. ASEAN
- 5.6. Oceania
- 5.7. Rest of Asia Pacific
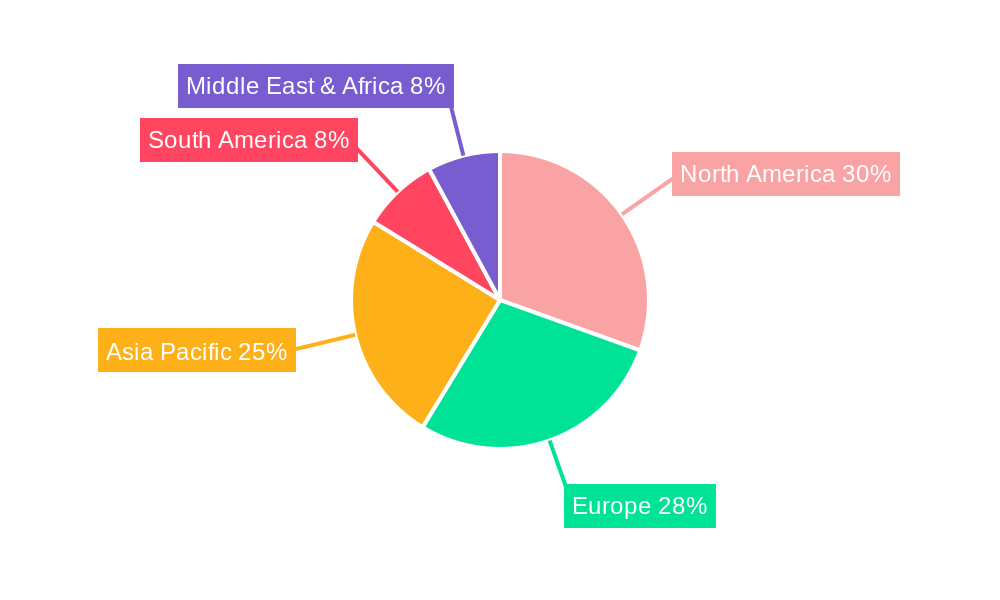
Commercial Auto Insurance Regional Market Share
Geographic Coverage of Commercial Auto Insurance
Commercial Auto Insurance REPORT HIGHLIGHTS
| Aspects | Details |
|---|---|
| Study Period | 2020-2034 |
| Base Year | 2025 |
| Estimated Year | 2026 |
| Forecast Period | 2026-2034 |
| Historical Period | 2020-2025 |
| Growth Rate | CAGR of 6.5% from 2020-2034 |
| Segmentation |
|
Table of Contents
- 1. Introduction
- 1.1. Research Scope
- 1.2. Market Segmentation
- 1.3. Research Objective
- 1.4. Definitions and Assumptions
- 2. Executive Summary
- 2.1. Market Snapshot
- 3. Market Dynamics
- 3.1. Market Drivers
- 3.2. Market Restrains
- 3.3. Market Trends
- 3.4. Market Opportunities
- 4. Market Factor Analysis
- 4.1. Porters Five Forces
- 4.1.1. Bargaining Power of Suppliers
- 4.1.2. Bargaining Power of Buyers
- 4.1.3. Threat of New Entrants
- 4.1.4. Threat of Substitutes
- 4.1.5. Competitive Rivalry
- 4.2. PESTEL analysis
- 4.3. BCG Analysis
- 4.3.1. Stars (High Growth, High Market Share)
- 4.3.2. Cash Cows (Low Growth, High Market Share)
- 4.3.3. Question Mark (High Growth, Low Market Share)
- 4.3.4. Dogs (Low Growth, Low Market Share)
- 4.4. Ansoff Matrix Analysis
- 4.5. Supply Chain Analysis
- 4.6. Regulatory Landscape
- 4.7. Current Market Potential and Opportunity Assessment (TAM–SAM–SOM Framework)
- 4.8. RAX Analyst Note
- 4.1. Porters Five Forces
- 5. Market Analysis, Insights and Forecast 2021-2033
- 5.1. Market Analysis, Insights and Forecast - by Application
- 5.1.1. Passenger Car
- 5.1.2. Commercial Vehicle
- 5.2. Market Analysis, Insights and Forecast - by Types
- 5.2.1. Liability Insurance
- 5.2.2. Physical Damage Insurance
- 5.2.3. Others
- 5.3. Market Analysis, Insights and Forecast - by Region
- 5.3.1. North America
- 5.3.2. South America
- 5.3.3. Europe
- 5.3.4. Middle East & Africa
- 5.3.5. Asia Pacific
- 5.1. Market Analysis, Insights and Forecast - by Application
- 6. Global Commercial Auto Insurance Analysis, Insights and Forecast, 2021-2033
- 6.1. Market Analysis, Insights and Forecast - by Application
- 6.1.1. Passenger Car
- 6.1.2. Commercial Vehicle
- 6.2. Market Analysis, Insights and Forecast - by Types
- 6.2.1. Liability Insurance
- 6.2.2. Physical Damage Insurance
- 6.2.3. Others
- 6.1. Market Analysis, Insights and Forecast - by Application
- 7. North America Commercial Auto Insurance Analysis, Insights and Forecast, 2020-2032
- 7.1. Market Analysis, Insights and Forecast - by Application
- 7.1.1. Passenger Car
- 7.1.2. Commercial Vehicle
- 7.2. Market Analysis, Insights and Forecast - by Types
- 7.2.1. Liability Insurance
- 7.2.2. Physical Damage Insurance
- 7.2.3. Others
- 7.1. Market Analysis, Insights and Forecast - by Application
- 8. South America Commercial Auto Insurance Analysis, Insights and Forecast, 2020-2032
- 8.1. Market Analysis, Insights and Forecast - by Application
- 8.1.1. Passenger Car
- 8.1.2. Commercial Vehicle
- 8.2. Market Analysis, Insights and Forecast - by Types
- 8.2.1. Liability Insurance
- 8.2.2. Physical Damage Insurance
- 8.2.3. Others
- 8.1. Market Analysis, Insights and Forecast - by Application
- 9. Europe Commercial Auto Insurance Analysis, Insights and Forecast, 2020-2032
- 9.1. Market Analysis, Insights and Forecast - by Application
- 9.1.1. Passenger Car
- 9.1.2. Commercial Vehicle
- 9.2. Market Analysis, Insights and Forecast - by Types
- 9.2.1. Liability Insurance
- 9.2.2. Physical Damage Insurance
- 9.2.3. Others
- 9.1. Market Analysis, Insights and Forecast - by Application
- 10. Middle East & Africa Commercial Auto Insurance Analysis, Insights and Forecast, 2020-2032
- 10.1. Market Analysis, Insights and Forecast - by Application
- 10.1.1. Passenger Car
- 10.1.2. Commercial Vehicle
- 10.2. Market Analysis, Insights and Forecast - by Types
- 10.2.1. Liability Insurance
- 10.2.2. Physical Damage Insurance
- 10.2.3. Others
- 10.1. Market Analysis, Insights and Forecast - by Application
- 11. Asia Pacific Commercial Auto Insurance Analysis, Insights and Forecast, 2020-2032
- 11.1. Market Analysis, Insights and Forecast - by Application
- 11.1.1. Passenger Car
- 11.1.2. Commercial Vehicle
- 11.2. Market Analysis, Insights and Forecast - by Types
- 11.2.1. Liability Insurance
- 11.2.2. Physical Damage Insurance
- 11.2.3. Others
- 11.1. Market Analysis, Insights and Forecast - by Application
- 12. Competitive Analysis
- 12.1. Company Profiles
- 12.1.1 PICC
- 12.1.1.1. Company Overview
- 12.1.1.2. Products
- 12.1.1.3. Company Financials
- 12.1.1.4. SWOT Analysis
- 12.1.2 Progressive Corporation
- 12.1.2.1. Company Overview
- 12.1.2.2. Products
- 12.1.2.3. Company Financials
- 12.1.2.4. SWOT Analysis
- 12.1.3 Ping An
- 12.1.3.1. Company Overview
- 12.1.3.2. Products
- 12.1.3.3. Company Financials
- 12.1.3.4. SWOT Analysis
- 12.1.4 AXA
- 12.1.4.1. Company Overview
- 12.1.4.2. Products
- 12.1.4.3. Company Financials
- 12.1.4.4. SWOT Analysis
- 12.1.5 Sompo Japan
- 12.1.5.1. Company Overview
- 12.1.5.2. Products
- 12.1.5.3. Company Financials
- 12.1.5.4. SWOT Analysis
- 12.1.6 Tokyo Marine
- 12.1.6.1. Company Overview
- 12.1.6.2. Products
- 12.1.6.3. Company Financials
- 12.1.6.4. SWOT Analysis
- 12.1.7 Travelers Group
- 12.1.7.1. Company Overview
- 12.1.7.2. Products
- 12.1.7.3. Company Financials
- 12.1.7.4. SWOT Analysis
- 12.1.8 Liberty Mutual Group
- 12.1.8.1. Company Overview
- 12.1.8.2. Products
- 12.1.8.3. Company Financials
- 12.1.8.4. SWOT Analysis
- 12.1.9 Zurich
- 12.1.9.1. Company Overview
- 12.1.9.2. Products
- 12.1.9.3. Company Financials
- 12.1.9.4. SWOT Analysis
- 12.1.10 CPIC
- 12.1.10.1. Company Overview
- 12.1.10.2. Products
- 12.1.10.3. Company Financials
- 12.1.10.4. SWOT Analysis
- 12.1.11 Nationwide
- 12.1.11.1. Company Overview
- 12.1.11.2. Products
- 12.1.11.3. Company Financials
- 12.1.11.4. SWOT Analysis
- 12.1.12 Mitsui Sumitomo Insurance
- 12.1.12.1. Company Overview
- 12.1.12.2. Products
- 12.1.12.3. Company Financials
- 12.1.12.4. SWOT Analysis
- 12.1.13 Aviva
- 12.1.13.1. Company Overview
- 12.1.13.2. Products
- 12.1.13.3. Company Financials
- 12.1.13.4. SWOT Analysis
- 12.1.14 Berkshire Hathaway
- 12.1.14.1. Company Overview
- 12.1.14.2. Products
- 12.1.14.3. Company Financials
- 12.1.14.4. SWOT Analysis
- 12.1.15 Old Republic International
- 12.1.15.1. Company Overview
- 12.1.15.2. Products
- 12.1.15.3. Company Financials
- 12.1.15.4. SWOT Analysis
- 12.1.16 Auto Owners Grp.
- 12.1.16.1. Company Overview
- 12.1.16.2. Products
- 12.1.16.3. Company Financials
- 12.1.16.4. SWOT Analysis
- 12.1.17 Generali Group
- 12.1.17.1. Company Overview
- 12.1.17.2. Products
- 12.1.17.3. Company Financials
- 12.1.17.4. SWOT Analysis
- 12.1.18 MAPFRE
- 12.1.18.1. Company Overview
- 12.1.18.2. Products
- 12.1.18.3. Company Financials
- 12.1.18.4. SWOT Analysis
- 12.1.19 Chubb
- 12.1.19.1. Company Overview
- 12.1.19.2. Products
- 12.1.19.3. Company Financials
- 12.1.19.4. SWOT Analysis
- 12.1.20 AmTrust NGH
- 12.1.20.1. Company Overview
- 12.1.20.2. Products
- 12.1.20.3. Company Financials
- 12.1.20.4. SWOT Analysis
- 12.1.1 PICC
- 12.2. Market Entropy
- 12.2.1 Company's Key Areas Served
- 12.2.2 Recent Developments
- 12.3. Company Market Share Analysis 2025
- 12.3.1 Top 5 Companies Market Share Analysis
- 12.3.2 Top 3 Companies Market Share Analysis
- 12.4. List of Potential Customers
- 13. Research Methodology
List of Figures
- Figure 1: Global Commercial Auto Insurance Revenue Breakdown (million, %) by Region 2025 & 2033
- Figure 2: North America Commercial Auto Insurance Revenue (million), by Application 2025 & 2033
- Figure 3: North America Commercial Auto Insurance Revenue Share (%), by Application 2025 & 2033
- Figure 4: North America Commercial Auto Insurance Revenue (million), by Types 2025 & 2033
- Figure 5: North America Commercial Auto Insurance Revenue Share (%), by Types 2025 & 2033
- Figure 6: North America Commercial Auto Insurance Revenue (million), by Country 2025 & 2033
- Figure 7: North America Commercial Auto Insurance Revenue Share (%), by Country 2025 & 2033
- Figure 8: South America Commercial Auto Insurance Revenue (million), by Application 2025 & 2033
- Figure 9: South America Commercial Auto Insurance Revenue Share (%), by Application 2025 & 2033
- Figure 10: South America Commercial Auto Insurance Revenue (million), by Types 2025 & 2033
- Figure 11: South America Commercial Auto Insurance Revenue Share (%), by Types 2025 & 2033
- Figure 12: South America Commercial Auto Insurance Revenue (million), by Country 2025 & 2033
- Figure 13: South America Commercial Auto Insurance Revenue Share (%), by Country 2025 & 2033
- Figure 14: Europe Commercial Auto Insurance Revenue (million), by Application 2025 & 2033
- Figure 15: Europe Commercial Auto Insurance Revenue Share (%), by Application 2025 & 2033
- Figure 16: Europe Commercial Auto Insurance Revenue (million), by Types 2025 & 2033
- Figure 17: Europe Commercial Auto Insurance Revenue Share (%), by Types 2025 & 2033
- Figure 18: Europe Commercial Auto Insurance Revenue (million), by Country 2025 & 2033
- Figure 19: Europe Commercial Auto Insurance Revenue Share (%), by Country 2025 & 2033
- Figure 20: Middle East & Africa Commercial Auto Insurance Revenue (million), by Application 2025 & 2033
- Figure 21: Middle East & Africa Commercial Auto Insurance Revenue Share (%), by Application 2025 & 2033
- Figure 22: Middle East & Africa Commercial Auto Insurance Revenue (million), by Types 2025 & 2033
- Figure 23: Middle East & Africa Commercial Auto Insurance Revenue Share (%), by Types 2025 & 2033
- Figure 24: Middle East & Africa Commercial Auto Insurance Revenue (million), by Country 2025 & 2033
- Figure 25: Middle East & Africa Commercial Auto Insurance Revenue Share (%), by Country 2025 & 2033
- Figure 26: Asia Pacific Commercial Auto Insurance Revenue (million), by Application 2025 & 2033
- Figure 27: Asia Pacific Commercial Auto Insurance Revenue Share (%), by Application 2025 & 2033
- Figure 28: Asia Pacific Commercial Auto Insurance Revenue (million), by Types 2025 & 2033
- Figure 29: Asia Pacific Commercial Auto Insurance Revenue Share (%), by Types 2025 & 2033
- Figure 30: Asia Pacific Commercial Auto Insurance Revenue (million), by Country 2025 & 2033
- Figure 31: Asia Pacific Commercial Auto Insurance Revenue Share (%), by Country 2025 & 2033
List of Tables
- Table 1: Global Commercial Auto Insurance Revenue million Forecast, by Application 2020 & 2033
- Table 2: Global Commercial Auto Insurance Revenue million Forecast, by Types 2020 & 2033
- Table 3: Global Commercial Auto Insurance Revenue million Forecast, by Region 2020 & 2033
- Table 4: Global Commercial Auto Insurance Revenue million Forecast, by Application 2020 & 2033
- Table 5: Global Commercial Auto Insurance Revenue million Forecast, by Types 2020 & 2033
- Table 6: Global Commercial Auto Insurance Revenue million Forecast, by Country 2020 & 2033
- Table 7: United States Commercial Auto Insurance Revenue (million) Forecast, by Application 2020 & 2033
- Table 8: Canada Commercial Auto Insurance Revenue (million) Forecast, by Application 2020 & 2033
- Table 9: Mexico Commercial Auto Insurance Revenue (million) Forecast, by Application 2020 & 2033
- Table 10: Global Commercial Auto Insurance Revenue million Forecast, by Application 2020 & 2033
- Table 11: Global Commercial Auto Insurance Revenue million Forecast, by Types 2020 & 2033
- Table 12: Global Commercial Auto Insurance Revenue million Forecast, by Country 2020 & 2033
- Table 13: Brazil Commercial Auto Insurance Revenue (million) Forecast, by Application 2020 & 2033
- Table 14: Argentina Commercial Auto Insurance Revenue (million) Forecast, by Application 2020 & 2033
- Table 15: Rest of South America Commercial Auto Insurance Revenue (million) Forecast, by Application 2020 & 2033
- Table 16: Global Commercial Auto Insurance Revenue million Forecast, by Application 2020 & 2033
- Table 17: Global Commercial Auto Insurance Revenue million Forecast, by Types 2020 & 2033
- Table 18: Global Commercial Auto Insurance Revenue million Forecast, by Country 2020 & 2033
- Table 19: United Kingdom Commercial Auto Insurance Revenue (million) Forecast, by Application 2020 & 2033
- Table 20: Germany Commercial Auto Insurance Revenue (million) Forecast, by Application 2020 & 2033
- Table 21: France Commercial Auto Insurance Revenue (million) Forecast, by Application 2020 & 2033
- Table 22: Italy Commercial Auto Insurance Revenue (million) Forecast, by Application 2020 & 2033
- Table 23: Spain Commercial Auto Insurance Revenue (million) Forecast, by Application 2020 & 2033
- Table 24: Russia Commercial Auto Insurance Revenue (million) Forecast, by Application 2020 & 2033
- Table 25: Benelux Commercial Auto Insurance Revenue (million) Forecast, by Application 2020 & 2033
- Table 26: Nordics Commercial Auto Insurance Revenue (million) Forecast, by Application 2020 & 2033
- Table 27: Rest of Europe Commercial Auto Insurance Revenue (million) Forecast, by Application 2020 & 2033
- Table 28: Global Commercial Auto Insurance Revenue million Forecast, by Application 2020 & 2033
- Table 29: Global Commercial Auto Insurance Revenue million Forecast, by Types 2020 & 2033
- Table 30: Global Commercial Auto Insurance Revenue million Forecast, by Country 2020 & 2033
- Table 31: Turkey Commercial Auto Insurance Revenue (million) Forecast, by Application 2020 & 2033
- Table 32: Israel Commercial Auto Insurance Revenue (million) Forecast, by Application 2020 & 2033
- Table 33: GCC Commercial Auto Insurance Revenue (million) Forecast, by Application 2020 & 2033
- Table 34: North Africa Commercial Auto Insurance Revenue (million) Forecast, by Application 2020 & 2033
- Table 35: South Africa Commercial Auto Insurance Revenue (million) Forecast, by Application 2020 & 2033
- Table 36: Rest of Middle East & Africa Commercial Auto Insurance Revenue (million) Forecast, by Application 2020 & 2033
- Table 37: Global Commercial Auto Insurance Revenue million Forecast, by Application 2020 & 2033
- Table 38: Global Commercial Auto Insurance Revenue million Forecast, by Types 2020 & 2033
- Table 39: Global Commercial Auto Insurance Revenue million Forecast, by Country 2020 & 2033
- Table 40: China Commercial Auto Insurance Revenue (million) Forecast, by Application 2020 & 2033
- Table 41: India Commercial Auto Insurance Revenue (million) Forecast, by Application 2020 & 2033
- Table 42: Japan Commercial Auto Insurance Revenue (million) Forecast, by Application 2020 & 2033
- Table 43: South Korea Commercial Auto Insurance Revenue (million) Forecast, by Application 2020 & 2033
- Table 44: ASEAN Commercial Auto Insurance Revenue (million) Forecast, by Application 2020 & 2033
- Table 45: Oceania Commercial Auto Insurance Revenue (million) Forecast, by Application 2020 & 2033
- Table 46: Rest of Asia Pacific Commercial Auto Insurance Revenue (million) Forecast, by Application 2020 & 2033
Frequently Asked Questions
1. What is the projected Compound Annual Growth Rate (CAGR) of the Commercial Auto Insurance?
The projected CAGR is approximately 6.5%.
2. Which companies are prominent players in the Commercial Auto Insurance?
Key companies in the market include PICC, Progressive Corporation, Ping An, AXA, Sompo Japan, Tokyo Marine, Travelers Group, Liberty Mutual Group, Zurich, CPIC, Nationwide, Mitsui Sumitomo Insurance, Aviva, Berkshire Hathaway, Old Republic International, Auto Owners Grp., Generali Group, MAPFRE, Chubb, AmTrust NGH.
3. What are the main segments of the Commercial Auto Insurance?
The market segments include Application, Types.
4. Can you provide details about the market size?
The market size is estimated to be USD 151020 million as of 2022.
5. What are some drivers contributing to market growth?
N/A
6. What are the notable trends driving market growth?
N/A
7. Are there any restraints impacting market growth?
N/A
8. Can you provide examples of recent developments in the market?
N/A
9. What pricing options are available for accessing the report?
Pricing options include single-user, multi-user, and enterprise licenses priced at USD 4900.00, USD 7350.00, and USD 9800.00 respectively.
10. Is the market size provided in terms of value or volume?
The market size is provided in terms of value, measured in million.
11. Are there any specific market keywords associated with the report?
Yes, the market keyword associated with the report is "Commercial Auto Insurance," which aids in identifying and referencing the specific market segment covered.
12. How do I determine which pricing option suits my needs best?
The pricing options vary based on user requirements and access needs. Individual users may opt for single-user licenses, while businesses requiring broader access may choose multi-user or enterprise licenses for cost-effective access to the report.
13. Are there any additional resources or data provided in the Commercial Auto Insurance report?
While the report offers comprehensive insights, it's advisable to review the specific contents or supplementary materials provided to ascertain if additional resources or data are available.
14. How can I stay updated on further developments or reports in the Commercial Auto Insurance?
To stay informed about further developments, trends, and reports in the Commercial Auto Insurance, consider subscribing to industry newsletters, following relevant companies and organizations, or regularly checking reputable industry news sources and publications.
Methodology
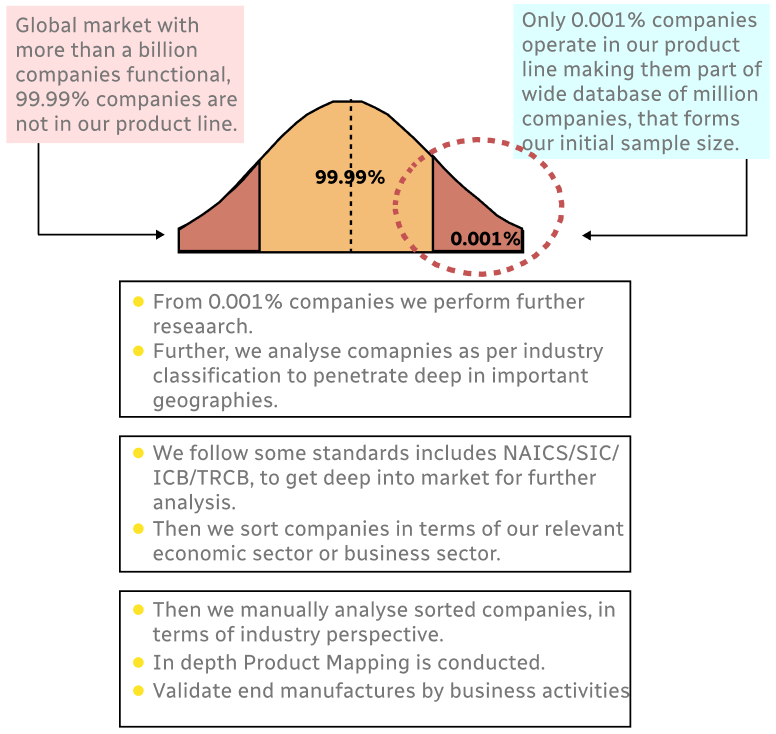
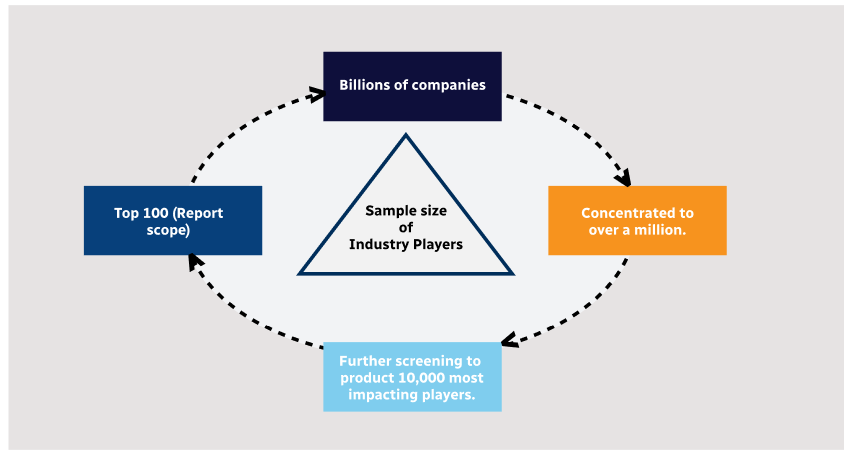
Step 1 - Identification of Relevant Samples Size from Population Database
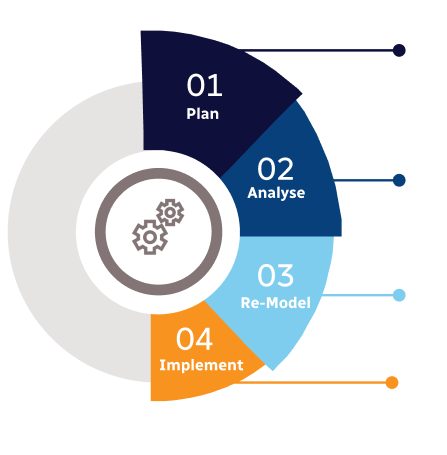
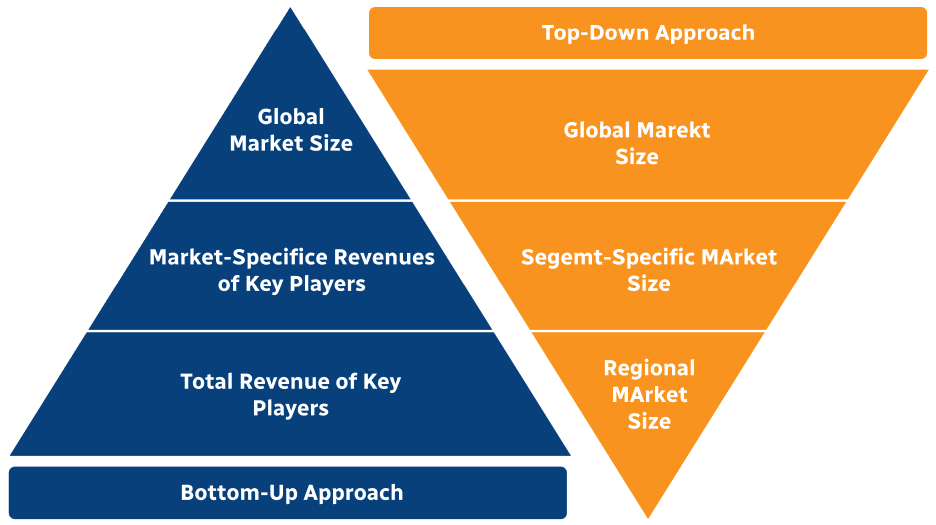
Step 2 - Approaches for Defining Global Market Size (Value, Volume* & Price*)
Note*: In applicable scenarios
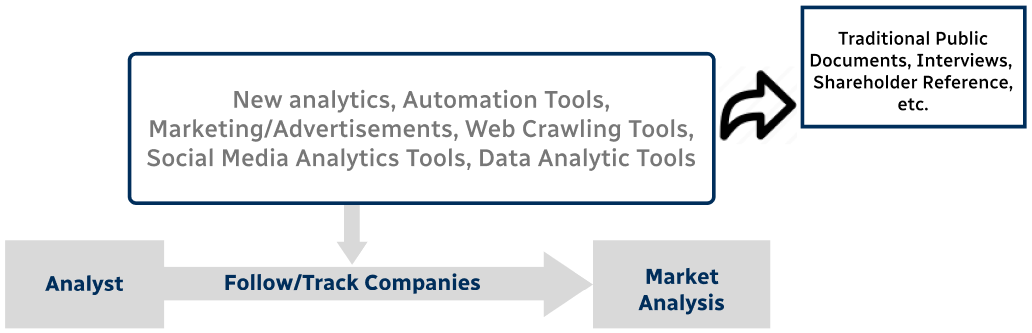
Step 3 - Data Sources
Primary Research
- Web Analytics
- Survey Reports
- Research Institute
- Latest Research Reports
- Opinion Leaders
Secondary Research
- Annual Reports
- White Paper
- Latest Press Release
- Industry Association
- Paid Database
- Investor Presentations
Step 4 - Data Triangulation
Involves using different sources of information in order to increase the validity of a study
These sources are likely to be stakeholders in a program - participants, other researchers, program staff, other community members, and so on.
Then we put all data in single framework & apply various statistical tools to find out the dynamic on the market.
During the analysis stage, feedback from the stakeholder groups would be compared to determine areas of agreement as well as areas of divergence