

Key Insights
The global commercial security crash barrier market is experiencing robust growth, driven by escalating security imperatives across government infrastructure, commercial premises, and critical facilities. The market is projected to reach a significant valuation, exhibiting a healthy Compound Annual Growth Rate (CAGR) of 14.29% throughout the forecast period (2025-2033). Key growth drivers include increasing urbanization and resulting traffic density necessitating enhanced road safety, stringent government regulations mandating crash barrier installation for improved security, and the growing adoption of advanced barrier technologies featuring innovative materials and designs for superior impact resistance and aesthetic integration. Furthermore, the rising demand for customized security solutions and the adoption of sustainable barrier materials are contributing to market expansion. Leading players, including Tata Steel Limited, NV Bekaert SA, and Valmont Industries, Inc., are actively investing in research and development to refine product portfolios and expand market presence. The market is segmented by type (fixed, retractable, removable), material (steel, concrete, composite), and application (roads, parking lots, industrial areas), offering diverse growth opportunities.
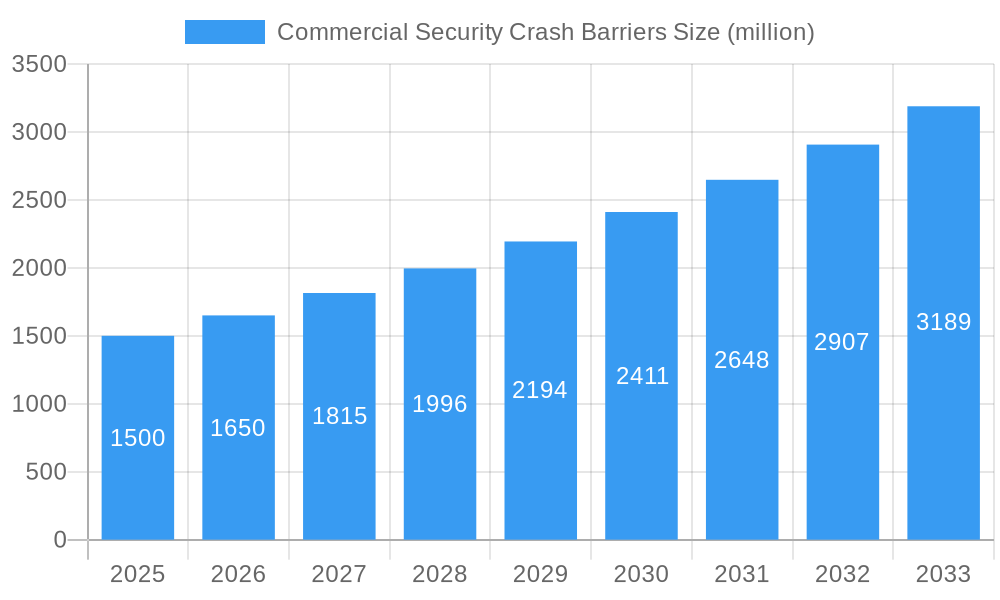
Commercial Security Crash Barriers Market Size (In Billion)
While the market demonstrates strong potential, certain restraints exist, such as high initial installation and maintenance costs, which can impact client adoption. The availability of alternative security measures and potential complexities in regulatory compliance across various regions may also influence market expansion. Nevertheless, the long-term outlook for the commercial security crash barrier market remains positive, underpinned by the increasing global emphasis on infrastructure security and road safety. Significant expansion is anticipated in regions characterized by rapid infrastructure development and growing industrial activities. Strategic collaborations, mergers, and acquisitions among key entities are expected to shape market dynamics, fostering further technological advancements and enhanced product offerings.
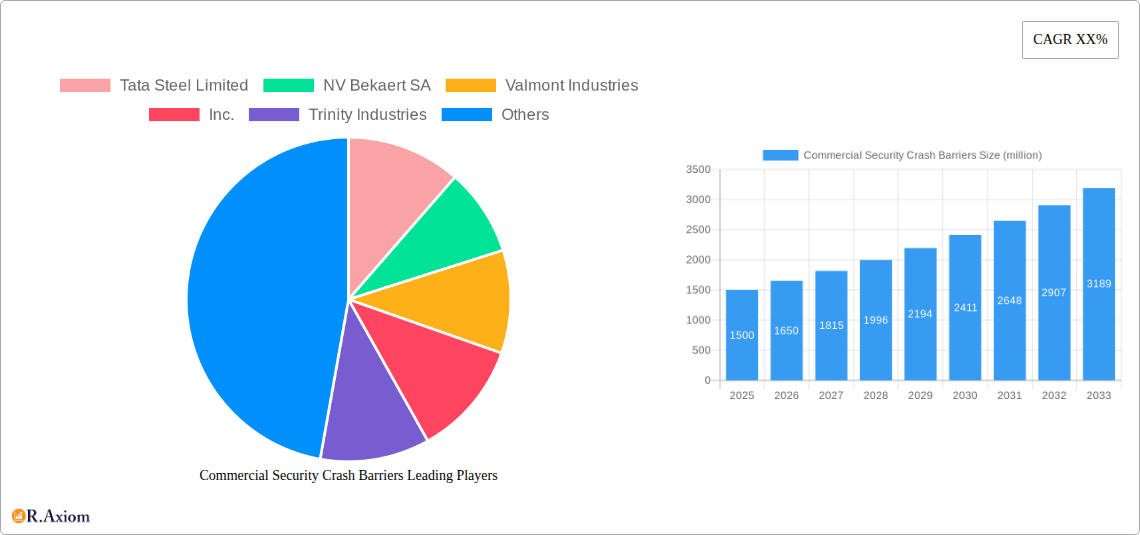
Commercial Security Crash Barriers Company Market Share
Commercial Security Crash Barriers Market Analysis: 2019-2033
This comprehensive market analysis offers in-depth insights into the global commercial security crash barriers market, providing valuable intelligence for industry stakeholders, investors, and strategic decision-makers. The study covers the period 2019-2033, with a specific focus on the forecast period 2025-2033, utilizing 2025 as the base year. The market is projected to reach $7.82 billion in 2025, with substantial growth anticipated throughout the forecast period. This detailed examination explores market concentration, innovation trends, dominant segments, product advancements, and key players, equipping readers with actionable strategies for success in this dynamic market.
Commercial Security Crash Barriers Market Concentration & Innovation
The global commercial security crash barriers market exhibits a moderately concentrated landscape, with a few dominant players holding significant market share. Tata Steel Limited, NV Bekaert SA, and Valmont Industries, Inc. are among the leading companies, collectively accounting for an estimated XX% of the market share in 2025. The market is characterized by continuous innovation driven by stringent safety regulations, increasing demand for enhanced security solutions, and advancements in materials science.
- Market Share (2025): Tata Steel Limited (XX%), NV Bekaert SA (XX%), Valmont Industries, Inc. (XX%), Others (XX%).
- M&A Activities: Over the historical period (2019-2024), the market witnessed approximately XX M&A deals valued at $XX million, primarily driven by expansion strategies and technological integration.
- Regulatory Frameworks: Stringent safety standards and regulations regarding crash barrier performance are significant drivers of innovation and market growth. These regulations vary across regions, creating opportunities for specialized barrier solutions.
- Product Substitutes: While concrete barriers remain prevalent, there is increasing demand for lighter, more aesthetically pleasing, and easily deployable alternatives, leading to innovation in materials and designs.
- End-User Trends: The growing adoption of crash barriers in high-security areas such as government buildings, critical infrastructure sites, and commercial complexes is a key growth factor.
Commercial Security Crash Barriers Industry Trends & Insights
The commercial security crash barriers market is experiencing robust growth, projected to reach $XX million by 2033, with a compound annual growth rate (CAGR) of XX% during the forecast period (2025-2033). This growth is fueled by several factors:
- Increased urbanization and infrastructure development are driving demand for enhanced security solutions in densely populated areas.
- Rising concerns about terrorism and public safety are bolstering investment in robust security infrastructure.
- Technological advancements, such as the integration of smart sensors and automated deployment systems, are enhancing barrier functionality and efficiency.
- The shift towards sustainable infrastructure is promoting the adoption of eco-friendly materials in crash barrier manufacturing.
- Competitive dynamics are leading to product differentiation and price optimization, enhancing market accessibility. Market penetration has increased from XX% in 2019 to an estimated XX% in 2025.
Dominant Markets & Segments in Commercial Security Crash Barriers
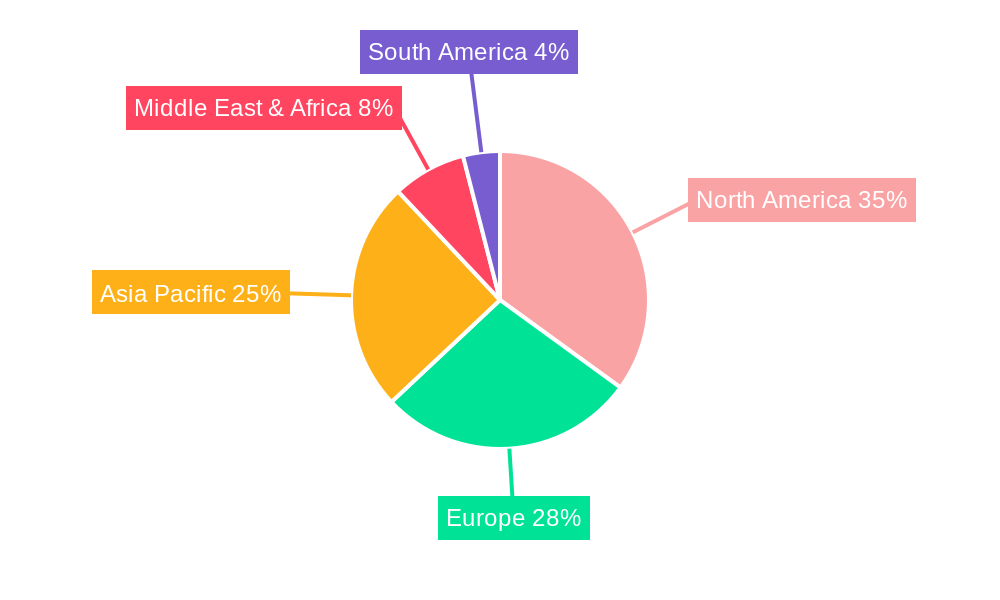
North America currently dominates the global commercial security crash barriers market, accounting for approximately XX% of the global market in 2025. This dominance is attributed to several factors:
- Strong Regulatory Framework: Stringent safety and security regulations in North America drive the adoption of advanced crash barriers.
- Robust Infrastructure Investment: Significant government spending on infrastructure development fuels demand for durable and efficient crash barrier systems.
- High Awareness of Security Risks: Increased public awareness of security threats further contributes to market growth.
Key Drivers:
- Robust infrastructure spending.
- Stringent safety regulations.
- High public safety awareness.
Other regions, such as Europe and Asia-Pacific, are also experiencing significant growth, driven by factors like increasing urbanization, economic development, and rising security concerns.
Commercial Security Crash Barriers Product Developments
Recent product innovations in commercial security crash barriers include the development of lighter, stronger, and more aesthetically pleasing materials, along with integrated technologies such as automated deployment systems and intelligent sensors for enhanced security and real-time monitoring. These advancements cater to evolving market demands for increased safety, durability, and ease of use, offering significant competitive advantages to manufacturers.
Report Scope & Segmentation Analysis
This report segments the commercial security crash barriers market based on various parameters:
- By Material: Steel, Concrete, and Others. Steel barriers dominate the market due to their strength and versatility, while concrete barriers are commonly used for static applications. Other materials like polymer composites are gaining traction due to their lightweight nature.
- By Type: Fixed and Removable. Fixed barriers are cost-effective for permanent installations, while removable barriers offer flexibility and adaptability for temporary security needs.
- By Application: Roadways, Airports, and Other Critical Infrastructure. Roadway applications constitute the largest segment, driven by increasing road safety concerns.
- By Region: North America, Europe, Asia-Pacific, Rest of World. Each region offers unique market dynamics and growth potential.
Key Drivers of Commercial Security Crash Barriers Growth
Several key factors are propelling the growth of the commercial security crash barriers market. Stringent government regulations mandating the use of crash barriers in critical infrastructure projects are a primary driver. Furthermore, the rising need for enhanced security in urban areas, coupled with infrastructure development projects globally, significantly boosts market demand. Technological advancements, such as the introduction of smart crash barriers with integrated sensors and improved design materials, further contribute to the market’s expansion.
Challenges in the Commercial Security Crash Barriers Sector
The commercial security crash barriers market faces challenges, including fluctuating raw material prices impacting production costs. Supply chain disruptions can lead to production delays and increased costs. Furthermore, intense competition among numerous market players creates pressure on pricing and profit margins. Regulatory changes and the need for continuous innovation to meet evolving safety standards also present challenges for market participants.
Emerging Opportunities in Commercial Security Crash Barriers
Significant opportunities exist in developing innovative crash barrier technologies with enhanced functionalities. Integrating smart sensors, AI-powered monitoring systems, and durable materials are key trends. Expanding into new markets with stringent safety regulations and focusing on environmentally friendly materials present promising avenues for growth. Government initiatives promoting sustainable infrastructure projects are likely to boost the adoption of eco-friendly crash barriers.
Leading Players in the Commercial Security Crash Barriers Market
- Tata Steel Limited
- NV Bekaert SA
- Valmont Industries, Inc.
- Trinity Industries, Inc.
- Nucor Corporation
- Lindsay Corporation
- Hill & Smith Holdings Plc
- Transpo Industries, Inc.
- Arbus Limited
- Avon Barrier Corporation Ltd.
Key Developments in Commercial Security Crash Barriers Industry
- 2022 Q4: Tata Steel Limited launched a new high-strength steel for crash barriers.
- 2023 Q1: NV Bekaert SA partnered with a technology firm to develop smart crash barriers with integrated sensors.
- 2023 Q3: Valmont Industries, Inc. announced a new manufacturing facility dedicated to crash barriers.
(Further developments could be added based on actual market data)
Strategic Outlook for Commercial Security Crash Barriers Market
The commercial security crash barriers market is poised for substantial growth, driven by ongoing infrastructure development, stringent safety regulations, and rising demand for enhanced security solutions. Strategic investments in research and development, focusing on innovative materials and integrated technologies, are crucial for success. Expanding market presence through strategic partnerships and acquisitions will further enhance market competitiveness. The focus on sustainable solutions and meeting evolving regulatory requirements will play a pivotal role in shaping future market dynamics and opportunities.
Commercial Security Crash Barriers Segmentation
-
1. Application
- 1.1. Roadside Barriers
- 1.2. Work-zone Barriers
- 1.3. Bridge barriers
- 1.4. Other
-
2. Types
- 2.1. Portable
- 2.2. Fixed
Commercial Security Crash Barriers Segmentation By Geography
-
1. North America
- 1.1. United States
- 1.2. Canada
- 1.3. Mexico
-
2. South America
- 2.1. Brazil
- 2.2. Argentina
- 2.3. Rest of South America
-
3. Europe
- 3.1. United Kingdom
- 3.2. Germany
- 3.3. France
- 3.4. Italy
- 3.5. Spain
- 3.6. Russia
- 3.7. Benelux
- 3.8. Nordics
- 3.9. Rest of Europe
-
4. Middle East & Africa
- 4.1. Turkey
- 4.2. Israel
- 4.3. GCC
- 4.4. North Africa
- 4.5. South Africa
- 4.6. Rest of Middle East & Africa
-
5. Asia Pacific
- 5.1. China
- 5.2. India
- 5.3. Japan
- 5.4. South Korea
- 5.5. ASEAN
- 5.6. Oceania
- 5.7. Rest of Asia Pacific
Commercial Security Crash Barriers Regional Market Share
Geographic Coverage of Commercial Security Crash Barriers
Commercial Security Crash Barriers REPORT HIGHLIGHTS
| Aspects | Details |
|---|---|
| Study Period | 2020-2034 |
| Base Year | 2025 |
| Estimated Year | 2026 |
| Forecast Period | 2026-2034 |
| Historical Period | 2020-2025 |
| Growth Rate | CAGR of 14.29% from 2020-2034 |
| Segmentation |
|
Table of Contents
- 1. Introduction
- 1.1. Research Scope
- 1.2. Market Segmentation
- 1.3. Research Methodology
- 1.4. Definitions and Assumptions
- 2. Executive Summary
- 2.1. Introduction
- 3. Market Dynamics
- 3.1. Introduction
- 3.2. Market Drivers
- 3.3. Market Restrains
- 3.4. Market Trends
- 4. Market Factor Analysis
- 4.1. Porters Five Forces
- 4.2. Supply/Value Chain
- 4.3. PESTEL analysis
- 4.4. Market Entropy
- 4.5. Patent/Trademark Analysis
- 5. Global Commercial Security Crash Barriers Analysis, Insights and Forecast, 2020-2032
- 5.1. Market Analysis, Insights and Forecast - by Application
- 5.1.1. Roadside Barriers
- 5.1.2. Work-zone Barriers
- 5.1.3. Bridge barriers
- 5.1.4. Other
- 5.2. Market Analysis, Insights and Forecast - by Types
- 5.2.1. Portable
- 5.2.2. Fixed
- 5.3. Market Analysis, Insights and Forecast - by Region
- 5.3.1. North America
- 5.3.2. South America
- 5.3.3. Europe
- 5.3.4. Middle East & Africa
- 5.3.5. Asia Pacific
- 5.1. Market Analysis, Insights and Forecast - by Application
- 6. North America Commercial Security Crash Barriers Analysis, Insights and Forecast, 2020-2032
- 6.1. Market Analysis, Insights and Forecast - by Application
- 6.1.1. Roadside Barriers
- 6.1.2. Work-zone Barriers
- 6.1.3. Bridge barriers
- 6.1.4. Other
- 6.2. Market Analysis, Insights and Forecast - by Types
- 6.2.1. Portable
- 6.2.2. Fixed
- 6.1. Market Analysis, Insights and Forecast - by Application
- 7. South America Commercial Security Crash Barriers Analysis, Insights and Forecast, 2020-2032
- 7.1. Market Analysis, Insights and Forecast - by Application
- 7.1.1. Roadside Barriers
- 7.1.2. Work-zone Barriers
- 7.1.3. Bridge barriers
- 7.1.4. Other
- 7.2. Market Analysis, Insights and Forecast - by Types
- 7.2.1. Portable
- 7.2.2. Fixed
- 7.1. Market Analysis, Insights and Forecast - by Application
- 8. Europe Commercial Security Crash Barriers Analysis, Insights and Forecast, 2020-2032
- 8.1. Market Analysis, Insights and Forecast - by Application
- 8.1.1. Roadside Barriers
- 8.1.2. Work-zone Barriers
- 8.1.3. Bridge barriers
- 8.1.4. Other
- 8.2. Market Analysis, Insights and Forecast - by Types
- 8.2.1. Portable
- 8.2.2. Fixed
- 8.1. Market Analysis, Insights and Forecast - by Application
- 9. Middle East & Africa Commercial Security Crash Barriers Analysis, Insights and Forecast, 2020-2032
- 9.1. Market Analysis, Insights and Forecast - by Application
- 9.1.1. Roadside Barriers
- 9.1.2. Work-zone Barriers
- 9.1.3. Bridge barriers
- 9.1.4. Other
- 9.2. Market Analysis, Insights and Forecast - by Types
- 9.2.1. Portable
- 9.2.2. Fixed
- 9.1. Market Analysis, Insights and Forecast - by Application
- 10. Asia Pacific Commercial Security Crash Barriers Analysis, Insights and Forecast, 2020-2032
- 10.1. Market Analysis, Insights and Forecast - by Application
- 10.1.1. Roadside Barriers
- 10.1.2. Work-zone Barriers
- 10.1.3. Bridge barriers
- 10.1.4. Other
- 10.2. Market Analysis, Insights and Forecast - by Types
- 10.2.1. Portable
- 10.2.2. Fixed
- 10.1. Market Analysis, Insights and Forecast - by Application
- 11. Competitive Analysis
- 11.1. Global Market Share Analysis 2025
- 11.2. Company Profiles
- 11.2.1 Tata Steel Limited
- 11.2.1.1. Overview
- 11.2.1.2. Products
- 11.2.1.3. SWOT Analysis
- 11.2.1.4. Recent Developments
- 11.2.1.5. Financials (Based on Availability)
- 11.2.2 NV Bekaert SA
- 11.2.2.1. Overview
- 11.2.2.2. Products
- 11.2.2.3. SWOT Analysis
- 11.2.2.4. Recent Developments
- 11.2.2.5. Financials (Based on Availability)
- 11.2.3 Valmont Industries
- 11.2.3.1. Overview
- 11.2.3.2. Products
- 11.2.3.3. SWOT Analysis
- 11.2.3.4. Recent Developments
- 11.2.3.5. Financials (Based on Availability)
- 11.2.4 Inc.
- 11.2.4.1. Overview
- 11.2.4.2. Products
- 11.2.4.3. SWOT Analysis
- 11.2.4.4. Recent Developments
- 11.2.4.5. Financials (Based on Availability)
- 11.2.5 Trinity Industries
- 11.2.5.1. Overview
- 11.2.5.2. Products
- 11.2.5.3. SWOT Analysis
- 11.2.5.4. Recent Developments
- 11.2.5.5. Financials (Based on Availability)
- 11.2.6 Inc.
- 11.2.6.1. Overview
- 11.2.6.2. Products
- 11.2.6.3. SWOT Analysis
- 11.2.6.4. Recent Developments
- 11.2.6.5. Financials (Based on Availability)
- 11.2.7 Nucor Corporation
- 11.2.7.1. Overview
- 11.2.7.2. Products
- 11.2.7.3. SWOT Analysis
- 11.2.7.4. Recent Developments
- 11.2.7.5. Financials (Based on Availability)
- 11.2.8 Lindsay Corporation
- 11.2.8.1. Overview
- 11.2.8.2. Products
- 11.2.8.3. SWOT Analysis
- 11.2.8.4. Recent Developments
- 11.2.8.5. Financials (Based on Availability)
- 11.2.9 Hill & Smith Holdings Plc
- 11.2.9.1. Overview
- 11.2.9.2. Products
- 11.2.9.3. SWOT Analysis
- 11.2.9.4. Recent Developments
- 11.2.9.5. Financials (Based on Availability)
- 11.2.10 Transpo Industries
- 11.2.10.1. Overview
- 11.2.10.2. Products
- 11.2.10.3. SWOT Analysis
- 11.2.10.4. Recent Developments
- 11.2.10.5. Financials (Based on Availability)
- 11.2.11 Inc.
- 11.2.11.1. Overview
- 11.2.11.2. Products
- 11.2.11.3. SWOT Analysis
- 11.2.11.4. Recent Developments
- 11.2.11.5. Financials (Based on Availability)
- 11.2.12 Arbus Limited
- 11.2.12.1. Overview
- 11.2.12.2. Products
- 11.2.12.3. SWOT Analysis
- 11.2.12.4. Recent Developments
- 11.2.12.5. Financials (Based on Availability)
- 11.2.13 Avon Barrier Corporation Ltd.
- 11.2.13.1. Overview
- 11.2.13.2. Products
- 11.2.13.3. SWOT Analysis
- 11.2.13.4. Recent Developments
- 11.2.13.5. Financials (Based on Availability)
- 11.2.1 Tata Steel Limited
List of Figures
- Figure 1: Global Commercial Security Crash Barriers Revenue Breakdown (billion, %) by Region 2025 & 2033
- Figure 2: Global Commercial Security Crash Barriers Volume Breakdown (K, %) by Region 2025 & 2033
- Figure 3: North America Commercial Security Crash Barriers Revenue (billion), by Application 2025 & 2033
- Figure 4: North America Commercial Security Crash Barriers Volume (K), by Application 2025 & 2033
- Figure 5: North America Commercial Security Crash Barriers Revenue Share (%), by Application 2025 & 2033
- Figure 6: North America Commercial Security Crash Barriers Volume Share (%), by Application 2025 & 2033
- Figure 7: North America Commercial Security Crash Barriers Revenue (billion), by Types 2025 & 2033
- Figure 8: North America Commercial Security Crash Barriers Volume (K), by Types 2025 & 2033
- Figure 9: North America Commercial Security Crash Barriers Revenue Share (%), by Types 2025 & 2033
- Figure 10: North America Commercial Security Crash Barriers Volume Share (%), by Types 2025 & 2033
- Figure 11: North America Commercial Security Crash Barriers Revenue (billion), by Country 2025 & 2033
- Figure 12: North America Commercial Security Crash Barriers Volume (K), by Country 2025 & 2033
- Figure 13: North America Commercial Security Crash Barriers Revenue Share (%), by Country 2025 & 2033
- Figure 14: North America Commercial Security Crash Barriers Volume Share (%), by Country 2025 & 2033
- Figure 15: South America Commercial Security Crash Barriers Revenue (billion), by Application 2025 & 2033
- Figure 16: South America Commercial Security Crash Barriers Volume (K), by Application 2025 & 2033
- Figure 17: South America Commercial Security Crash Barriers Revenue Share (%), by Application 2025 & 2033
- Figure 18: South America Commercial Security Crash Barriers Volume Share (%), by Application 2025 & 2033
- Figure 19: South America Commercial Security Crash Barriers Revenue (billion), by Types 2025 & 2033
- Figure 20: South America Commercial Security Crash Barriers Volume (K), by Types 2025 & 2033
- Figure 21: South America Commercial Security Crash Barriers Revenue Share (%), by Types 2025 & 2033
- Figure 22: South America Commercial Security Crash Barriers Volume Share (%), by Types 2025 & 2033
- Figure 23: South America Commercial Security Crash Barriers Revenue (billion), by Country 2025 & 2033
- Figure 24: South America Commercial Security Crash Barriers Volume (K), by Country 2025 & 2033
- Figure 25: South America Commercial Security Crash Barriers Revenue Share (%), by Country 2025 & 2033
- Figure 26: South America Commercial Security Crash Barriers Volume Share (%), by Country 2025 & 2033
- Figure 27: Europe Commercial Security Crash Barriers Revenue (billion), by Application 2025 & 2033
- Figure 28: Europe Commercial Security Crash Barriers Volume (K), by Application 2025 & 2033
- Figure 29: Europe Commercial Security Crash Barriers Revenue Share (%), by Application 2025 & 2033
- Figure 30: Europe Commercial Security Crash Barriers Volume Share (%), by Application 2025 & 2033
- Figure 31: Europe Commercial Security Crash Barriers Revenue (billion), by Types 2025 & 2033
- Figure 32: Europe Commercial Security Crash Barriers Volume (K), by Types 2025 & 2033
- Figure 33: Europe Commercial Security Crash Barriers Revenue Share (%), by Types 2025 & 2033
- Figure 34: Europe Commercial Security Crash Barriers Volume Share (%), by Types 2025 & 2033
- Figure 35: Europe Commercial Security Crash Barriers Revenue (billion), by Country 2025 & 2033
- Figure 36: Europe Commercial Security Crash Barriers Volume (K), by Country 2025 & 2033
- Figure 37: Europe Commercial Security Crash Barriers Revenue Share (%), by Country 2025 & 2033
- Figure 38: Europe Commercial Security Crash Barriers Volume Share (%), by Country 2025 & 2033
- Figure 39: Middle East & Africa Commercial Security Crash Barriers Revenue (billion), by Application 2025 & 2033
- Figure 40: Middle East & Africa Commercial Security Crash Barriers Volume (K), by Application 2025 & 2033
- Figure 41: Middle East & Africa Commercial Security Crash Barriers Revenue Share (%), by Application 2025 & 2033
- Figure 42: Middle East & Africa Commercial Security Crash Barriers Volume Share (%), by Application 2025 & 2033
- Figure 43: Middle East & Africa Commercial Security Crash Barriers Revenue (billion), by Types 2025 & 2033
- Figure 44: Middle East & Africa Commercial Security Crash Barriers Volume (K), by Types 2025 & 2033
- Figure 45: Middle East & Africa Commercial Security Crash Barriers Revenue Share (%), by Types 2025 & 2033
- Figure 46: Middle East & Africa Commercial Security Crash Barriers Volume Share (%), by Types 2025 & 2033
- Figure 47: Middle East & Africa Commercial Security Crash Barriers Revenue (billion), by Country 2025 & 2033
- Figure 48: Middle East & Africa Commercial Security Crash Barriers Volume (K), by Country 2025 & 2033
- Figure 49: Middle East & Africa Commercial Security Crash Barriers Revenue Share (%), by Country 2025 & 2033
- Figure 50: Middle East & Africa Commercial Security Crash Barriers Volume Share (%), by Country 2025 & 2033
- Figure 51: Asia Pacific Commercial Security Crash Barriers Revenue (billion), by Application 2025 & 2033
- Figure 52: Asia Pacific Commercial Security Crash Barriers Volume (K), by Application 2025 & 2033
- Figure 53: Asia Pacific Commercial Security Crash Barriers Revenue Share (%), by Application 2025 & 2033
- Figure 54: Asia Pacific Commercial Security Crash Barriers Volume Share (%), by Application 2025 & 2033
- Figure 55: Asia Pacific Commercial Security Crash Barriers Revenue (billion), by Types 2025 & 2033
- Figure 56: Asia Pacific Commercial Security Crash Barriers Volume (K), by Types 2025 & 2033
- Figure 57: Asia Pacific Commercial Security Crash Barriers Revenue Share (%), by Types 2025 & 2033
- Figure 58: Asia Pacific Commercial Security Crash Barriers Volume Share (%), by Types 2025 & 2033
- Figure 59: Asia Pacific Commercial Security Crash Barriers Revenue (billion), by Country 2025 & 2033
- Figure 60: Asia Pacific Commercial Security Crash Barriers Volume (K), by Country 2025 & 2033
- Figure 61: Asia Pacific Commercial Security Crash Barriers Revenue Share (%), by Country 2025 & 2033
- Figure 62: Asia Pacific Commercial Security Crash Barriers Volume Share (%), by Country 2025 & 2033
List of Tables
- Table 1: Global Commercial Security Crash Barriers Revenue billion Forecast, by Application 2020 & 2033
- Table 2: Global Commercial Security Crash Barriers Volume K Forecast, by Application 2020 & 2033
- Table 3: Global Commercial Security Crash Barriers Revenue billion Forecast, by Types 2020 & 2033
- Table 4: Global Commercial Security Crash Barriers Volume K Forecast, by Types 2020 & 2033
- Table 5: Global Commercial Security Crash Barriers Revenue billion Forecast, by Region 2020 & 2033
- Table 6: Global Commercial Security Crash Barriers Volume K Forecast, by Region 2020 & 2033
- Table 7: Global Commercial Security Crash Barriers Revenue billion Forecast, by Application 2020 & 2033
- Table 8: Global Commercial Security Crash Barriers Volume K Forecast, by Application 2020 & 2033
- Table 9: Global Commercial Security Crash Barriers Revenue billion Forecast, by Types 2020 & 2033
- Table 10: Global Commercial Security Crash Barriers Volume K Forecast, by Types 2020 & 2033
- Table 11: Global Commercial Security Crash Barriers Revenue billion Forecast, by Country 2020 & 2033
- Table 12: Global Commercial Security Crash Barriers Volume K Forecast, by Country 2020 & 2033
- Table 13: United States Commercial Security Crash Barriers Revenue (billion) Forecast, by Application 2020 & 2033
- Table 14: United States Commercial Security Crash Barriers Volume (K) Forecast, by Application 2020 & 2033
- Table 15: Canada Commercial Security Crash Barriers Revenue (billion) Forecast, by Application 2020 & 2033
- Table 16: Canada Commercial Security Crash Barriers Volume (K) Forecast, by Application 2020 & 2033
- Table 17: Mexico Commercial Security Crash Barriers Revenue (billion) Forecast, by Application 2020 & 2033
- Table 18: Mexico Commercial Security Crash Barriers Volume (K) Forecast, by Application 2020 & 2033
- Table 19: Global Commercial Security Crash Barriers Revenue billion Forecast, by Application 2020 & 2033
- Table 20: Global Commercial Security Crash Barriers Volume K Forecast, by Application 2020 & 2033
- Table 21: Global Commercial Security Crash Barriers Revenue billion Forecast, by Types 2020 & 2033
- Table 22: Global Commercial Security Crash Barriers Volume K Forecast, by Types 2020 & 2033
- Table 23: Global Commercial Security Crash Barriers Revenue billion Forecast, by Country 2020 & 2033
- Table 24: Global Commercial Security Crash Barriers Volume K Forecast, by Country 2020 & 2033
- Table 25: Brazil Commercial Security Crash Barriers Revenue (billion) Forecast, by Application 2020 & 2033
- Table 26: Brazil Commercial Security Crash Barriers Volume (K) Forecast, by Application 2020 & 2033
- Table 27: Argentina Commercial Security Crash Barriers Revenue (billion) Forecast, by Application 2020 & 2033
- Table 28: Argentina Commercial Security Crash Barriers Volume (K) Forecast, by Application 2020 & 2033
- Table 29: Rest of South America Commercial Security Crash Barriers Revenue (billion) Forecast, by Application 2020 & 2033
- Table 30: Rest of South America Commercial Security Crash Barriers Volume (K) Forecast, by Application 2020 & 2033
- Table 31: Global Commercial Security Crash Barriers Revenue billion Forecast, by Application 2020 & 2033
- Table 32: Global Commercial Security Crash Barriers Volume K Forecast, by Application 2020 & 2033
- Table 33: Global Commercial Security Crash Barriers Revenue billion Forecast, by Types 2020 & 2033
- Table 34: Global Commercial Security Crash Barriers Volume K Forecast, by Types 2020 & 2033
- Table 35: Global Commercial Security Crash Barriers Revenue billion Forecast, by Country 2020 & 2033
- Table 36: Global Commercial Security Crash Barriers Volume K Forecast, by Country 2020 & 2033
- Table 37: United Kingdom Commercial Security Crash Barriers Revenue (billion) Forecast, by Application 2020 & 2033
- Table 38: United Kingdom Commercial Security Crash Barriers Volume (K) Forecast, by Application 2020 & 2033
- Table 39: Germany Commercial Security Crash Barriers Revenue (billion) Forecast, by Application 2020 & 2033
- Table 40: Germany Commercial Security Crash Barriers Volume (K) Forecast, by Application 2020 & 2033
- Table 41: France Commercial Security Crash Barriers Revenue (billion) Forecast, by Application 2020 & 2033
- Table 42: France Commercial Security Crash Barriers Volume (K) Forecast, by Application 2020 & 2033
- Table 43: Italy Commercial Security Crash Barriers Revenue (billion) Forecast, by Application 2020 & 2033
- Table 44: Italy Commercial Security Crash Barriers Volume (K) Forecast, by Application 2020 & 2033
- Table 45: Spain Commercial Security Crash Barriers Revenue (billion) Forecast, by Application 2020 & 2033
- Table 46: Spain Commercial Security Crash Barriers Volume (K) Forecast, by Application 2020 & 2033
- Table 47: Russia Commercial Security Crash Barriers Revenue (billion) Forecast, by Application 2020 & 2033
- Table 48: Russia Commercial Security Crash Barriers Volume (K) Forecast, by Application 2020 & 2033
- Table 49: Benelux Commercial Security Crash Barriers Revenue (billion) Forecast, by Application 2020 & 2033
- Table 50: Benelux Commercial Security Crash Barriers Volume (K) Forecast, by Application 2020 & 2033
- Table 51: Nordics Commercial Security Crash Barriers Revenue (billion) Forecast, by Application 2020 & 2033
- Table 52: Nordics Commercial Security Crash Barriers Volume (K) Forecast, by Application 2020 & 2033
- Table 53: Rest of Europe Commercial Security Crash Barriers Revenue (billion) Forecast, by Application 2020 & 2033
- Table 54: Rest of Europe Commercial Security Crash Barriers Volume (K) Forecast, by Application 2020 & 2033
- Table 55: Global Commercial Security Crash Barriers Revenue billion Forecast, by Application 2020 & 2033
- Table 56: Global Commercial Security Crash Barriers Volume K Forecast, by Application 2020 & 2033
- Table 57: Global Commercial Security Crash Barriers Revenue billion Forecast, by Types 2020 & 2033
- Table 58: Global Commercial Security Crash Barriers Volume K Forecast, by Types 2020 & 2033
- Table 59: Global Commercial Security Crash Barriers Revenue billion Forecast, by Country 2020 & 2033
- Table 60: Global Commercial Security Crash Barriers Volume K Forecast, by Country 2020 & 2033
- Table 61: Turkey Commercial Security Crash Barriers Revenue (billion) Forecast, by Application 2020 & 2033
- Table 62: Turkey Commercial Security Crash Barriers Volume (K) Forecast, by Application 2020 & 2033
- Table 63: Israel Commercial Security Crash Barriers Revenue (billion) Forecast, by Application 2020 & 2033
- Table 64: Israel Commercial Security Crash Barriers Volume (K) Forecast, by Application 2020 & 2033
- Table 65: GCC Commercial Security Crash Barriers Revenue (billion) Forecast, by Application 2020 & 2033
- Table 66: GCC Commercial Security Crash Barriers Volume (K) Forecast, by Application 2020 & 2033
- Table 67: North Africa Commercial Security Crash Barriers Revenue (billion) Forecast, by Application 2020 & 2033
- Table 68: North Africa Commercial Security Crash Barriers Volume (K) Forecast, by Application 2020 & 2033
- Table 69: South Africa Commercial Security Crash Barriers Revenue (billion) Forecast, by Application 2020 & 2033
- Table 70: South Africa Commercial Security Crash Barriers Volume (K) Forecast, by Application 2020 & 2033
- Table 71: Rest of Middle East & Africa Commercial Security Crash Barriers Revenue (billion) Forecast, by Application 2020 & 2033
- Table 72: Rest of Middle East & Africa Commercial Security Crash Barriers Volume (K) Forecast, by Application 2020 & 2033
- Table 73: Global Commercial Security Crash Barriers Revenue billion Forecast, by Application 2020 & 2033
- Table 74: Global Commercial Security Crash Barriers Volume K Forecast, by Application 2020 & 2033
- Table 75: Global Commercial Security Crash Barriers Revenue billion Forecast, by Types 2020 & 2033
- Table 76: Global Commercial Security Crash Barriers Volume K Forecast, by Types 2020 & 2033
- Table 77: Global Commercial Security Crash Barriers Revenue billion Forecast, by Country 2020 & 2033
- Table 78: Global Commercial Security Crash Barriers Volume K Forecast, by Country 2020 & 2033
- Table 79: China Commercial Security Crash Barriers Revenue (billion) Forecast, by Application 2020 & 2033
- Table 80: China Commercial Security Crash Barriers Volume (K) Forecast, by Application 2020 & 2033
- Table 81: India Commercial Security Crash Barriers Revenue (billion) Forecast, by Application 2020 & 2033
- Table 82: India Commercial Security Crash Barriers Volume (K) Forecast, by Application 2020 & 2033
- Table 83: Japan Commercial Security Crash Barriers Revenue (billion) Forecast, by Application 2020 & 2033
- Table 84: Japan Commercial Security Crash Barriers Volume (K) Forecast, by Application 2020 & 2033
- Table 85: South Korea Commercial Security Crash Barriers Revenue (billion) Forecast, by Application 2020 & 2033
- Table 86: South Korea Commercial Security Crash Barriers Volume (K) Forecast, by Application 2020 & 2033
- Table 87: ASEAN Commercial Security Crash Barriers Revenue (billion) Forecast, by Application 2020 & 2033
- Table 88: ASEAN Commercial Security Crash Barriers Volume (K) Forecast, by Application 2020 & 2033
- Table 89: Oceania Commercial Security Crash Barriers Revenue (billion) Forecast, by Application 2020 & 2033
- Table 90: Oceania Commercial Security Crash Barriers Volume (K) Forecast, by Application 2020 & 2033
- Table 91: Rest of Asia Pacific Commercial Security Crash Barriers Revenue (billion) Forecast, by Application 2020 & 2033
- Table 92: Rest of Asia Pacific Commercial Security Crash Barriers Volume (K) Forecast, by Application 2020 & 2033
Frequently Asked Questions
1. What is the projected Compound Annual Growth Rate (CAGR) of the Commercial Security Crash Barriers?
The projected CAGR is approximately 14.29%.
2. Which companies are prominent players in the Commercial Security Crash Barriers?
Key companies in the market include Tata Steel Limited, NV Bekaert SA, Valmont Industries, Inc., Trinity Industries, Inc., Nucor Corporation, Lindsay Corporation, Hill & Smith Holdings Plc, Transpo Industries, Inc., Arbus Limited, Avon Barrier Corporation Ltd..
3. What are the main segments of the Commercial Security Crash Barriers?
The market segments include Application, Types.
4. Can you provide details about the market size?
The market size is estimated to be USD 7.82 billion as of 2022.
5. What are some drivers contributing to market growth?
N/A
6. What are the notable trends driving market growth?
N/A
7. Are there any restraints impacting market growth?
N/A
8. Can you provide examples of recent developments in the market?
N/A
9. What pricing options are available for accessing the report?
Pricing options include single-user, multi-user, and enterprise licenses priced at USD 3350.00, USD 5025.00, and USD 6700.00 respectively.
10. Is the market size provided in terms of value or volume?
The market size is provided in terms of value, measured in billion and volume, measured in K.
11. Are there any specific market keywords associated with the report?
Yes, the market keyword associated with the report is "Commercial Security Crash Barriers," which aids in identifying and referencing the specific market segment covered.
12. How do I determine which pricing option suits my needs best?
The pricing options vary based on user requirements and access needs. Individual users may opt for single-user licenses, while businesses requiring broader access may choose multi-user or enterprise licenses for cost-effective access to the report.
13. Are there any additional resources or data provided in the Commercial Security Crash Barriers report?
While the report offers comprehensive insights, it's advisable to review the specific contents or supplementary materials provided to ascertain if additional resources or data are available.
14. How can I stay updated on further developments or reports in the Commercial Security Crash Barriers?
To stay informed about further developments, trends, and reports in the Commercial Security Crash Barriers, consider subscribing to industry newsletters, following relevant companies and organizations, or regularly checking reputable industry news sources and publications.
Methodology
Step 1 - Identification of Relevant Samples Size from Population Database


Step 2 - Approaches for Defining Global Market Size (Value, Volume* & Price*)

Note*: In applicable scenarios
Step 3 - Data Sources
Primary Research
- Web Analytics
- Survey Reports
- Research Institute
- Latest Research Reports
- Opinion Leaders
Secondary Research
- Annual Reports
- White Paper
- Latest Press Release
- Industry Association
- Paid Database
- Investor Presentations

Step 4 - Data Triangulation
Involves using different sources of information in order to increase the validity of a study
These sources are likely to be stakeholders in a program - participants, other researchers, program staff, other community members, and so on.
Then we put all data in single framework & apply various statistical tools to find out the dynamic on the market.
During the analysis stage, feedback from the stakeholder groups would be compared to determine areas of agreement as well as areas of divergence