

Key Insights
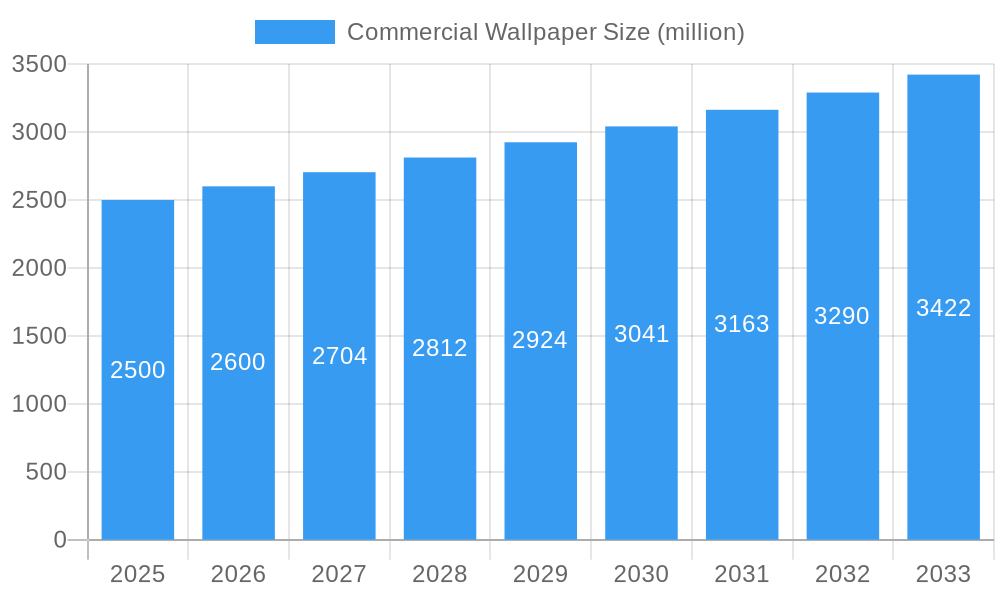
The commercial wallpaper market, while experiencing a period of moderate growth, is poised for expansion driven by several key factors. The increasing focus on aesthetically pleasing and functional workspaces is a major catalyst, with businesses increasingly recognizing the impact of interior design on employee productivity and brand image. The rising popularity of sustainable and eco-friendly wallpaper options, featuring recycled materials and low-VOC emissions, is further fueling market growth. Technological advancements in printing techniques are enabling the creation of highly customized and durable wallpapers, catering to diverse design preferences and enhancing the longevity of installations. However, the market faces challenges. Economic fluctuations can impact investment in office renovations and new construction, directly affecting demand. Furthermore, competition from alternative wall coverings, such as paint and textured panels, necessitates continuous innovation and strategic marketing to maintain market share. We project a market size of approximately $2.5 billion in 2025, with a Compound Annual Growth Rate (CAGR) of 4% over the forecast period (2025-2033). This growth is fueled by the aforementioned drivers, offset somewhat by the identified restraints. The market is segmented by various types, including vinyl, fabric, and non-woven wallpapers, with vinyl currently holding the largest segment due to its durability and cost-effectiveness. Key players, such as Asheu, Sangetsu Co., Ltd., and A.S. Création, are strategically focusing on product diversification and expansion into new geographic markets to maintain a competitive edge.
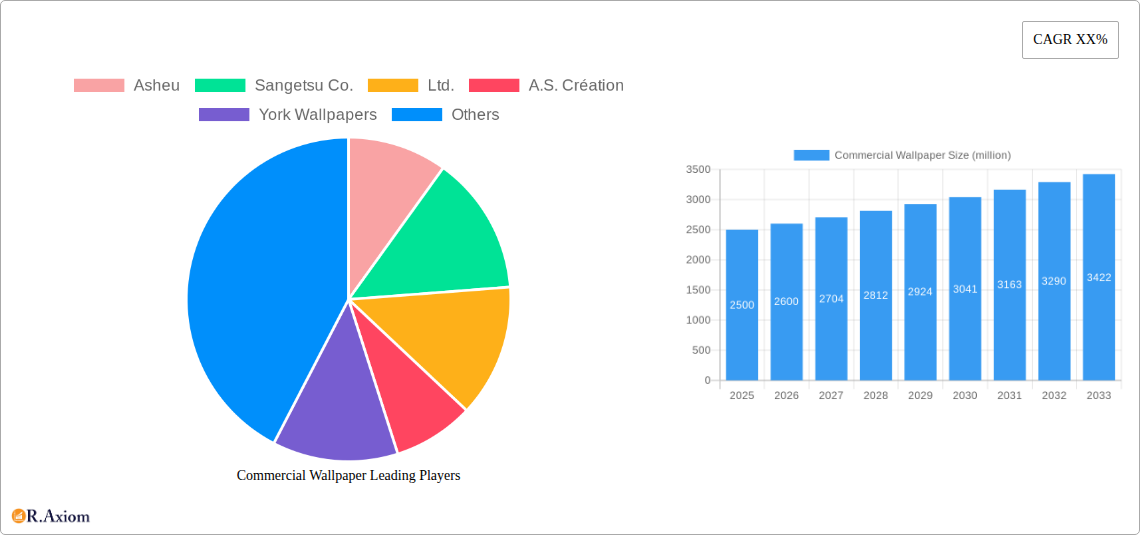
Commercial Wallpaper Market Size (In Billion)
The competitive landscape is characterized by both established international players and regional manufacturers. Larger companies are leveraging their established brand recognition and global distribution networks to capture significant market share. Smaller, regional players, however, are focusing on niche markets and offering customized solutions, providing a strong level of competition. Future growth will depend on companies’ ability to adapt to evolving customer demands, emphasizing sustainability, design flexibility, and technological integration. The continued penetration into emerging markets, especially in Asia and the Middle East, presents considerable growth opportunities for the industry. Furthermore, a clear focus on leveraging digital marketing strategies will prove crucial to increase brand visibility and reach a wider customer base. Successful players will be those capable of effectively balancing cost efficiency with the implementation of innovative design and material technology.
Commercial Wallpaper Company Market Share
Commercial Wallpaper Market Report: 2019-2033
This comprehensive report provides a detailed analysis of the global commercial wallpaper market, offering invaluable insights for industry stakeholders, investors, and businesses seeking to navigate this dynamic sector. The study covers the period 2019-2033, with a focus on the base year 2025 and a forecast period of 2025-2033. The report leverages extensive data analysis and expert insights to deliver a robust understanding of market trends, drivers, challenges, and opportunities. The global commercial wallpaper market size is estimated to reach xx million by 2025.
Commercial Wallpaper Market Concentration & Innovation
This section analyzes the competitive landscape of the commercial wallpaper market, focusing on market concentration, innovation drivers, regulatory factors, and key market activities. The market exhibits a moderately concentrated structure, with the top 10 players holding an estimated xx% market share in 2025. Companies like A.S. Création, Sangetsu Co.,Ltd., and York Wallpapers are major players, each contributing significantly to the overall market revenue.
- Market Share: The top 5 players collectively hold approximately xx% of the global market share, with A.S. Création estimated to have the highest market share at xx%.
- M&A Activity: The past five years have witnessed significant consolidation, with a total M&A deal value exceeding xx million. Key deals included the acquisition of xx company by xx company for xx million in 2022.
- Innovation Drivers: Key innovation drivers include advancements in printing technologies (e.g., digital printing), the development of sustainable and eco-friendly materials, and the growing demand for customized and personalized wallpaper solutions.
- Regulatory Landscape: Government regulations concerning VOC emissions and fire safety standards significantly influence product development and market dynamics.
- Product Substitutes: The market faces competition from alternative wall coverings such as paint, tiles, and other decorative materials. The increasing popularity of these alternatives presents a challenge to the commercial wallpaper market.
Commercial Wallpaper Industry Trends & Insights
The global commercial wallpaper market is experiencing robust growth, driven by several key factors. The projected Compound Annual Growth Rate (CAGR) for the forecast period (2025-2033) is estimated at xx%. This growth is fueled by rising construction activity in both residential and commercial sectors, increasing disposable incomes in emerging economies, and a growing preference for aesthetically appealing and functional interior designs. Technological advancements in printing and materials science continue to drive innovation within the industry, offering new possibilities in terms of design, durability, and functionality.
Market penetration of commercial wallpaper remains high in developed economies, with a saturation rate of approximately xx% in 2025. However, emerging markets present significant untapped potential, with considerable scope for future expansion. The competitive landscape is characterized by intense competition among established players and the emergence of new entrants, leading to a dynamic and evolving market. Consumer preferences are shifting towards sustainable, eco-friendly options and customizable designs, prompting manufacturers to adapt their offerings to meet these changing demands.
Dominant Markets & Segments in Commercial Wallpaper
The North American commercial wallpaper market is currently the dominant region, accounting for an estimated xx% of the global market share in 2025. This dominance is primarily attributed to the robust construction industry, high disposable incomes, and established consumer preferences for wallpaper in commercial spaces.
- Key Drivers of North American Dominance:
- Strong construction activity across various sectors (office spaces, hospitality, healthcare).
- High consumer spending on interior design and home improvement.
- Established distribution networks and strong consumer preference for wallpaper.
- Other Key Regions: Europe and Asia Pacific are also significant markets, experiencing steady growth driven by factors such as urbanization, rising middle-class incomes, and government initiatives aimed at infrastructural development.
Commercial Wallpaper Product Developments
Recent product innovations have focused on enhanced durability, improved washability, and the incorporation of antimicrobial properties for hygienic environments. Digital printing technology allows for highly customized designs and cost-effective production of unique patterns. The focus on sustainability has led to the development of eco-friendly wallpapers made from recycled materials and utilizing water-based inks. These innovations cater to the growing demand for both aesthetic appeal and functional performance in commercial settings.
Report Scope & Segmentation Analysis
This report offers a comprehensive segmentation analysis of the commercial wallpaper market, categorized by material type (vinyl, non-woven, textile), application (hotels, offices, healthcare facilities, restaurants, retail), and region (North America, Europe, Asia Pacific, Rest of World). Each segment exhibits distinct growth patterns, competitive dynamics, and market size projections. For instance, the vinyl segment is expected to maintain its market dominance throughout the forecast period due to its cost-effectiveness and durability. However, the non-woven segment is projected to experience higher growth due to its eco-friendly nature and improved aesthetics.
Key Drivers of Commercial Wallpaper Growth
The growth of the commercial wallpaper market is propelled by several key factors. Firstly, the construction industry's ongoing expansion is a major driver, creating significant demand for interior wall coverings. Secondly, increasing disposable incomes, particularly in developing economies, fuel greater spending on home and office renovations, further boosting market growth. Lastly, changing consumer preferences, favoring aesthetic enhancements and personalized designs, are pushing market expansion.
Challenges in the Commercial Wallpaper Sector
The commercial wallpaper market faces various challenges. Fluctuations in raw material prices, particularly for PVC and textile-based wallpapers, significantly impact production costs. Supply chain disruptions, particularly notable in the aftermath of the recent pandemic, affect production and distribution, impacting overall market stability. Furthermore, increased competition from alternative wall covering materials and technological advancements necessitate constant innovation to maintain market share.
Emerging Opportunities in Commercial Wallpaper
Significant opportunities exist within the commercial wallpaper market. The rising popularity of sustainable and eco-friendly products presents a major avenue for growth. Innovation in digital printing allows for high levels of customization and unique design options, catering to evolving consumer needs. Additionally, expansion into emerging markets, particularly in Asia and Africa, presents untapped potential for revenue generation.
Leading Players in the Commercial Wallpaper Market
- Asheu
- Sangetsu Co., Ltd.
- A.S. Création
- York Wallpapers
- Lilycolor
- Marburg
- Shin Han Wall Covering
- Zambaiti Parati
- Brewster Home Fashions
- Walker Greenbank Group
- LSI Wallcovering
- J.Josephson
- Len-Tex Corporation
- Osborne&little
- KOROSEAL Interior Products
- Grandeco Wallfashion
- F. Schumacher & Company
- Laura Ashley
- DAEWON CHEMICAL
- Wallquest
- Yulan Wallcoverings
- Fidelity Wallcoverings
- Roysons Corporation
- Wallife
- Topli
- Beitai Wallpaper
- Johns Manville
- Artshow Wallpaper
- Yuhua Wallpaper
- Coshare
Key Developments in Commercial Wallpaper Industry
- 2022 Q4: A.S. Création launched a new line of sustainable wallpapers made from recycled materials.
- 2023 Q1: Sangetsu Co., Ltd. partnered with a leading technology firm to integrate AI into its design process.
- 2023 Q2: A significant merger between two mid-sized wallpaper manufacturers resulted in a combined market share of xx%. (Further details regarding specific merger are unavailable at this time).
Strategic Outlook for Commercial Wallpaper Market
The future of the commercial wallpaper market appears promising, with substantial growth potential driven by several factors. Continued expansion of the construction industry, increasing consumer spending, and technological innovations in sustainable and customizable products will create significant opportunities. Companies that successfully adapt to evolving consumer preferences and adopt sustainable practices will be best positioned to capitalize on these growth opportunities and achieve long-term success in this dynamic market.
Commercial Wallpaper Segmentation
-
1. Application
- 1.1. Entertainment Places
- 1.2. Office
- 1.3. Others
-
2. Types
- 2.1. Vinyl-based Wallpaper
- 2.2. Non-woven Wallpaper
- 2.3. Pure Paper Type Wallpaper
- 2.4. Fiber Type Wallpaper
- 2.5. Others
Commercial Wallpaper Segmentation By Geography
-
1. North America
- 1.1. United States
- 1.2. Canada
- 1.3. Mexico
-
2. South America
- 2.1. Brazil
- 2.2. Argentina
- 2.3. Rest of South America
-
3. Europe
- 3.1. United Kingdom
- 3.2. Germany
- 3.3. France
- 3.4. Italy
- 3.5. Spain
- 3.6. Russia
- 3.7. Benelux
- 3.8. Nordics
- 3.9. Rest of Europe
-
4. Middle East & Africa
- 4.1. Turkey
- 4.2. Israel
- 4.3. GCC
- 4.4. North Africa
- 4.5. South Africa
- 4.6. Rest of Middle East & Africa
-
5. Asia Pacific
- 5.1. China
- 5.2. India
- 5.3. Japan
- 5.4. South Korea
- 5.5. ASEAN
- 5.6. Oceania
- 5.7. Rest of Asia Pacific

Commercial Wallpaper Regional Market Share
Geographic Coverage of Commercial Wallpaper
Commercial Wallpaper REPORT HIGHLIGHTS
| Aspects | Details |
|---|---|
| Study Period | 2020-2034 |
| Base Year | 2025 |
| Estimated Year | 2026 |
| Forecast Period | 2026-2034 |
| Historical Period | 2020-2025 |
| Growth Rate | CAGR of XX% from 2020-2034 |
| Segmentation |
|
Table of Contents
- 1. Introduction
- 1.1. Research Scope
- 1.2. Market Segmentation
- 1.3. Research Objective
- 1.4. Definitions and Assumptions
- 2. Executive Summary
- 2.1. Market Snapshot
- 3. Market Dynamics
- 3.1. Market Drivers
- 3.2. Market Restrains
- 3.3. Market Trends
- 3.4. Market Opportunities
- 4. Market Factor Analysis
- 4.1. Porters Five Forces
- 4.1.1. Bargaining Power of Suppliers
- 4.1.2. Bargaining Power of Buyers
- 4.1.3. Threat of New Entrants
- 4.1.4. Threat of Substitutes
- 4.1.5. Competitive Rivalry
- 4.2. PESTEL analysis
- 4.3. BCG Analysis
- 4.3.1. Stars (High Growth, High Market Share)
- 4.3.2. Cash Cows (Low Growth, High Market Share)
- 4.3.3. Question Mark (High Growth, Low Market Share)
- 4.3.4. Dogs (Low Growth, Low Market Share)
- 4.4. Ansoff Matrix Analysis
- 4.5. Supply Chain Analysis
- 4.6. Regulatory Landscape
- 4.7. Current Market Potential and Opportunity Assessment (TAM–SAM–SOM Framework)
- 4.8. RAX Analyst Note
- 4.1. Porters Five Forces
- 5. Market Analysis, Insights and Forecast 2021-2033
- 5.1. Market Analysis, Insights and Forecast - by Application
- 5.1.1. Entertainment Places
- 5.1.2. Office
- 5.1.3. Others
- 5.2. Market Analysis, Insights and Forecast - by Types
- 5.2.1. Vinyl-based Wallpaper
- 5.2.2. Non-woven Wallpaper
- 5.2.3. Pure Paper Type Wallpaper
- 5.2.4. Fiber Type Wallpaper
- 5.2.5. Others
- 5.3. Market Analysis, Insights and Forecast - by Region
- 5.3.1. North America
- 5.3.2. South America
- 5.3.3. Europe
- 5.3.4. Middle East & Africa
- 5.3.5. Asia Pacific
- 5.1. Market Analysis, Insights and Forecast - by Application
- 6. Global Commercial Wallpaper Analysis, Insights and Forecast, 2021-2033
- 6.1. Market Analysis, Insights and Forecast - by Application
- 6.1.1. Entertainment Places
- 6.1.2. Office
- 6.1.3. Others
- 6.2. Market Analysis, Insights and Forecast - by Types
- 6.2.1. Vinyl-based Wallpaper
- 6.2.2. Non-woven Wallpaper
- 6.2.3. Pure Paper Type Wallpaper
- 6.2.4. Fiber Type Wallpaper
- 6.2.5. Others
- 6.1. Market Analysis, Insights and Forecast - by Application
- 7. North America Commercial Wallpaper Analysis, Insights and Forecast, 2020-2032
- 7.1. Market Analysis, Insights and Forecast - by Application
- 7.1.1. Entertainment Places
- 7.1.2. Office
- 7.1.3. Others
- 7.2. Market Analysis, Insights and Forecast - by Types
- 7.2.1. Vinyl-based Wallpaper
- 7.2.2. Non-woven Wallpaper
- 7.2.3. Pure Paper Type Wallpaper
- 7.2.4. Fiber Type Wallpaper
- 7.2.5. Others
- 7.1. Market Analysis, Insights and Forecast - by Application
- 8. South America Commercial Wallpaper Analysis, Insights and Forecast, 2020-2032
- 8.1. Market Analysis, Insights and Forecast - by Application
- 8.1.1. Entertainment Places
- 8.1.2. Office
- 8.1.3. Others
- 8.2. Market Analysis, Insights and Forecast - by Types
- 8.2.1. Vinyl-based Wallpaper
- 8.2.2. Non-woven Wallpaper
- 8.2.3. Pure Paper Type Wallpaper
- 8.2.4. Fiber Type Wallpaper
- 8.2.5. Others
- 8.1. Market Analysis, Insights and Forecast - by Application
- 9. Europe Commercial Wallpaper Analysis, Insights and Forecast, 2020-2032
- 9.1. Market Analysis, Insights and Forecast - by Application
- 9.1.1. Entertainment Places
- 9.1.2. Office
- 9.1.3. Others
- 9.2. Market Analysis, Insights and Forecast - by Types
- 9.2.1. Vinyl-based Wallpaper
- 9.2.2. Non-woven Wallpaper
- 9.2.3. Pure Paper Type Wallpaper
- 9.2.4. Fiber Type Wallpaper
- 9.2.5. Others
- 9.1. Market Analysis, Insights and Forecast - by Application
- 10. Middle East & Africa Commercial Wallpaper Analysis, Insights and Forecast, 2020-2032
- 10.1. Market Analysis, Insights and Forecast - by Application
- 10.1.1. Entertainment Places
- 10.1.2. Office
- 10.1.3. Others
- 10.2. Market Analysis, Insights and Forecast - by Types
- 10.2.1. Vinyl-based Wallpaper
- 10.2.2. Non-woven Wallpaper
- 10.2.3. Pure Paper Type Wallpaper
- 10.2.4. Fiber Type Wallpaper
- 10.2.5. Others
- 10.1. Market Analysis, Insights and Forecast - by Application
- 11. Asia Pacific Commercial Wallpaper Analysis, Insights and Forecast, 2020-2032
- 11.1. Market Analysis, Insights and Forecast - by Application
- 11.1.1. Entertainment Places
- 11.1.2. Office
- 11.1.3. Others
- 11.2. Market Analysis, Insights and Forecast - by Types
- 11.2.1. Vinyl-based Wallpaper
- 11.2.2. Non-woven Wallpaper
- 11.2.3. Pure Paper Type Wallpaper
- 11.2.4. Fiber Type Wallpaper
- 11.2.5. Others
- 11.1. Market Analysis, Insights and Forecast - by Application
- 12. Competitive Analysis
- 12.1. Company Profiles
- 12.1.1 Asheu
- 12.1.1.1. Company Overview
- 12.1.1.2. Products
- 12.1.1.3. Company Financials
- 12.1.1.4. SWOT Analysis
- 12.1.2 Sangetsu Co.
- 12.1.2.1. Company Overview
- 12.1.2.2. Products
- 12.1.2.3. Company Financials
- 12.1.2.4. SWOT Analysis
- 12.1.3 Ltd.
- 12.1.3.1. Company Overview
- 12.1.3.2. Products
- 12.1.3.3. Company Financials
- 12.1.3.4. SWOT Analysis
- 12.1.4 A.S. Création
- 12.1.4.1. Company Overview
- 12.1.4.2. Products
- 12.1.4.3. Company Financials
- 12.1.4.4. SWOT Analysis
- 12.1.5 York Wallpapers
- 12.1.5.1. Company Overview
- 12.1.5.2. Products
- 12.1.5.3. Company Financials
- 12.1.5.4. SWOT Analysis
- 12.1.6 Lilycolor
- 12.1.6.1. Company Overview
- 12.1.6.2. Products
- 12.1.6.3. Company Financials
- 12.1.6.4. SWOT Analysis
- 12.1.7 Marburg
- 12.1.7.1. Company Overview
- 12.1.7.2. Products
- 12.1.7.3. Company Financials
- 12.1.7.4. SWOT Analysis
- 12.1.8 Shin Han Wall Covering
- 12.1.8.1. Company Overview
- 12.1.8.2. Products
- 12.1.8.3. Company Financials
- 12.1.8.4. SWOT Analysis
- 12.1.9 Zambaiti Parati
- 12.1.9.1. Company Overview
- 12.1.9.2. Products
- 12.1.9.3. Company Financials
- 12.1.9.4. SWOT Analysis
- 12.1.10 Brewster Home Fashions
- 12.1.10.1. Company Overview
- 12.1.10.2. Products
- 12.1.10.3. Company Financials
- 12.1.10.4. SWOT Analysis
- 12.1.11 Walker Greenbank Group
- 12.1.11.1. Company Overview
- 12.1.11.2. Products
- 12.1.11.3. Company Financials
- 12.1.11.4. SWOT Analysis
- 12.1.12 LSI Wallcovering
- 12.1.12.1. Company Overview
- 12.1.12.2. Products
- 12.1.12.3. Company Financials
- 12.1.12.4. SWOT Analysis
- 12.1.13 J.Josephson
- 12.1.13.1. Company Overview
- 12.1.13.2. Products
- 12.1.13.3. Company Financials
- 12.1.13.4. SWOT Analysis
- 12.1.14 Len-Tex Corporation
- 12.1.14.1. Company Overview
- 12.1.14.2. Products
- 12.1.14.3. Company Financials
- 12.1.14.4. SWOT Analysis
- 12.1.15 Osborne&little
- 12.1.15.1. Company Overview
- 12.1.15.2. Products
- 12.1.15.3. Company Financials
- 12.1.15.4. SWOT Analysis
- 12.1.16 KOROSEAL Interior Products
- 12.1.16.1. Company Overview
- 12.1.16.2. Products
- 12.1.16.3. Company Financials
- 12.1.16.4. SWOT Analysis
- 12.1.17 Grandeco Wallfashion
- 12.1.17.1. Company Overview
- 12.1.17.2. Products
- 12.1.17.3. Company Financials
- 12.1.17.4. SWOT Analysis
- 12.1.18 F. Schumacher & Company
- 12.1.18.1. Company Overview
- 12.1.18.2. Products
- 12.1.18.3. Company Financials
- 12.1.18.4. SWOT Analysis
- 12.1.19 Laura Ashley
- 12.1.19.1. Company Overview
- 12.1.19.2. Products
- 12.1.19.3. Company Financials
- 12.1.19.4. SWOT Analysis
- 12.1.20 DAEWON CHEMICAL
- 12.1.20.1. Company Overview
- 12.1.20.2. Products
- 12.1.20.3. Company Financials
- 12.1.20.4. SWOT Analysis
- 12.1.21 Wallquest
- 12.1.21.1. Company Overview
- 12.1.21.2. Products
- 12.1.21.3. Company Financials
- 12.1.21.4. SWOT Analysis
- 12.1.22 Yulan Wallcoverings
- 12.1.22.1. Company Overview
- 12.1.22.2. Products
- 12.1.22.3. Company Financials
- 12.1.22.4. SWOT Analysis
- 12.1.23 Fidelity Wallcoverings
- 12.1.23.1. Company Overview
- 12.1.23.2. Products
- 12.1.23.3. Company Financials
- 12.1.23.4. SWOT Analysis
- 12.1.24 Roysons Corporation
- 12.1.24.1. Company Overview
- 12.1.24.2. Products
- 12.1.24.3. Company Financials
- 12.1.24.4. SWOT Analysis
- 12.1.25 Wallife
- 12.1.25.1. Company Overview
- 12.1.25.2. Products
- 12.1.25.3. Company Financials
- 12.1.25.4. SWOT Analysis
- 12.1.26 Topli
- 12.1.26.1. Company Overview
- 12.1.26.2. Products
- 12.1.26.3. Company Financials
- 12.1.26.4. SWOT Analysis
- 12.1.27 Beitai Wallpaper
- 12.1.27.1. Company Overview
- 12.1.27.2. Products
- 12.1.27.3. Company Financials
- 12.1.27.4. SWOT Analysis
- 12.1.28 Johns Manville
- 12.1.28.1. Company Overview
- 12.1.28.2. Products
- 12.1.28.3. Company Financials
- 12.1.28.4. SWOT Analysis
- 12.1.29 Artshow Wallpaper
- 12.1.29.1. Company Overview
- 12.1.29.2. Products
- 12.1.29.3. Company Financials
- 12.1.29.4. SWOT Analysis
- 12.1.30 Yuhua Wallpaper
- 12.1.30.1. Company Overview
- 12.1.30.2. Products
- 12.1.30.3. Company Financials
- 12.1.30.4. SWOT Analysis
- 12.1.31 Coshare
- 12.1.31.1. Company Overview
- 12.1.31.2. Products
- 12.1.31.3. Company Financials
- 12.1.31.4. SWOT Analysis
- 12.1.1 Asheu
- 12.2. Market Entropy
- 12.2.1 Company's Key Areas Served
- 12.2.2 Recent Developments
- 12.3. Company Market Share Analysis 2025
- 12.3.1 Top 5 Companies Market Share Analysis
- 12.3.2 Top 3 Companies Market Share Analysis
- 12.4. List of Potential Customers
- 13. Research Methodology
List of Figures
- Figure 1: Global Commercial Wallpaper Revenue Breakdown (million, %) by Region 2025 & 2033
- Figure 2: Global Commercial Wallpaper Volume Breakdown (K, %) by Region 2025 & 2033
- Figure 3: North America Commercial Wallpaper Revenue (million), by Application 2025 & 2033
- Figure 4: North America Commercial Wallpaper Volume (K), by Application 2025 & 2033
- Figure 5: North America Commercial Wallpaper Revenue Share (%), by Application 2025 & 2033
- Figure 6: North America Commercial Wallpaper Volume Share (%), by Application 2025 & 2033
- Figure 7: North America Commercial Wallpaper Revenue (million), by Types 2025 & 2033
- Figure 8: North America Commercial Wallpaper Volume (K), by Types 2025 & 2033
- Figure 9: North America Commercial Wallpaper Revenue Share (%), by Types 2025 & 2033
- Figure 10: North America Commercial Wallpaper Volume Share (%), by Types 2025 & 2033
- Figure 11: North America Commercial Wallpaper Revenue (million), by Country 2025 & 2033
- Figure 12: North America Commercial Wallpaper Volume (K), by Country 2025 & 2033
- Figure 13: North America Commercial Wallpaper Revenue Share (%), by Country 2025 & 2033
- Figure 14: North America Commercial Wallpaper Volume Share (%), by Country 2025 & 2033
- Figure 15: South America Commercial Wallpaper Revenue (million), by Application 2025 & 2033
- Figure 16: South America Commercial Wallpaper Volume (K), by Application 2025 & 2033
- Figure 17: South America Commercial Wallpaper Revenue Share (%), by Application 2025 & 2033
- Figure 18: South America Commercial Wallpaper Volume Share (%), by Application 2025 & 2033
- Figure 19: South America Commercial Wallpaper Revenue (million), by Types 2025 & 2033
- Figure 20: South America Commercial Wallpaper Volume (K), by Types 2025 & 2033
- Figure 21: South America Commercial Wallpaper Revenue Share (%), by Types 2025 & 2033
- Figure 22: South America Commercial Wallpaper Volume Share (%), by Types 2025 & 2033
- Figure 23: South America Commercial Wallpaper Revenue (million), by Country 2025 & 2033
- Figure 24: South America Commercial Wallpaper Volume (K), by Country 2025 & 2033
- Figure 25: South America Commercial Wallpaper Revenue Share (%), by Country 2025 & 2033
- Figure 26: South America Commercial Wallpaper Volume Share (%), by Country 2025 & 2033
- Figure 27: Europe Commercial Wallpaper Revenue (million), by Application 2025 & 2033
- Figure 28: Europe Commercial Wallpaper Volume (K), by Application 2025 & 2033
- Figure 29: Europe Commercial Wallpaper Revenue Share (%), by Application 2025 & 2033
- Figure 30: Europe Commercial Wallpaper Volume Share (%), by Application 2025 & 2033
- Figure 31: Europe Commercial Wallpaper Revenue (million), by Types 2025 & 2033
- Figure 32: Europe Commercial Wallpaper Volume (K), by Types 2025 & 2033
- Figure 33: Europe Commercial Wallpaper Revenue Share (%), by Types 2025 & 2033
- Figure 34: Europe Commercial Wallpaper Volume Share (%), by Types 2025 & 2033
- Figure 35: Europe Commercial Wallpaper Revenue (million), by Country 2025 & 2033
- Figure 36: Europe Commercial Wallpaper Volume (K), by Country 2025 & 2033
- Figure 37: Europe Commercial Wallpaper Revenue Share (%), by Country 2025 & 2033
- Figure 38: Europe Commercial Wallpaper Volume Share (%), by Country 2025 & 2033
- Figure 39: Middle East & Africa Commercial Wallpaper Revenue (million), by Application 2025 & 2033
- Figure 40: Middle East & Africa Commercial Wallpaper Volume (K), by Application 2025 & 2033
- Figure 41: Middle East & Africa Commercial Wallpaper Revenue Share (%), by Application 2025 & 2033
- Figure 42: Middle East & Africa Commercial Wallpaper Volume Share (%), by Application 2025 & 2033
- Figure 43: Middle East & Africa Commercial Wallpaper Revenue (million), by Types 2025 & 2033
- Figure 44: Middle East & Africa Commercial Wallpaper Volume (K), by Types 2025 & 2033
- Figure 45: Middle East & Africa Commercial Wallpaper Revenue Share (%), by Types 2025 & 2033
- Figure 46: Middle East & Africa Commercial Wallpaper Volume Share (%), by Types 2025 & 2033
- Figure 47: Middle East & Africa Commercial Wallpaper Revenue (million), by Country 2025 & 2033
- Figure 48: Middle East & Africa Commercial Wallpaper Volume (K), by Country 2025 & 2033
- Figure 49: Middle East & Africa Commercial Wallpaper Revenue Share (%), by Country 2025 & 2033
- Figure 50: Middle East & Africa Commercial Wallpaper Volume Share (%), by Country 2025 & 2033
- Figure 51: Asia Pacific Commercial Wallpaper Revenue (million), by Application 2025 & 2033
- Figure 52: Asia Pacific Commercial Wallpaper Volume (K), by Application 2025 & 2033
- Figure 53: Asia Pacific Commercial Wallpaper Revenue Share (%), by Application 2025 & 2033
- Figure 54: Asia Pacific Commercial Wallpaper Volume Share (%), by Application 2025 & 2033
- Figure 55: Asia Pacific Commercial Wallpaper Revenue (million), by Types 2025 & 2033
- Figure 56: Asia Pacific Commercial Wallpaper Volume (K), by Types 2025 & 2033
- Figure 57: Asia Pacific Commercial Wallpaper Revenue Share (%), by Types 2025 & 2033
- Figure 58: Asia Pacific Commercial Wallpaper Volume Share (%), by Types 2025 & 2033
- Figure 59: Asia Pacific Commercial Wallpaper Revenue (million), by Country 2025 & 2033
- Figure 60: Asia Pacific Commercial Wallpaper Volume (K), by Country 2025 & 2033
- Figure 61: Asia Pacific Commercial Wallpaper Revenue Share (%), by Country 2025 & 2033
- Figure 62: Asia Pacific Commercial Wallpaper Volume Share (%), by Country 2025 & 2033
List of Tables
- Table 1: Global Commercial Wallpaper Revenue million Forecast, by Application 2020 & 2033
- Table 2: Global Commercial Wallpaper Volume K Forecast, by Application 2020 & 2033
- Table 3: Global Commercial Wallpaper Revenue million Forecast, by Types 2020 & 2033
- Table 4: Global Commercial Wallpaper Volume K Forecast, by Types 2020 & 2033
- Table 5: Global Commercial Wallpaper Revenue million Forecast, by Region 2020 & 2033
- Table 6: Global Commercial Wallpaper Volume K Forecast, by Region 2020 & 2033
- Table 7: Global Commercial Wallpaper Revenue million Forecast, by Application 2020 & 2033
- Table 8: Global Commercial Wallpaper Volume K Forecast, by Application 2020 & 2033
- Table 9: Global Commercial Wallpaper Revenue million Forecast, by Types 2020 & 2033
- Table 10: Global Commercial Wallpaper Volume K Forecast, by Types 2020 & 2033
- Table 11: Global Commercial Wallpaper Revenue million Forecast, by Country 2020 & 2033
- Table 12: Global Commercial Wallpaper Volume K Forecast, by Country 2020 & 2033
- Table 13: United States Commercial Wallpaper Revenue (million) Forecast, by Application 2020 & 2033
- Table 14: United States Commercial Wallpaper Volume (K) Forecast, by Application 2020 & 2033
- Table 15: Canada Commercial Wallpaper Revenue (million) Forecast, by Application 2020 & 2033
- Table 16: Canada Commercial Wallpaper Volume (K) Forecast, by Application 2020 & 2033
- Table 17: Mexico Commercial Wallpaper Revenue (million) Forecast, by Application 2020 & 2033
- Table 18: Mexico Commercial Wallpaper Volume (K) Forecast, by Application 2020 & 2033
- Table 19: Global Commercial Wallpaper Revenue million Forecast, by Application 2020 & 2033
- Table 20: Global Commercial Wallpaper Volume K Forecast, by Application 2020 & 2033
- Table 21: Global Commercial Wallpaper Revenue million Forecast, by Types 2020 & 2033
- Table 22: Global Commercial Wallpaper Volume K Forecast, by Types 2020 & 2033
- Table 23: Global Commercial Wallpaper Revenue million Forecast, by Country 2020 & 2033
- Table 24: Global Commercial Wallpaper Volume K Forecast, by Country 2020 & 2033
- Table 25: Brazil Commercial Wallpaper Revenue (million) Forecast, by Application 2020 & 2033
- Table 26: Brazil Commercial Wallpaper Volume (K) Forecast, by Application 2020 & 2033
- Table 27: Argentina Commercial Wallpaper Revenue (million) Forecast, by Application 2020 & 2033
- Table 28: Argentina Commercial Wallpaper Volume (K) Forecast, by Application 2020 & 2033
- Table 29: Rest of South America Commercial Wallpaper Revenue (million) Forecast, by Application 2020 & 2033
- Table 30: Rest of South America Commercial Wallpaper Volume (K) Forecast, by Application 2020 & 2033
- Table 31: Global Commercial Wallpaper Revenue million Forecast, by Application 2020 & 2033
- Table 32: Global Commercial Wallpaper Volume K Forecast, by Application 2020 & 2033
- Table 33: Global Commercial Wallpaper Revenue million Forecast, by Types 2020 & 2033
- Table 34: Global Commercial Wallpaper Volume K Forecast, by Types 2020 & 2033
- Table 35: Global Commercial Wallpaper Revenue million Forecast, by Country 2020 & 2033
- Table 36: Global Commercial Wallpaper Volume K Forecast, by Country 2020 & 2033
- Table 37: United Kingdom Commercial Wallpaper Revenue (million) Forecast, by Application 2020 & 2033
- Table 38: United Kingdom Commercial Wallpaper Volume (K) Forecast, by Application 2020 & 2033
- Table 39: Germany Commercial Wallpaper Revenue (million) Forecast, by Application 2020 & 2033
- Table 40: Germany Commercial Wallpaper Volume (K) Forecast, by Application 2020 & 2033
- Table 41: France Commercial Wallpaper Revenue (million) Forecast, by Application 2020 & 2033
- Table 42: France Commercial Wallpaper Volume (K) Forecast, by Application 2020 & 2033
- Table 43: Italy Commercial Wallpaper Revenue (million) Forecast, by Application 2020 & 2033
- Table 44: Italy Commercial Wallpaper Volume (K) Forecast, by Application 2020 & 2033
- Table 45: Spain Commercial Wallpaper Revenue (million) Forecast, by Application 2020 & 2033
- Table 46: Spain Commercial Wallpaper Volume (K) Forecast, by Application 2020 & 2033
- Table 47: Russia Commercial Wallpaper Revenue (million) Forecast, by Application 2020 & 2033
- Table 48: Russia Commercial Wallpaper Volume (K) Forecast, by Application 2020 & 2033
- Table 49: Benelux Commercial Wallpaper Revenue (million) Forecast, by Application 2020 & 2033
- Table 50: Benelux Commercial Wallpaper Volume (K) Forecast, by Application 2020 & 2033
- Table 51: Nordics Commercial Wallpaper Revenue (million) Forecast, by Application 2020 & 2033
- Table 52: Nordics Commercial Wallpaper Volume (K) Forecast, by Application 2020 & 2033
- Table 53: Rest of Europe Commercial Wallpaper Revenue (million) Forecast, by Application 2020 & 2033
- Table 54: Rest of Europe Commercial Wallpaper Volume (K) Forecast, by Application 2020 & 2033
- Table 55: Global Commercial Wallpaper Revenue million Forecast, by Application 2020 & 2033
- Table 56: Global Commercial Wallpaper Volume K Forecast, by Application 2020 & 2033
- Table 57: Global Commercial Wallpaper Revenue million Forecast, by Types 2020 & 2033
- Table 58: Global Commercial Wallpaper Volume K Forecast, by Types 2020 & 2033
- Table 59: Global Commercial Wallpaper Revenue million Forecast, by Country 2020 & 2033
- Table 60: Global Commercial Wallpaper Volume K Forecast, by Country 2020 & 2033
- Table 61: Turkey Commercial Wallpaper Revenue (million) Forecast, by Application 2020 & 2033
- Table 62: Turkey Commercial Wallpaper Volume (K) Forecast, by Application 2020 & 2033
- Table 63: Israel Commercial Wallpaper Revenue (million) Forecast, by Application 2020 & 2033
- Table 64: Israel Commercial Wallpaper Volume (K) Forecast, by Application 2020 & 2033
- Table 65: GCC Commercial Wallpaper Revenue (million) Forecast, by Application 2020 & 2033
- Table 66: GCC Commercial Wallpaper Volume (K) Forecast, by Application 2020 & 2033
- Table 67: North Africa Commercial Wallpaper Revenue (million) Forecast, by Application 2020 & 2033
- Table 68: North Africa Commercial Wallpaper Volume (K) Forecast, by Application 2020 & 2033
- Table 69: South Africa Commercial Wallpaper Revenue (million) Forecast, by Application 2020 & 2033
- Table 70: South Africa Commercial Wallpaper Volume (K) Forecast, by Application 2020 & 2033
- Table 71: Rest of Middle East & Africa Commercial Wallpaper Revenue (million) Forecast, by Application 2020 & 2033
- Table 72: Rest of Middle East & Africa Commercial Wallpaper Volume (K) Forecast, by Application 2020 & 2033
- Table 73: Global Commercial Wallpaper Revenue million Forecast, by Application 2020 & 2033
- Table 74: Global Commercial Wallpaper Volume K Forecast, by Application 2020 & 2033
- Table 75: Global Commercial Wallpaper Revenue million Forecast, by Types 2020 & 2033
- Table 76: Global Commercial Wallpaper Volume K Forecast, by Types 2020 & 2033
- Table 77: Global Commercial Wallpaper Revenue million Forecast, by Country 2020 & 2033
- Table 78: Global Commercial Wallpaper Volume K Forecast, by Country 2020 & 2033
- Table 79: China Commercial Wallpaper Revenue (million) Forecast, by Application 2020 & 2033
- Table 80: China Commercial Wallpaper Volume (K) Forecast, by Application 2020 & 2033
- Table 81: India Commercial Wallpaper Revenue (million) Forecast, by Application 2020 & 2033
- Table 82: India Commercial Wallpaper Volume (K) Forecast, by Application 2020 & 2033
- Table 83: Japan Commercial Wallpaper Revenue (million) Forecast, by Application 2020 & 2033
- Table 84: Japan Commercial Wallpaper Volume (K) Forecast, by Application 2020 & 2033
- Table 85: South Korea Commercial Wallpaper Revenue (million) Forecast, by Application 2020 & 2033
- Table 86: South Korea Commercial Wallpaper Volume (K) Forecast, by Application 2020 & 2033
- Table 87: ASEAN Commercial Wallpaper Revenue (million) Forecast, by Application 2020 & 2033
- Table 88: ASEAN Commercial Wallpaper Volume (K) Forecast, by Application 2020 & 2033
- Table 89: Oceania Commercial Wallpaper Revenue (million) Forecast, by Application 2020 & 2033
- Table 90: Oceania Commercial Wallpaper Volume (K) Forecast, by Application 2020 & 2033
- Table 91: Rest of Asia Pacific Commercial Wallpaper Revenue (million) Forecast, by Application 2020 & 2033
- Table 92: Rest of Asia Pacific Commercial Wallpaper Volume (K) Forecast, by Application 2020 & 2033
Frequently Asked Questions
1. What is the projected Compound Annual Growth Rate (CAGR) of the Commercial Wallpaper?
The projected CAGR is approximately XX%.
2. Which companies are prominent players in the Commercial Wallpaper?
Key companies in the market include Asheu, Sangetsu Co., Ltd., A.S. Création, York Wallpapers, Lilycolor, Marburg, Shin Han Wall Covering, Zambaiti Parati, Brewster Home Fashions, Walker Greenbank Group, LSI Wallcovering, J.Josephson, Len-Tex Corporation, Osborne&little, KOROSEAL Interior Products, Grandeco Wallfashion, F. Schumacher & Company, Laura Ashley, DAEWON CHEMICAL, Wallquest, Yulan Wallcoverings, Fidelity Wallcoverings, Roysons Corporation, Wallife, Topli, Beitai Wallpaper, Johns Manville, Artshow Wallpaper, Yuhua Wallpaper, Coshare.
3. What are the main segments of the Commercial Wallpaper?
The market segments include Application, Types.
4. Can you provide details about the market size?
The market size is estimated to be USD XXX million as of 2022.
5. What are some drivers contributing to market growth?
N/A
6. What are the notable trends driving market growth?
N/A
7. Are there any restraints impacting market growth?
N/A
8. Can you provide examples of recent developments in the market?
N/A
9. What pricing options are available for accessing the report?
Pricing options include single-user, multi-user, and enterprise licenses priced at USD 4350.00, USD 6525.00, and USD 8700.00 respectively.
10. Is the market size provided in terms of value or volume?
The market size is provided in terms of value, measured in million and volume, measured in K.
11. Are there any specific market keywords associated with the report?
Yes, the market keyword associated with the report is "Commercial Wallpaper," which aids in identifying and referencing the specific market segment covered.
12. How do I determine which pricing option suits my needs best?
The pricing options vary based on user requirements and access needs. Individual users may opt for single-user licenses, while businesses requiring broader access may choose multi-user or enterprise licenses for cost-effective access to the report.
13. Are there any additional resources or data provided in the Commercial Wallpaper report?
While the report offers comprehensive insights, it's advisable to review the specific contents or supplementary materials provided to ascertain if additional resources or data are available.
14. How can I stay updated on further developments or reports in the Commercial Wallpaper?
To stay informed about further developments, trends, and reports in the Commercial Wallpaper, consider subscribing to industry newsletters, following relevant companies and organizations, or regularly checking reputable industry news sources and publications.
Methodology
Step 1 - Identification of Relevant Samples Size from Population Database


Step 2 - Approaches for Defining Global Market Size (Value, Volume* & Price*)

Note*: In applicable scenarios
Step 3 - Data Sources
Primary Research
- Web Analytics
- Survey Reports
- Research Institute
- Latest Research Reports
- Opinion Leaders
Secondary Research
- Annual Reports
- White Paper
- Latest Press Release
- Industry Association
- Paid Database
- Investor Presentations

Step 4 - Data Triangulation
Involves using different sources of information in order to increase the validity of a study
These sources are likely to be stakeholders in a program - participants, other researchers, program staff, other community members, and so on.
Then we put all data in single framework & apply various statistical tools to find out the dynamic on the market.
During the analysis stage, feedback from the stakeholder groups would be compared to determine areas of agreement as well as areas of divergence