
Key Insights
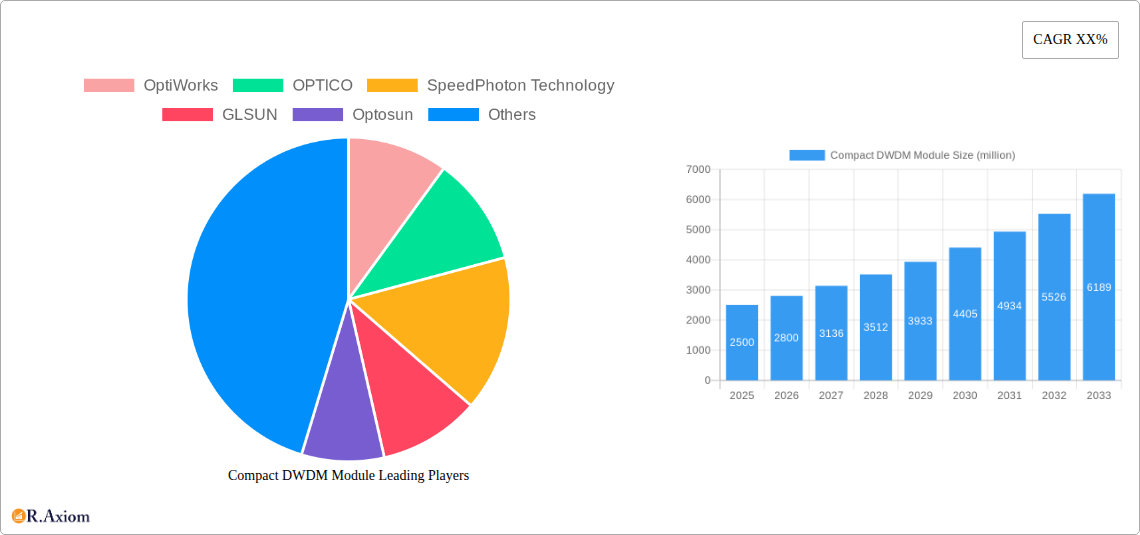
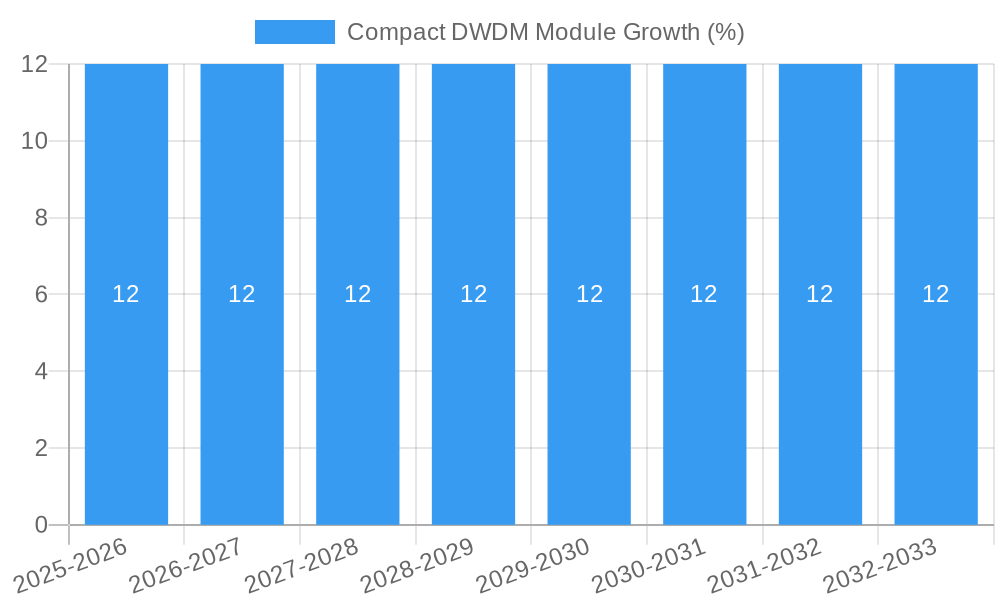
The global Compact DWDM Module market is poised for substantial growth, driven by the escalating demand for high-speed data transmission and the increasing deployment of advanced telecommunications infrastructure. With an estimated market size of approximately $2,500 million in 2025, the sector is projected to expand at a Compound Annual Growth Rate (CAGR) of around 12% through 2033. This robust growth is largely fueled by the insatiable appetite for bandwidth in data centers, the ongoing upgrades within enterprise networks, and the continuous evolution of telecommunications services. The need for efficient wavelength multiplexing solutions to maximize fiber optic capacity is a paramount driver, enabling service providers to deliver faster speeds and support a growing array of data-intensive applications like cloud computing, 5G deployment, and high-definition streaming.
Key applications dominating the market landscape include Telecommunications and Data Centers, which together are expected to account for a significant share of the demand for Compact DWDM Modules. Enterprise Networks also represent a crucial segment, as businesses increasingly invest in upgrading their internal network infrastructure to support digital transformation initiatives. The market is characterized by a diverse range of product types, including 4, 8, and 16-channel modules, catering to varied deployment needs. While the market benefits from strong growth drivers, potential restraints could emerge from intense price competition among a growing number of players and the need for continuous technological innovation to stay ahead of evolving industry standards. Nonetheless, the overarching trend towards increased data consumption and the necessity for more efficient network solutions strongly position the Compact DWDM Module market for sustained expansion.
This in-depth report provides a detailed examination of the global Compact DWDM Module market, offering critical insights for industry stakeholders. The study covers the Study Period of 2019–2033, with a Base Year and Estimated Year of 2025, and a comprehensive Forecast Period from 2025–2033, building upon Historical Period data from 2019–2024. We delve into market concentration, technological innovations, regulatory landscapes, competitive dynamics, emerging opportunities, and strategic outlooks, all crucial for navigating the evolving telecommunications, data center, and enterprise network sectors.
Compact DWDM Module Market Concentration & Innovation
The Compact DWDM Module market exhibits a moderate level of concentration, with several key players like OptiWorks, OPTICO, SpeedPhoton Technology, GLSUN, Optosun, GAOTek, Flyin Group, Gracyfiber, OPELINK, Gezhi Photonics, VIAVI Solutions, and Hilink actively competing. Innovation is a primary driver, fueled by the ever-increasing demand for higher bandwidth and more efficient fiber optic networking solutions. Companies are investing heavily in R&D to develop smaller, more power-efficient, and cost-effective DWDM modules. Regulatory frameworks, particularly those promoting network infrastructure upgrades and 5G deployment, positively influence market growth. Potential product substitutes exist in the form of integrated optical transceivers and advanced switching technologies, though compact DWDM modules maintain a strong foothold due to their specific advantages in spectral efficiency and flexibility. End-user trends lean towards miniaturization, lower power consumption, and pluggable form factors. Mergers and acquisitions (M&A) are anticipated to play a significant role in shaping market concentration, with estimated M&A deal values projected to reach several million over the forecast period as larger entities seek to consolidate their market position and acquire innovative technologies.
Compact DWDM Module Industry Trends & Insights
The Compact DWDM Module industry is poised for substantial growth, driven by the insatiable global demand for data. The exponential rise in internet traffic, cloud computing adoption, and the rollout of 5G networks are key market growth drivers, creating a constant need for increased network capacity. Technological disruptions, such as advancements in semiconductor manufacturing, integrated photonics, and signal processing, are enabling the development of smaller, more powerful, and energy-efficient compact DWDM modules. Consumer preferences are shifting towards solutions that offer greater flexibility, lower latency, and enhanced reliability, directly benefiting DWDM technology. The competitive dynamics are characterized by intense price competition, continuous product innovation, and strategic partnerships aimed at expanding market reach and technological capabilities. The Compound Annual Growth Rate (CAGR) for the compact DWDM module market is projected to be robust, estimated at approximately xx% over the forecast period. Market penetration of compact DWDM modules in emerging economies is expected to surge as they upgrade their network infrastructure.
Dominant Markets & Segments in Compact DWDM Module
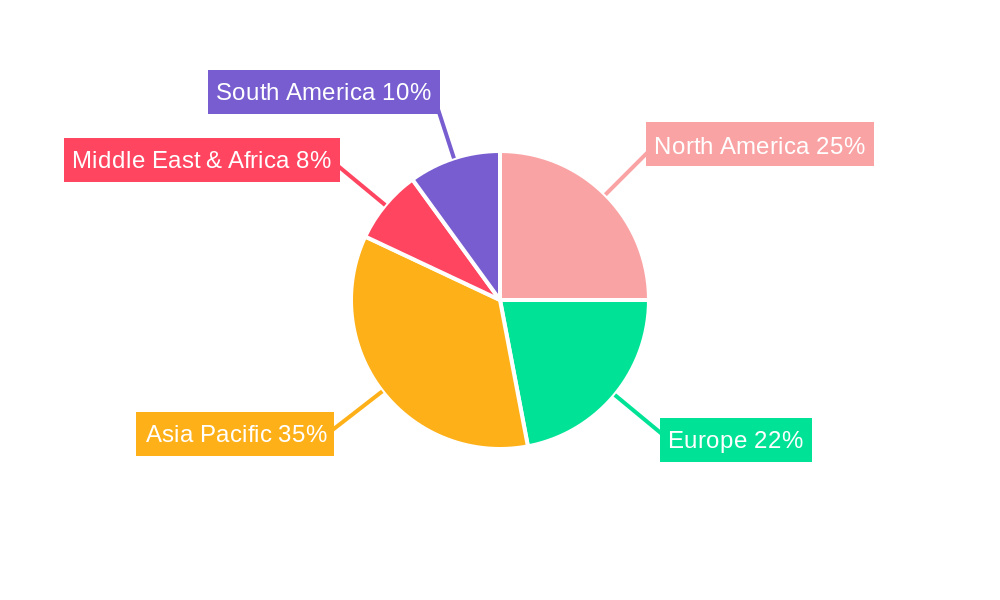
The Telecommunications segment, particularly within the Asia-Pacific region, is expected to dominate the Compact DWDM Module market. This dominance is fueled by significant investments in fiber optic infrastructure, the rapid expansion of 5G networks, and the growing demand for high-speed broadband services in countries like China and India. Government initiatives promoting digital transformation and smart city development further bolster this trend.
Telecommunications:
- Key Drivers: Aggressive 5G deployment, expansion of FTTx (Fiber to the x) networks, increasing demand for high-speed internet, and government investments in digital infrastructure.
- Dominance Analysis: Telecom operators are the primary consumers, requiring scalable and efficient solutions to manage growing bandwidth demands. The need for denser wavelength deployment in metropolitan and long-haul networks makes compact DWDM modules indispensable.
Data Centers:
- Key Drivers: Proliferation of cloud services, increasing data volumes, need for inter-data center connectivity, and the demand for high-density, low-power solutions.
- Dominance Analysis: Data centers require robust and scalable solutions for network aggregation and backbone connectivity. Compact DWDM modules offer the flexibility and capacity needed to accommodate the ever-growing data traffic within and between data center facilities.
Enterprise Networks:
- Key Drivers: Growing need for inter-building connectivity, increased adoption of private cloud solutions, and the demand for high-capacity data transmission in large enterprises.
- Dominance Analysis: Enterprises are increasingly deploying DWDM solutions to upgrade their internal networks, improve bandwidth for critical applications, and ensure business continuity. The compact nature of these modules is advantageous for deployment in space-constrained enterprise environments.
Types:
- 16 Channels and 18 Channels: These configurations are expected to witness significant demand due to their optimal balance of capacity and form factor for many applications.
- 8 Channels: Continues to be a popular choice for mid-range applications and network segmentation.
- 4 Channels: Remains relevant for niche applications and smaller network deployments.
Compact DWDM Module Product Developments
Recent product developments in the Compact DWDM Module market are characterized by a strong focus on miniaturization, enhanced spectral efficiency, and increased integration. Innovations are leading to modules that are not only smaller in size but also consume less power, making them ideal for space-constrained environments like telecom equipment and data center racks. Companies are actively developing pluggable DWDM modules that simplify deployment and reduce operational costs. Competitive advantages are being realized through improved thermal management, higher wavelength counts within a single module, and enhanced performance metrics such as lower insertion loss and better signal integrity. These advancements are directly addressing the evolving needs of telecommunications, data centers, and enterprise networks.
Report Scope & Segmentation Analysis
This report meticulously analyzes the Compact DWDM Module market across various segmentations.
Application: The market is segmented into Telecommunications, Data Centers, Enterprise Networks, and Others. Each segment is projected to experience growth, with Telecommunications and Data Centers anticipated to lead in terms of market size and growth rate due to sustained infrastructure investments and escalating data demands.
Types: The report further segments the market by 4 Channels, 8 Channels, 16 Channels, 18 Channels, and Others. The 16 Channels and 18 Channels segments are expected to demonstrate the highest growth trajectory, reflecting the industry's drive towards higher density and capacity solutions. The competitive dynamics within each type segment are shaped by technological advancements and pricing strategies.
Key Drivers of Compact DWDM Module Growth
The Compact DWDM Module market is propelled by several critical growth drivers. The relentless expansion of data traffic fueled by video streaming, cloud computing, and IoT devices is a primary catalyst. The global rollout of 5G networks necessitates significant upgrades to backhaul and fronthaul infrastructure, creating substantial demand for high-capacity DWDM solutions. Investments in fiber optic infrastructure by governments and telecom operators worldwide, aiming to bridge the digital divide and enhance broadband access, are also critical. Furthermore, the increasing adoption of cloud data centers and the growing need for efficient inter-data center connectivity contribute significantly to market expansion. The trend towards network virtualization and software-defined networking (SDN) also favors the deployment of flexible and scalable DWDM modules.
Challenges in the Compact DWDM Module Sector
Despite the strong growth outlook, the Compact DWDM Module sector faces several challenges. High manufacturing costs associated with advanced optical components and complex integration processes can impact profitability. Intense price competition among numerous players can lead to margin erosion. Supply chain disruptions, exacerbated by geopolitical events and material shortages, pose a significant risk to production and delivery schedules. Rapid technological obsolescence requires continuous investment in R&D to stay competitive. Regulatory hurdles in certain regions related to network standards and spectrum allocation can also present barriers to market entry and expansion.
Emerging Opportunities in Compact DWDM Module
The Compact DWDM Module market is ripe with emerging opportunities. The increasing demand for coherent DWDM solutions for longer reach and higher data rates presents a significant growth avenue. The expansion of edge computing infrastructure requires compact and power-efficient optical solutions, creating new application areas for DWDM modules. The growing trend of network disaggregation and the adoption of open networking principles could lead to increased demand for interoperable DWDM components. Furthermore, the potential for AI-driven network optimization and the integration of DWDM modules with advanced network management systems offer exciting future prospects. The development of tunable DWDM lasers and silicon photonics integration promises further advancements in performance and cost-effectiveness.
Leading Players in the Compact DWDM Module Market
- OptiWorks
- OPTICO
- SpeedPhoton Technology
- GLSUN
- Optosun
- GAOTek
- Flyin Group
- Gracyfiber
- OPELINK
- Gezhi Photonics
- VIAVI Solutions
- Hilink
Key Developments in Compact DWDM Module Industry
- 2023 October: Launch of new ultra-compact 16-channel DWDM modules with reduced power consumption by OptiWorks, targeting edge data center applications.
- 2023 September: OPTICO announces strategic partnerships to expand its distribution network for compact DWDM solutions in emerging markets.
- 2023 July: SpeedPhoton Technology unveils a new generation of pluggable DWDM transceivers with improved thermal management, enhancing reliability in high-density deployments.
- 2023 April: GLSUN reports significant growth in its compact DWDM module sales, driven by increasing demand from telecommunications operators for network upgrades.
- 2022 December: VIAVI Solutions introduces advanced testing solutions specifically designed for the validation of compact DWDM modules, supporting product development and quality assurance.
Strategic Outlook for Compact DWDM Module Market
The strategic outlook for the Compact DWDM Module market remains highly positive, driven by ongoing technological advancements and the persistent growth in data consumption. The market is expected to witness continued innovation in miniaturization, power efficiency, and spectral density. Companies that can effectively leverage 5G deployment, the expansion of cloud infrastructure, and the increasing demand for high-speed enterprise networks will be well-positioned for success. Strategic collaborations and acquisitions will likely play a crucial role in consolidating market share and driving innovation. The focus on developing cost-effective, pluggable, and highly integrated DWDM solutions will be paramount in capturing market opportunities and meeting the evolving needs of the global telecommunications and data infrastructure landscape.
Compact DWDM Module Segmentation
-
1. Application
- 1.1. Telecommunications
- 1.2. Data Centers
- 1.3. Enterprise Networks
- 1.4. Others
-
2. Types
- 2.1. 4 Channels
- 2.2. 8 Channels
- 2.3. 16 Channels
- 2.4. 18 Channels
- 2.5. Others
Compact DWDM Module Segmentation By Geography
-
1. North America
- 1.1. United States
- 1.2. Canada
- 1.3. Mexico
-
2. South America
- 2.1. Brazil
- 2.2. Argentina
- 2.3. Rest of South America
-
3. Europe
- 3.1. United Kingdom
- 3.2. Germany
- 3.3. France
- 3.4. Italy
- 3.5. Spain
- 3.6. Russia
- 3.7. Benelux
- 3.8. Nordics
- 3.9. Rest of Europe
-
4. Middle East & Africa
- 4.1. Turkey
- 4.2. Israel
- 4.3. GCC
- 4.4. North Africa
- 4.5. South Africa
- 4.6. Rest of Middle East & Africa
-
5. Asia Pacific
- 5.1. China
- 5.2. India
- 5.3. Japan
- 5.4. South Korea
- 5.5. ASEAN
- 5.6. Oceania
- 5.7. Rest of Asia Pacific
Compact DWDM Module REPORT HIGHLIGHTS
| Aspects | Details |
|---|---|
| Study Period | 2019-2033 |
| Base Year | 2024 |
| Estimated Year | 2025 |
| Forecast Period | 2025-2033 |
| Historical Period | 2019-2024 |
| Growth Rate | CAGR of XX% from 2019-2033 |
| Segmentation |
|
Table of Contents
- 1. Introduction
- 1.1. Research Scope
- 1.2. Market Segmentation
- 1.3. Research Methodology
- 1.4. Definitions and Assumptions
- 2. Executive Summary
- 2.1. Introduction
- 3. Market Dynamics
- 3.1. Introduction
- 3.2. Market Drivers
- 3.3. Market Restrains
- 3.4. Market Trends
- 4. Market Factor Analysis
- 4.1. Porters Five Forces
- 4.2. Supply/Value Chain
- 4.3. PESTEL analysis
- 4.4. Market Entropy
- 4.5. Patent/Trademark Analysis
- 5. Global Compact DWDM Module Analysis, Insights and Forecast, 2019-2031
- 5.1. Market Analysis, Insights and Forecast - by Application
- 5.1.1. Telecommunications
- 5.1.2. Data Centers
- 5.1.3. Enterprise Networks
- 5.1.4. Others
- 5.2. Market Analysis, Insights and Forecast - by Types
- 5.2.1. 4 Channels
- 5.2.2. 8 Channels
- 5.2.3. 16 Channels
- 5.2.4. 18 Channels
- 5.2.5. Others
- 5.3. Market Analysis, Insights and Forecast - by Region
- 5.3.1. North America
- 5.3.2. South America
- 5.3.3. Europe
- 5.3.4. Middle East & Africa
- 5.3.5. Asia Pacific
- 5.1. Market Analysis, Insights and Forecast - by Application
- 6. North America Compact DWDM Module Analysis, Insights and Forecast, 2019-2031
- 6.1. Market Analysis, Insights and Forecast - by Application
- 6.1.1. Telecommunications
- 6.1.2. Data Centers
- 6.1.3. Enterprise Networks
- 6.1.4. Others
- 6.2. Market Analysis, Insights and Forecast - by Types
- 6.2.1. 4 Channels
- 6.2.2. 8 Channels
- 6.2.3. 16 Channels
- 6.2.4. 18 Channels
- 6.2.5. Others
- 6.1. Market Analysis, Insights and Forecast - by Application
- 7. South America Compact DWDM Module Analysis, Insights and Forecast, 2019-2031
- 7.1. Market Analysis, Insights and Forecast - by Application
- 7.1.1. Telecommunications
- 7.1.2. Data Centers
- 7.1.3. Enterprise Networks
- 7.1.4. Others
- 7.2. Market Analysis, Insights and Forecast - by Types
- 7.2.1. 4 Channels
- 7.2.2. 8 Channels
- 7.2.3. 16 Channels
- 7.2.4. 18 Channels
- 7.2.5. Others
- 7.1. Market Analysis, Insights and Forecast - by Application
- 8. Europe Compact DWDM Module Analysis, Insights and Forecast, 2019-2031
- 8.1. Market Analysis, Insights and Forecast - by Application
- 8.1.1. Telecommunications
- 8.1.2. Data Centers
- 8.1.3. Enterprise Networks
- 8.1.4. Others
- 8.2. Market Analysis, Insights and Forecast - by Types
- 8.2.1. 4 Channels
- 8.2.2. 8 Channels
- 8.2.3. 16 Channels
- 8.2.4. 18 Channels
- 8.2.5. Others
- 8.1. Market Analysis, Insights and Forecast - by Application
- 9. Middle East & Africa Compact DWDM Module Analysis, Insights and Forecast, 2019-2031
- 9.1. Market Analysis, Insights and Forecast - by Application
- 9.1.1. Telecommunications
- 9.1.2. Data Centers
- 9.1.3. Enterprise Networks
- 9.1.4. Others
- 9.2. Market Analysis, Insights and Forecast - by Types
- 9.2.1. 4 Channels
- 9.2.2. 8 Channels
- 9.2.3. 16 Channels
- 9.2.4. 18 Channels
- 9.2.5. Others
- 9.1. Market Analysis, Insights and Forecast - by Application
- 10. Asia Pacific Compact DWDM Module Analysis, Insights and Forecast, 2019-2031
- 10.1. Market Analysis, Insights and Forecast - by Application
- 10.1.1. Telecommunications
- 10.1.2. Data Centers
- 10.1.3. Enterprise Networks
- 10.1.4. Others
- 10.2. Market Analysis, Insights and Forecast - by Types
- 10.2.1. 4 Channels
- 10.2.2. 8 Channels
- 10.2.3. 16 Channels
- 10.2.4. 18 Channels
- 10.2.5. Others
- 10.1. Market Analysis, Insights and Forecast - by Application
- 11. Competitive Analysis
- 11.1. Global Market Share Analysis 2024
- 11.2. Company Profiles
- 11.2.1 OptiWorks
- 11.2.1.1. Overview
- 11.2.1.2. Products
- 11.2.1.3. SWOT Analysis
- 11.2.1.4. Recent Developments
- 11.2.1.5. Financials (Based on Availability)
- 11.2.2 OPTICO
- 11.2.2.1. Overview
- 11.2.2.2. Products
- 11.2.2.3. SWOT Analysis
- 11.2.2.4. Recent Developments
- 11.2.2.5. Financials (Based on Availability)
- 11.2.3 SpeedPhoton Technology
- 11.2.3.1. Overview
- 11.2.3.2. Products
- 11.2.3.3. SWOT Analysis
- 11.2.3.4. Recent Developments
- 11.2.3.5. Financials (Based on Availability)
- 11.2.4 GLSUN
- 11.2.4.1. Overview
- 11.2.4.2. Products
- 11.2.4.3. SWOT Analysis
- 11.2.4.4. Recent Developments
- 11.2.4.5. Financials (Based on Availability)
- 11.2.5 Optosun
- 11.2.5.1. Overview
- 11.2.5.2. Products
- 11.2.5.3. SWOT Analysis
- 11.2.5.4. Recent Developments
- 11.2.5.5. Financials (Based on Availability)
- 11.2.6 GAOTek
- 11.2.6.1. Overview
- 11.2.6.2. Products
- 11.2.6.3. SWOT Analysis
- 11.2.6.4. Recent Developments
- 11.2.6.5. Financials (Based on Availability)
- 11.2.7 Flyin Group
- 11.2.7.1. Overview
- 11.2.7.2. Products
- 11.2.7.3. SWOT Analysis
- 11.2.7.4. Recent Developments
- 11.2.7.5. Financials (Based on Availability)
- 11.2.8 Gracyfiber
- 11.2.8.1. Overview
- 11.2.8.2. Products
- 11.2.8.3. SWOT Analysis
- 11.2.8.4. Recent Developments
- 11.2.8.5. Financials (Based on Availability)
- 11.2.9 OPELINK
- 11.2.9.1. Overview
- 11.2.9.2. Products
- 11.2.9.3. SWOT Analysis
- 11.2.9.4. Recent Developments
- 11.2.9.5. Financials (Based on Availability)
- 11.2.10 Gezhi Photonics
- 11.2.10.1. Overview
- 11.2.10.2. Products
- 11.2.10.3. SWOT Analysis
- 11.2.10.4. Recent Developments
- 11.2.10.5. Financials (Based on Availability)
- 11.2.11 VIAVI Solutions
- 11.2.11.1. Overview
- 11.2.11.2. Products
- 11.2.11.3. SWOT Analysis
- 11.2.11.4. Recent Developments
- 11.2.11.5. Financials (Based on Availability)
- 11.2.12 Hilink
- 11.2.12.1. Overview
- 11.2.12.2. Products
- 11.2.12.3. SWOT Analysis
- 11.2.12.4. Recent Developments
- 11.2.12.5. Financials (Based on Availability)
- 11.2.1 OptiWorks
List of Figures
- Figure 1: Global Compact DWDM Module Revenue Breakdown (million, %) by Region 2024 & 2032
- Figure 2: Global Compact DWDM Module Volume Breakdown (K, %) by Region 2024 & 2032
- Figure 3: North America Compact DWDM Module Revenue (million), by Application 2024 & 2032
- Figure 4: North America Compact DWDM Module Volume (K), by Application 2024 & 2032
- Figure 5: North America Compact DWDM Module Revenue Share (%), by Application 2024 & 2032
- Figure 6: North America Compact DWDM Module Volume Share (%), by Application 2024 & 2032
- Figure 7: North America Compact DWDM Module Revenue (million), by Types 2024 & 2032
- Figure 8: North America Compact DWDM Module Volume (K), by Types 2024 & 2032
- Figure 9: North America Compact DWDM Module Revenue Share (%), by Types 2024 & 2032
- Figure 10: North America Compact DWDM Module Volume Share (%), by Types 2024 & 2032
- Figure 11: North America Compact DWDM Module Revenue (million), by Country 2024 & 2032
- Figure 12: North America Compact DWDM Module Volume (K), by Country 2024 & 2032
- Figure 13: North America Compact DWDM Module Revenue Share (%), by Country 2024 & 2032
- Figure 14: North America Compact DWDM Module Volume Share (%), by Country 2024 & 2032
- Figure 15: South America Compact DWDM Module Revenue (million), by Application 2024 & 2032
- Figure 16: South America Compact DWDM Module Volume (K), by Application 2024 & 2032
- Figure 17: South America Compact DWDM Module Revenue Share (%), by Application 2024 & 2032
- Figure 18: South America Compact DWDM Module Volume Share (%), by Application 2024 & 2032
- Figure 19: South America Compact DWDM Module Revenue (million), by Types 2024 & 2032
- Figure 20: South America Compact DWDM Module Volume (K), by Types 2024 & 2032
- Figure 21: South America Compact DWDM Module Revenue Share (%), by Types 2024 & 2032
- Figure 22: South America Compact DWDM Module Volume Share (%), by Types 2024 & 2032
- Figure 23: South America Compact DWDM Module Revenue (million), by Country 2024 & 2032
- Figure 24: South America Compact DWDM Module Volume (K), by Country 2024 & 2032
- Figure 25: South America Compact DWDM Module Revenue Share (%), by Country 2024 & 2032
- Figure 26: South America Compact DWDM Module Volume Share (%), by Country 2024 & 2032
- Figure 27: Europe Compact DWDM Module Revenue (million), by Application 2024 & 2032
- Figure 28: Europe Compact DWDM Module Volume (K), by Application 2024 & 2032
- Figure 29: Europe Compact DWDM Module Revenue Share (%), by Application 2024 & 2032
- Figure 30: Europe Compact DWDM Module Volume Share (%), by Application 2024 & 2032
- Figure 31: Europe Compact DWDM Module Revenue (million), by Types 2024 & 2032
- Figure 32: Europe Compact DWDM Module Volume (K), by Types 2024 & 2032
- Figure 33: Europe Compact DWDM Module Revenue Share (%), by Types 2024 & 2032
- Figure 34: Europe Compact DWDM Module Volume Share (%), by Types 2024 & 2032
- Figure 35: Europe Compact DWDM Module Revenue (million), by Country 2024 & 2032
- Figure 36: Europe Compact DWDM Module Volume (K), by Country 2024 & 2032
- Figure 37: Europe Compact DWDM Module Revenue Share (%), by Country 2024 & 2032
- Figure 38: Europe Compact DWDM Module Volume Share (%), by Country 2024 & 2032
- Figure 39: Middle East & Africa Compact DWDM Module Revenue (million), by Application 2024 & 2032
- Figure 40: Middle East & Africa Compact DWDM Module Volume (K), by Application 2024 & 2032
- Figure 41: Middle East & Africa Compact DWDM Module Revenue Share (%), by Application 2024 & 2032
- Figure 42: Middle East & Africa Compact DWDM Module Volume Share (%), by Application 2024 & 2032
- Figure 43: Middle East & Africa Compact DWDM Module Revenue (million), by Types 2024 & 2032
- Figure 44: Middle East & Africa Compact DWDM Module Volume (K), by Types 2024 & 2032
- Figure 45: Middle East & Africa Compact DWDM Module Revenue Share (%), by Types 2024 & 2032
- Figure 46: Middle East & Africa Compact DWDM Module Volume Share (%), by Types 2024 & 2032
- Figure 47: Middle East & Africa Compact DWDM Module Revenue (million), by Country 2024 & 2032
- Figure 48: Middle East & Africa Compact DWDM Module Volume (K), by Country 2024 & 2032
- Figure 49: Middle East & Africa Compact DWDM Module Revenue Share (%), by Country 2024 & 2032
- Figure 50: Middle East & Africa Compact DWDM Module Volume Share (%), by Country 2024 & 2032
- Figure 51: Asia Pacific Compact DWDM Module Revenue (million), by Application 2024 & 2032
- Figure 52: Asia Pacific Compact DWDM Module Volume (K), by Application 2024 & 2032
- Figure 53: Asia Pacific Compact DWDM Module Revenue Share (%), by Application 2024 & 2032
- Figure 54: Asia Pacific Compact DWDM Module Volume Share (%), by Application 2024 & 2032
- Figure 55: Asia Pacific Compact DWDM Module Revenue (million), by Types 2024 & 2032
- Figure 56: Asia Pacific Compact DWDM Module Volume (K), by Types 2024 & 2032
- Figure 57: Asia Pacific Compact DWDM Module Revenue Share (%), by Types 2024 & 2032
- Figure 58: Asia Pacific Compact DWDM Module Volume Share (%), by Types 2024 & 2032
- Figure 59: Asia Pacific Compact DWDM Module Revenue (million), by Country 2024 & 2032
- Figure 60: Asia Pacific Compact DWDM Module Volume (K), by Country 2024 & 2032
- Figure 61: Asia Pacific Compact DWDM Module Revenue Share (%), by Country 2024 & 2032
- Figure 62: Asia Pacific Compact DWDM Module Volume Share (%), by Country 2024 & 2032
List of Tables
- Table 1: Global Compact DWDM Module Revenue million Forecast, by Region 2019 & 2032
- Table 2: Global Compact DWDM Module Volume K Forecast, by Region 2019 & 2032
- Table 3: Global Compact DWDM Module Revenue million Forecast, by Application 2019 & 2032
- Table 4: Global Compact DWDM Module Volume K Forecast, by Application 2019 & 2032
- Table 5: Global Compact DWDM Module Revenue million Forecast, by Types 2019 & 2032
- Table 6: Global Compact DWDM Module Volume K Forecast, by Types 2019 & 2032
- Table 7: Global Compact DWDM Module Revenue million Forecast, by Region 2019 & 2032
- Table 8: Global Compact DWDM Module Volume K Forecast, by Region 2019 & 2032
- Table 9: Global Compact DWDM Module Revenue million Forecast, by Application 2019 & 2032
- Table 10: Global Compact DWDM Module Volume K Forecast, by Application 2019 & 2032
- Table 11: Global Compact DWDM Module Revenue million Forecast, by Types 2019 & 2032
- Table 12: Global Compact DWDM Module Volume K Forecast, by Types 2019 & 2032
- Table 13: Global Compact DWDM Module Revenue million Forecast, by Country 2019 & 2032
- Table 14: Global Compact DWDM Module Volume K Forecast, by Country 2019 & 2032
- Table 15: United States Compact DWDM Module Revenue (million) Forecast, by Application 2019 & 2032
- Table 16: United States Compact DWDM Module Volume (K) Forecast, by Application 2019 & 2032
- Table 17: Canada Compact DWDM Module Revenue (million) Forecast, by Application 2019 & 2032
- Table 18: Canada Compact DWDM Module Volume (K) Forecast, by Application 2019 & 2032
- Table 19: Mexico Compact DWDM Module Revenue (million) Forecast, by Application 2019 & 2032
- Table 20: Mexico Compact DWDM Module Volume (K) Forecast, by Application 2019 & 2032
- Table 21: Global Compact DWDM Module Revenue million Forecast, by Application 2019 & 2032
- Table 22: Global Compact DWDM Module Volume K Forecast, by Application 2019 & 2032
- Table 23: Global Compact DWDM Module Revenue million Forecast, by Types 2019 & 2032
- Table 24: Global Compact DWDM Module Volume K Forecast, by Types 2019 & 2032
- Table 25: Global Compact DWDM Module Revenue million Forecast, by Country 2019 & 2032
- Table 26: Global Compact DWDM Module Volume K Forecast, by Country 2019 & 2032
- Table 27: Brazil Compact DWDM Module Revenue (million) Forecast, by Application 2019 & 2032
- Table 28: Brazil Compact DWDM Module Volume (K) Forecast, by Application 2019 & 2032
- Table 29: Argentina Compact DWDM Module Revenue (million) Forecast, by Application 2019 & 2032
- Table 30: Argentina Compact DWDM Module Volume (K) Forecast, by Application 2019 & 2032
- Table 31: Rest of South America Compact DWDM Module Revenue (million) Forecast, by Application 2019 & 2032
- Table 32: Rest of South America Compact DWDM Module Volume (K) Forecast, by Application 2019 & 2032
- Table 33: Global Compact DWDM Module Revenue million Forecast, by Application 2019 & 2032
- Table 34: Global Compact DWDM Module Volume K Forecast, by Application 2019 & 2032
- Table 35: Global Compact DWDM Module Revenue million Forecast, by Types 2019 & 2032
- Table 36: Global Compact DWDM Module Volume K Forecast, by Types 2019 & 2032
- Table 37: Global Compact DWDM Module Revenue million Forecast, by Country 2019 & 2032
- Table 38: Global Compact DWDM Module Volume K Forecast, by Country 2019 & 2032
- Table 39: United Kingdom Compact DWDM Module Revenue (million) Forecast, by Application 2019 & 2032
- Table 40: United Kingdom Compact DWDM Module Volume (K) Forecast, by Application 2019 & 2032
- Table 41: Germany Compact DWDM Module Revenue (million) Forecast, by Application 2019 & 2032
- Table 42: Germany Compact DWDM Module Volume (K) Forecast, by Application 2019 & 2032
- Table 43: France Compact DWDM Module Revenue (million) Forecast, by Application 2019 & 2032
- Table 44: France Compact DWDM Module Volume (K) Forecast, by Application 2019 & 2032
- Table 45: Italy Compact DWDM Module Revenue (million) Forecast, by Application 2019 & 2032
- Table 46: Italy Compact DWDM Module Volume (K) Forecast, by Application 2019 & 2032
- Table 47: Spain Compact DWDM Module Revenue (million) Forecast, by Application 2019 & 2032
- Table 48: Spain Compact DWDM Module Volume (K) Forecast, by Application 2019 & 2032
- Table 49: Russia Compact DWDM Module Revenue (million) Forecast, by Application 2019 & 2032
- Table 50: Russia Compact DWDM Module Volume (K) Forecast, by Application 2019 & 2032
- Table 51: Benelux Compact DWDM Module Revenue (million) Forecast, by Application 2019 & 2032
- Table 52: Benelux Compact DWDM Module Volume (K) Forecast, by Application 2019 & 2032
- Table 53: Nordics Compact DWDM Module Revenue (million) Forecast, by Application 2019 & 2032
- Table 54: Nordics Compact DWDM Module Volume (K) Forecast, by Application 2019 & 2032
- Table 55: Rest of Europe Compact DWDM Module Revenue (million) Forecast, by Application 2019 & 2032
- Table 56: Rest of Europe Compact DWDM Module Volume (K) Forecast, by Application 2019 & 2032
- Table 57: Global Compact DWDM Module Revenue million Forecast, by Application 2019 & 2032
- Table 58: Global Compact DWDM Module Volume K Forecast, by Application 2019 & 2032
- Table 59: Global Compact DWDM Module Revenue million Forecast, by Types 2019 & 2032
- Table 60: Global Compact DWDM Module Volume K Forecast, by Types 2019 & 2032
- Table 61: Global Compact DWDM Module Revenue million Forecast, by Country 2019 & 2032
- Table 62: Global Compact DWDM Module Volume K Forecast, by Country 2019 & 2032
- Table 63: Turkey Compact DWDM Module Revenue (million) Forecast, by Application 2019 & 2032
- Table 64: Turkey Compact DWDM Module Volume (K) Forecast, by Application 2019 & 2032
- Table 65: Israel Compact DWDM Module Revenue (million) Forecast, by Application 2019 & 2032
- Table 66: Israel Compact DWDM Module Volume (K) Forecast, by Application 2019 & 2032
- Table 67: GCC Compact DWDM Module Revenue (million) Forecast, by Application 2019 & 2032
- Table 68: GCC Compact DWDM Module Volume (K) Forecast, by Application 2019 & 2032
- Table 69: North Africa Compact DWDM Module Revenue (million) Forecast, by Application 2019 & 2032
- Table 70: North Africa Compact DWDM Module Volume (K) Forecast, by Application 2019 & 2032
- Table 71: South Africa Compact DWDM Module Revenue (million) Forecast, by Application 2019 & 2032
- Table 72: South Africa Compact DWDM Module Volume (K) Forecast, by Application 2019 & 2032
- Table 73: Rest of Middle East & Africa Compact DWDM Module Revenue (million) Forecast, by Application 2019 & 2032
- Table 74: Rest of Middle East & Africa Compact DWDM Module Volume (K) Forecast, by Application 2019 & 2032
- Table 75: Global Compact DWDM Module Revenue million Forecast, by Application 2019 & 2032
- Table 76: Global Compact DWDM Module Volume K Forecast, by Application 2019 & 2032
- Table 77: Global Compact DWDM Module Revenue million Forecast, by Types 2019 & 2032
- Table 78: Global Compact DWDM Module Volume K Forecast, by Types 2019 & 2032
- Table 79: Global Compact DWDM Module Revenue million Forecast, by Country 2019 & 2032
- Table 80: Global Compact DWDM Module Volume K Forecast, by Country 2019 & 2032
- Table 81: China Compact DWDM Module Revenue (million) Forecast, by Application 2019 & 2032
- Table 82: China Compact DWDM Module Volume (K) Forecast, by Application 2019 & 2032
- Table 83: India Compact DWDM Module Revenue (million) Forecast, by Application 2019 & 2032
- Table 84: India Compact DWDM Module Volume (K) Forecast, by Application 2019 & 2032
- Table 85: Japan Compact DWDM Module Revenue (million) Forecast, by Application 2019 & 2032
- Table 86: Japan Compact DWDM Module Volume (K) Forecast, by Application 2019 & 2032
- Table 87: South Korea Compact DWDM Module Revenue (million) Forecast, by Application 2019 & 2032
- Table 88: South Korea Compact DWDM Module Volume (K) Forecast, by Application 2019 & 2032
- Table 89: ASEAN Compact DWDM Module Revenue (million) Forecast, by Application 2019 & 2032
- Table 90: ASEAN Compact DWDM Module Volume (K) Forecast, by Application 2019 & 2032
- Table 91: Oceania Compact DWDM Module Revenue (million) Forecast, by Application 2019 & 2032
- Table 92: Oceania Compact DWDM Module Volume (K) Forecast, by Application 2019 & 2032
- Table 93: Rest of Asia Pacific Compact DWDM Module Revenue (million) Forecast, by Application 2019 & 2032
- Table 94: Rest of Asia Pacific Compact DWDM Module Volume (K) Forecast, by Application 2019 & 2032
Frequently Asked Questions
1. What is the projected Compound Annual Growth Rate (CAGR) of the Compact DWDM Module?
The projected CAGR is approximately XX%.
2. Which companies are prominent players in the Compact DWDM Module?
Key companies in the market include OptiWorks, OPTICO, SpeedPhoton Technology, GLSUN, Optosun, GAOTek, Flyin Group, Gracyfiber, OPELINK, Gezhi Photonics, VIAVI Solutions, Hilink.
3. What are the main segments of the Compact DWDM Module?
The market segments include Application, Types.
4. Can you provide details about the market size?
The market size is estimated to be USD XXX million as of 2022.
5. What are some drivers contributing to market growth?
N/A
6. What are the notable trends driving market growth?
N/A
7. Are there any restraints impacting market growth?
N/A
8. Can you provide examples of recent developments in the market?
N/A
9. What pricing options are available for accessing the report?
Pricing options include single-user, multi-user, and enterprise licenses priced at USD 4350.00, USD 6525.00, and USD 8700.00 respectively.
10. Is the market size provided in terms of value or volume?
The market size is provided in terms of value, measured in million and volume, measured in K.
11. Are there any specific market keywords associated with the report?
Yes, the market keyword associated with the report is "Compact DWDM Module," which aids in identifying and referencing the specific market segment covered.
12. How do I determine which pricing option suits my needs best?
The pricing options vary based on user requirements and access needs. Individual users may opt for single-user licenses, while businesses requiring broader access may choose multi-user or enterprise licenses for cost-effective access to the report.
13. Are there any additional resources or data provided in the Compact DWDM Module report?
While the report offers comprehensive insights, it's advisable to review the specific contents or supplementary materials provided to ascertain if additional resources or data are available.
14. How can I stay updated on further developments or reports in the Compact DWDM Module?
To stay informed about further developments, trends, and reports in the Compact DWDM Module, consider subscribing to industry newsletters, following relevant companies and organizations, or regularly checking reputable industry news sources and publications.
Methodology
Step 1 - Identification of Relevant Samples Size from Population Database


Step 2 - Approaches for Defining Global Market Size (Value, Volume* & Price*)

Note*: In applicable scenarios
Step 3 - Data Sources
Primary Research
- Web Analytics
- Survey Reports
- Research Institute
- Latest Research Reports
- Opinion Leaders
Secondary Research
- Annual Reports
- White Paper
- Latest Press Release
- Industry Association
- Paid Database
- Investor Presentations

Step 4 - Data Triangulation
Involves using different sources of information in order to increase the validity of a study
These sources are likely to be stakeholders in a program - participants, other researchers, program staff, other community members, and so on.
Then we put all data in single framework & apply various statistical tools to find out the dynamic on the market.
During the analysis stage, feedback from the stakeholder groups would be compared to determine areas of agreement as well as areas of divergence


