

Key Insights
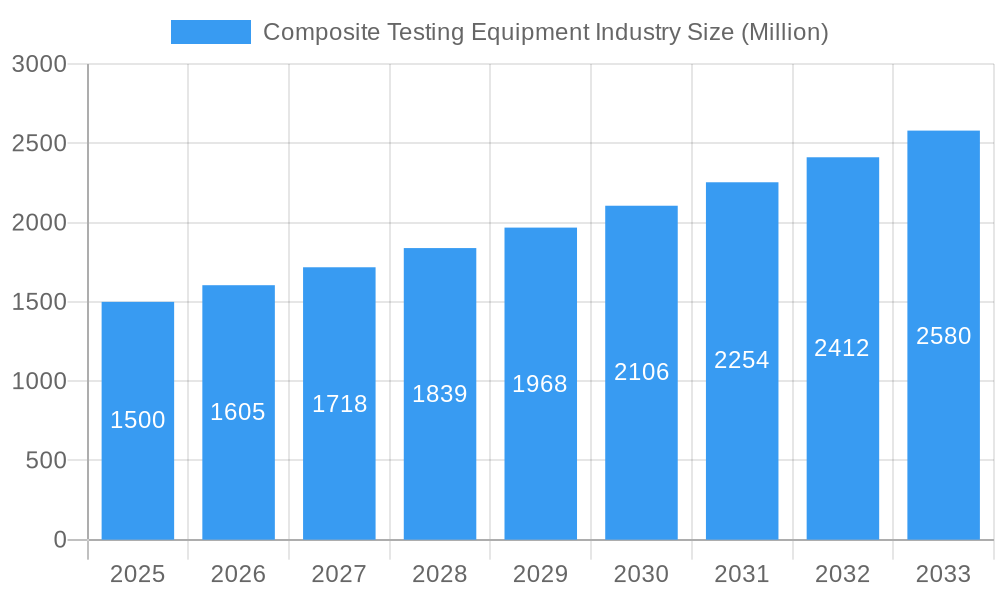
The global composite testing equipment market is poised for significant expansion, projected to reach $2.58 billion by 2033, with a compound annual growth rate (CAGR) of 7.16% from the base year 2025. This robust growth is attributed to the escalating demand for advanced materials across key sectors, including aerospace, automotive, and construction, alongside the imperative for stringent quality control and the adoption of lightweight, high-strength composites. The market is segmented by product type (Ceramic Matrix Composites, Continuous Fiber Composites, Discontinuous Fiber Composites, Polymer Matrix Composites, and Others), testing methodology (destructive and non-destructive), and application (aerospace & defense, automotive, building & construction, electricals & electronics, and others).
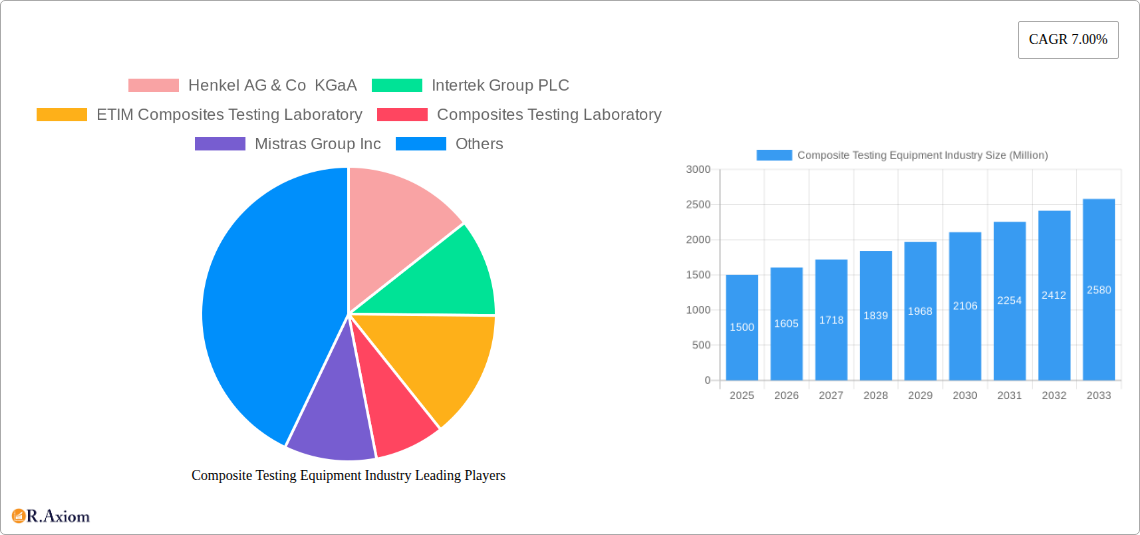
Composite Testing Equipment Industry Market Size (In Billion)
While the aerospace and defense sector currently leads due to critical safety requirements, the automotive and renewable energy sectors are expected to witness substantial growth, driven by the demand for fuel-efficient vehicles and sustainable infrastructure. Key industry players like Henkel, Intertek, and Element Materials Technology are spearheading innovation and expanding service portfolios to meet this rising demand. Geographically, North America and Europe are anticipated to hold significant market shares, with the Asia-Pacific region demonstrating accelerated growth fueled by increasing manufacturing activities and infrastructure development. The preference for non-destructive testing methods is increasing due to their cost-effectiveness and sample preservation capabilities.
Composite Testing Equipment Industry Company Market Share
Continuous advancements in composite material properties and stringent regulatory standards further propel market expansion. The integration of sophisticated testing techniques, such as digital image correlation and automated data acquisition systems, is enhancing efficiency and accuracy. Despite potential restraints from the high cost of advanced equipment and the need for skilled personnel, the outlook for the composite testing equipment market remains highly positive, presenting substantial growth opportunities in both established and emerging markets throughout the forecast period (2025-2033).
Composite Testing Equipment Industry: A Comprehensive Market Report (2019-2033)
This comprehensive report provides a detailed analysis of the Composite Testing Equipment industry, offering invaluable insights for industry stakeholders, investors, and strategic decision-makers. Covering the period from 2019 to 2033, with 2025 as the base year and a forecast period extending to 2033, this report meticulously examines market trends, competitive dynamics, and future growth opportunities. The market is valued at xx Million in 2025 and is projected to reach xx Million by 2033, exhibiting a CAGR of xx% during the forecast period.
Composite Testing Equipment Industry Market Concentration & Innovation
The global Composite Testing Equipment market is characterized by a moderately concentrated landscape. Leading global players such as Henkel AG & Co KGaA, Intertek Group PLC, Instron Corporation (Illinois Tool Works Inc), and Element Materials Technology command a significant portion of the market share. Despite the dominance of these key entities, a vibrant ecosystem of numerous smaller, highly specialized companies plays a crucial role in fostering continuous innovation and intense competition. Preliminary market share data for 2025 suggests that the top five industry leaders collectively hold approximately **[XX]%** of the global market. This balance between established giants and agile innovators defines the dynamic nature of the sector.
Innovation within the composite testing equipment sector is primarily propelled by the escalating demand for advanced composite materials across a wide spectrum of industries. This surge necessitates the development and adoption of increasingly sophisticated and precise testing methodologies. Furthermore, robust regulatory frameworks, particularly those focused on material safety, performance standards, and environmental impact, are instrumental in shaping industry practices and driving technological advancements. The advent and refinement of non-destructive testing (NDT) methods and the evolution of highly automated testing systems represent significant innovation drivers. While product substitutes, including alternative materials and evolving testing techniques, present a moderate challenge, the inherent advantages of composites continue to fuel demand for specialized testing solutions.
Mergers and acquisitions (M&A) activity within the industry has historically been relatively modest, with average annual deal values around **[XX] Million USD**. However, there is a discernible anticipation of increased future consolidation. This trend is expected to be particularly pronounced among smaller players who aim to strategically expand their product portfolios, enhance their technological capabilities, and broaden their geographical reach. A key underlying trend from end-users is a strong push towards highly customized testing solutions, coupled with a heightened emphasis on comprehensive data analysis and detailed reporting capabilities to ensure quality, performance, and compliance.
Composite Testing Equipment Industry Industry Trends & Insights
The Composite Testing Equipment market is experiencing robust growth driven by the escalating demand for lightweight, high-strength composite materials across various sectors. The aerospace and defense industries remain key drivers, followed by automotive and building & construction. The increasing adoption of renewable energy technologies, such as wind turbines, is also fueling demand. The market's CAGR is projected to be xx% between 2025 and 2033, indicating substantial growth potential. Market penetration of advanced testing techniques, particularly non-destructive methods, is steadily increasing.
Technological advancements in materials science and testing methodologies are significantly impacting the industry. The adoption of digitalization, including automation and data analytics, enhances testing efficiency and accuracy. Consumer preferences are shifting towards environmentally friendly testing methods and sustainable composite materials, influencing the development of new testing solutions. Competitive dynamics are characterized by a mix of established players and emerging innovators, leading to continuous product development and service improvements.
Dominant Markets & Segments in Composite Testing Equipment Industry
By Region: North America currently holds the largest market share, followed by Europe and Asia-Pacific. The high concentration of aerospace and automotive manufacturers in these regions, coupled with stringent quality control standards, are primary drivers.
By Product Type: Polymer Matrix Composites (PMCs) currently dominate the market due to their extensive use in diverse applications. Continuous Fiber Composites are also showing significant growth, driven by increasing applications in aerospace and automotive industries.
By Testing Method: Non-destructive testing (NDT) methods, such as ultrasonic testing and radiography, are gaining traction due to their ability to assess material properties without causing damage. However, Destructive testing remains essential for determining ultimate material properties.
By Application: The Aerospace and Defense sector remains the leading application segment, characterized by high demands for stringent quality control and performance assurance. The automotive industry is also a significant driver, as manufacturers seek to integrate lightweight composite materials to improve vehicle fuel efficiency.
Key drivers for regional dominance include robust economic growth, supportive government policies, and well-established infrastructure. Technological advancements, rising demand for lightweight materials, and the increasing adoption of automation are driving segment-specific growth.
Composite Testing Equipment Industry Product Developments
Recent product innovations focus on enhanced accuracy, speed, and automation in testing procedures. Miniaturized and portable testing equipment is gaining popularity for on-site inspections and quality control in diverse environments. Technological advancements such as AI-powered data analysis are improving the efficiency and reliability of testing results. These innovations offer competitive advantages in terms of cost-effectiveness and data insights, enabling improved product design and manufacturing processes, better matching market demands for quicker turnaround times and enhanced quality control.
Report Scope & Segmentation Analysis
This comprehensive report meticulously segments the Composite Testing Equipment market across several key dimensions. The segmentation by product type includes Ceramic Matrix Composites, Continuous Fiber Composites, Discontinuous Fiber Composites, Polymer Matrix Composites, and Other Composites. Further segmentation is provided by testing method, differentiating between Destructive and Non-destructive approaches, and by application, encompassing Aerospace and Defense, Automotive, Building & Construction, Electricals & Electronics, and Others. For each segment, the report delivers in-depth analysis of growth projections, current market sizes, and intricate competitive dynamics, offering invaluable insights into prevailing market conditions and projected future growth trajectories. Market size variations observed across different segments are indicative of differing levels of material demand, evolving testing requirements, and the pace of technological advancements specific to each sector. The competitive landscape within each segment is characterized by a strategic interplay between well-established industry leaders and agile, emerging niche specialists.
Key Drivers of Composite Testing Equipment Industry Growth
The robust growth trajectory of the composite testing equipment industry is underpinned by several pivotal factors. Paramount among these are continuous technological advancements that are persistently enhancing the accuracy, speed, and overall efficiency of testing procedures. Complementing this is the escalating demand for high-performance composite materials across a diverse array of industries, with particular emphasis on sectors like aerospace, automotive, and renewable energy, which are substantial drivers of market expansion. Finally, the imperative of adhering to stringent regulatory standards and rigorous quality control requirements necessitates comprehensive and reliable testing of these advanced materials, thereby directly fueling the demand for sophisticated testing equipment.
Challenges in the Composite Testing Equipment Industry Sector
Despite its growth, the composite testing equipment industry faces several significant challenges that can impede its expansion. A primary hurdle is the substantial capital expenditure required for acquiring advanced testing equipment, which can be a considerable barrier for smaller enterprises. Furthermore, the industry is susceptible to supply chain disruptions and the volatility of raw material prices, both of which can adversely impact production costs and overall profitability. Moreover, the presence of intense competition, stemming from both established market players and nimble new entrants, necessitates a relentless commitment to ongoing innovation and proactive adaptation to sustain a competitive edge in this dynamic marketplace.
Emerging Opportunities in Composite Testing Equipment Industry
Emerging opportunities exist in the development of specialized testing equipment for advanced composite materials, such as carbon nanotubes and graphene. The growing demand for sustainable and environmentally friendly testing methods is also creating new opportunities for innovation. Expansion into emerging markets with increasing infrastructure development and industrialization presents significant growth potential.
Leading Players in the Composite Testing Equipment Industry Market
- Henkel AG & Co KGaA
- Intertek Group PLC
- ETIM Composites Testing Laboratory
- Composites Testing Laboratory
- Mistras Group Inc
- Westmoreland Mechanical Testing & Research Inc
- Element Materials Technology
- Matrix Composites Inc (ITT Inc)
- Instron Corporation (Illinois Tool Works Inc)
Key Developments in Composite Testing Equipment Industry Industry
- 2022 Q4: Instron Corporation, a key industry player, revolutionized testing efficiency with the launch of a cutting-edge automated testing system designed specifically for composite materials.
- 2023 Q1: A strategically significant merger occurred between two prominent smaller composite testing equipment providers. This consolidation not only expanded their collective market share but also broadened their integrated product offerings.
- 2024 Q2: Henkel AG & Co KGaA demonstrated its commitment to technological advancement by making a substantial investment in research and development, focusing on the creation of next-generation non-destructive testing (NDT) technologies. (Further specific developments with precise dates will be incorporated as they become available.)
Strategic Outlook for Composite Testing Equipment Industry Market
The Composite Testing Equipment market is poised for continued growth, driven by technological advancements, increasing demand for composite materials in diverse sectors, and stringent industry regulations. Strategic investments in R&D, automation, and data analytics will be crucial for maintaining a competitive advantage. Expansion into emerging markets and development of specialized testing solutions for advanced composite materials will offer significant growth opportunities.
Composite Testing Equipment Industry Segmentation
-
1. Product Type
- 1.1. Ceramic Matrix Composites
- 1.2. Continuous Fiber Composites
- 1.3. Discontinuous Fiber Composites
- 1.4. Polymer Matrix Composites
- 1.5. Other Composites
-
2. Testing Method
- 2.1. Destructive
- 2.2. Non-destructive
-
3. Application
- 3.1. Aerospace and Defense
- 3.2. Automotive
- 3.3. Building & Construction
- 3.4. Electricals & Electronics
- 3.5. Others (Sporting Goods, Wind Energy, etc. )
Composite Testing Equipment Industry Segmentation By Geography
- 1. North America
- 2. Europe
- 3. Asia Pacific
- 4. Latin America
- 5. Middle East
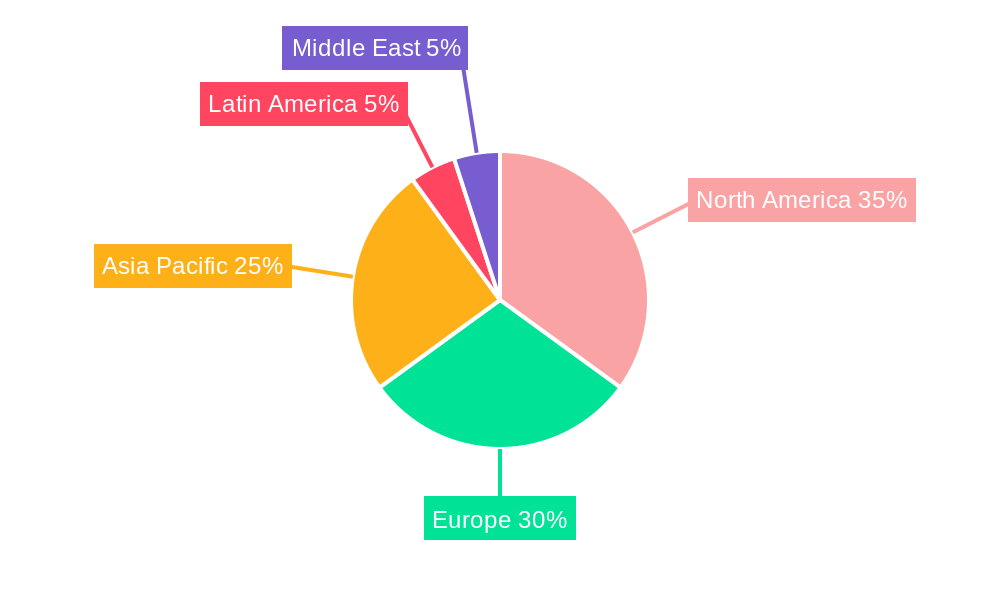
Composite Testing Equipment Industry Regional Market Share
Geographic Coverage of Composite Testing Equipment Industry
Composite Testing Equipment Industry REPORT HIGHLIGHTS
| Aspects | Details |
|---|---|
| Study Period | 2020-2034 |
| Base Year | 2025 |
| Estimated Year | 2026 |
| Forecast Period | 2026-2034 |
| Historical Period | 2020-2025 |
| Growth Rate | CAGR of 7.16% from 2020-2034 |
| Segmentation |
|
Table of Contents
- 1. Introduction
- 1.1. Research Scope
- 1.2. Market Segmentation
- 1.3. Research Objective
- 1.4. Definitions and Assumptions
- 2. Executive Summary
- 2.1. Market Snapshot
- 3. Market Dynamics
- 3.1. Market Drivers
- 3.2. Market Restrains
- 3.3. Market Trends
- 3.4. Market Opportunities
- 4. Market Factor Analysis
- 4.1. Porters Five Forces
- 4.1.1. Bargaining Power of Suppliers
- 4.1.2. Bargaining Power of Buyers
- 4.1.3. Threat of New Entrants
- 4.1.4. Threat of Substitutes
- 4.1.5. Competitive Rivalry
- 4.2. PESTEL analysis
- 4.3. BCG Analysis
- 4.3.1. Stars (High Growth, High Market Share)
- 4.3.2. Cash Cows (Low Growth, High Market Share)
- 4.3.3. Question Mark (High Growth, Low Market Share)
- 4.3.4. Dogs (Low Growth, Low Market Share)
- 4.4. Ansoff Matrix Analysis
- 4.5. Supply Chain Analysis
- 4.6. Regulatory Landscape
- 4.7. Current Market Potential and Opportunity Assessment (TAM–SAM–SOM Framework)
- 4.8. RAX Analyst Note
- 4.1. Porters Five Forces
- 5. Market Analysis, Insights and Forecast 2021-2033
- 5.1. Market Analysis, Insights and Forecast - by Product Type
- 5.1.1. Ceramic Matrix Composites
- 5.1.2. Continuous Fiber Composites
- 5.1.3. Discontinuous Fiber Composites
- 5.1.4. Polymer Matrix Composites
- 5.1.5. Other Composites
- 5.2. Market Analysis, Insights and Forecast - by Testing Method
- 5.2.1. Destructive
- 5.2.2. Non-destructive
- 5.3. Market Analysis, Insights and Forecast - by Application
- 5.3.1. Aerospace and Defense
- 5.3.2. Automotive
- 5.3.3. Building & Construction
- 5.3.4. Electricals & Electronics
- 5.3.5. Others (Sporting Goods, Wind Energy, etc. )
- 5.4. Market Analysis, Insights and Forecast - by Region
- 5.4.1. North America
- 5.4.2. Europe
- 5.4.3. Asia Pacific
- 5.4.4. Latin America
- 5.4.5. Middle East
- 5.1. Market Analysis, Insights and Forecast - by Product Type
- 6. Global Composite Testing Equipment Industry Analysis, Insights and Forecast, 2021-2033
- 6.1. Market Analysis, Insights and Forecast - by Product Type
- 6.1.1. Ceramic Matrix Composites
- 6.1.2. Continuous Fiber Composites
- 6.1.3. Discontinuous Fiber Composites
- 6.1.4. Polymer Matrix Composites
- 6.1.5. Other Composites
- 6.2. Market Analysis, Insights and Forecast - by Testing Method
- 6.2.1. Destructive
- 6.2.2. Non-destructive
- 6.3. Market Analysis, Insights and Forecast - by Application
- 6.3.1. Aerospace and Defense
- 6.3.2. Automotive
- 6.3.3. Building & Construction
- 6.3.4. Electricals & Electronics
- 6.3.5. Others (Sporting Goods, Wind Energy, etc. )
- 6.1. Market Analysis, Insights and Forecast - by Product Type
- 7. North America Composite Testing Equipment Industry Analysis, Insights and Forecast, 2020-2032
- 7.1. Market Analysis, Insights and Forecast - by Product Type
- 7.1.1. Ceramic Matrix Composites
- 7.1.2. Continuous Fiber Composites
- 7.1.3. Discontinuous Fiber Composites
- 7.1.4. Polymer Matrix Composites
- 7.1.5. Other Composites
- 7.2. Market Analysis, Insights and Forecast - by Testing Method
- 7.2.1. Destructive
- 7.2.2. Non-destructive
- 7.3. Market Analysis, Insights and Forecast - by Application
- 7.3.1. Aerospace and Defense
- 7.3.2. Automotive
- 7.3.3. Building & Construction
- 7.3.4. Electricals & Electronics
- 7.3.5. Others (Sporting Goods, Wind Energy, etc. )
- 7.1. Market Analysis, Insights and Forecast - by Product Type
- 8. Europe Composite Testing Equipment Industry Analysis, Insights and Forecast, 2020-2032
- 8.1. Market Analysis, Insights and Forecast - by Product Type
- 8.1.1. Ceramic Matrix Composites
- 8.1.2. Continuous Fiber Composites
- 8.1.3. Discontinuous Fiber Composites
- 8.1.4. Polymer Matrix Composites
- 8.1.5. Other Composites
- 8.2. Market Analysis, Insights and Forecast - by Testing Method
- 8.2.1. Destructive
- 8.2.2. Non-destructive
- 8.3. Market Analysis, Insights and Forecast - by Application
- 8.3.1. Aerospace and Defense
- 8.3.2. Automotive
- 8.3.3. Building & Construction
- 8.3.4. Electricals & Electronics
- 8.3.5. Others (Sporting Goods, Wind Energy, etc. )
- 8.1. Market Analysis, Insights and Forecast - by Product Type
- 9. Asia Pacific Composite Testing Equipment Industry Analysis, Insights and Forecast, 2020-2032
- 9.1. Market Analysis, Insights and Forecast - by Product Type
- 9.1.1. Ceramic Matrix Composites
- 9.1.2. Continuous Fiber Composites
- 9.1.3. Discontinuous Fiber Composites
- 9.1.4. Polymer Matrix Composites
- 9.1.5. Other Composites
- 9.2. Market Analysis, Insights and Forecast - by Testing Method
- 9.2.1. Destructive
- 9.2.2. Non-destructive
- 9.3. Market Analysis, Insights and Forecast - by Application
- 9.3.1. Aerospace and Defense
- 9.3.2. Automotive
- 9.3.3. Building & Construction
- 9.3.4. Electricals & Electronics
- 9.3.5. Others (Sporting Goods, Wind Energy, etc. )
- 9.1. Market Analysis, Insights and Forecast - by Product Type
- 10. Latin America Composite Testing Equipment Industry Analysis, Insights and Forecast, 2020-2032
- 10.1. Market Analysis, Insights and Forecast - by Product Type
- 10.1.1. Ceramic Matrix Composites
- 10.1.2. Continuous Fiber Composites
- 10.1.3. Discontinuous Fiber Composites
- 10.1.4. Polymer Matrix Composites
- 10.1.5. Other Composites
- 10.2. Market Analysis, Insights and Forecast - by Testing Method
- 10.2.1. Destructive
- 10.2.2. Non-destructive
- 10.3. Market Analysis, Insights and Forecast - by Application
- 10.3.1. Aerospace and Defense
- 10.3.2. Automotive
- 10.3.3. Building & Construction
- 10.3.4. Electricals & Electronics
- 10.3.5. Others (Sporting Goods, Wind Energy, etc. )
- 10.1. Market Analysis, Insights and Forecast - by Product Type
- 11. Middle East Composite Testing Equipment Industry Analysis, Insights and Forecast, 2020-2032
- 11.1. Market Analysis, Insights and Forecast - by Product Type
- 11.1.1. Ceramic Matrix Composites
- 11.1.2. Continuous Fiber Composites
- 11.1.3. Discontinuous Fiber Composites
- 11.1.4. Polymer Matrix Composites
- 11.1.5. Other Composites
- 11.2. Market Analysis, Insights and Forecast - by Testing Method
- 11.2.1. Destructive
- 11.2.2. Non-destructive
- 11.3. Market Analysis, Insights and Forecast - by Application
- 11.3.1. Aerospace and Defense
- 11.3.2. Automotive
- 11.3.3. Building & Construction
- 11.3.4. Electricals & Electronics
- 11.3.5. Others (Sporting Goods, Wind Energy, etc. )
- 11.1. Market Analysis, Insights and Forecast - by Product Type
- 12. Competitive Analysis
- 12.1. Company Profiles
- 12.1.1 Henkel AG & Co KGaA
- 12.1.1.1. Company Overview
- 12.1.1.2. Products
- 12.1.1.3. Company Financials
- 12.1.1.4. SWOT Analysis
- 12.1.2 Intertek Group PLC
- 12.1.2.1. Company Overview
- 12.1.2.2. Products
- 12.1.2.3. Company Financials
- 12.1.2.4. SWOT Analysis
- 12.1.3 ETIM Composites Testing Laboratory
- 12.1.3.1. Company Overview
- 12.1.3.2. Products
- 12.1.3.3. Company Financials
- 12.1.3.4. SWOT Analysis
- 12.1.4 Composites Testing Laboratory
- 12.1.4.1. Company Overview
- 12.1.4.2. Products
- 12.1.4.3. Company Financials
- 12.1.4.4. SWOT Analysis
- 12.1.5 Mistras Group Inc
- 12.1.5.1. Company Overview
- 12.1.5.2. Products
- 12.1.5.3. Company Financials
- 12.1.5.4. SWOT Analysis
- 12.1.6 Westmoreland Mechanical Testing & Research Inc
- 12.1.6.1. Company Overview
- 12.1.6.2. Products
- 12.1.6.3. Company Financials
- 12.1.6.4. SWOT Analysis
- 12.1.7 Element Materials Technology
- 12.1.7.1. Company Overview
- 12.1.7.2. Products
- 12.1.7.3. Company Financials
- 12.1.7.4. SWOT Analysis
- 12.1.8 Matrix Composites Inc (ITT Inc )
- 12.1.8.1. Company Overview
- 12.1.8.2. Products
- 12.1.8.3. Company Financials
- 12.1.8.4. SWOT Analysis
- 12.1.9 Instron Corporation (Illinois Tool Works Inc )
- 12.1.9.1. Company Overview
- 12.1.9.2. Products
- 12.1.9.3. Company Financials
- 12.1.9.4. SWOT Analysis
- 12.1.1 Henkel AG & Co KGaA
- 12.2. Market Entropy
- 12.2.1 Company's Key Areas Served
- 12.2.2 Recent Developments
- 12.3. Company Market Share Analysis 2025
- 12.3.1 Top 5 Companies Market Share Analysis
- 12.3.2 Top 3 Companies Market Share Analysis
- 12.4. List of Potential Customers
- 13. Research Methodology
List of Figures
- Figure 1: Global Composite Testing Equipment Industry Revenue Breakdown (billion, %) by Region 2025 & 2033
- Figure 2: Global Composite Testing Equipment Industry Volume Breakdown (K Unit, %) by Region 2025 & 2033
- Figure 3: North America Composite Testing Equipment Industry Revenue (billion), by Product Type 2025 & 2033
- Figure 4: North America Composite Testing Equipment Industry Volume (K Unit), by Product Type 2025 & 2033
- Figure 5: North America Composite Testing Equipment Industry Revenue Share (%), by Product Type 2025 & 2033
- Figure 6: North America Composite Testing Equipment Industry Volume Share (%), by Product Type 2025 & 2033
- Figure 7: North America Composite Testing Equipment Industry Revenue (billion), by Testing Method 2025 & 2033
- Figure 8: North America Composite Testing Equipment Industry Volume (K Unit), by Testing Method 2025 & 2033
- Figure 9: North America Composite Testing Equipment Industry Revenue Share (%), by Testing Method 2025 & 2033
- Figure 10: North America Composite Testing Equipment Industry Volume Share (%), by Testing Method 2025 & 2033
- Figure 11: North America Composite Testing Equipment Industry Revenue (billion), by Application 2025 & 2033
- Figure 12: North America Composite Testing Equipment Industry Volume (K Unit), by Application 2025 & 2033
- Figure 13: North America Composite Testing Equipment Industry Revenue Share (%), by Application 2025 & 2033
- Figure 14: North America Composite Testing Equipment Industry Volume Share (%), by Application 2025 & 2033
- Figure 15: North America Composite Testing Equipment Industry Revenue (billion), by Country 2025 & 2033
- Figure 16: North America Composite Testing Equipment Industry Volume (K Unit), by Country 2025 & 2033
- Figure 17: North America Composite Testing Equipment Industry Revenue Share (%), by Country 2025 & 2033
- Figure 18: North America Composite Testing Equipment Industry Volume Share (%), by Country 2025 & 2033
- Figure 19: Europe Composite Testing Equipment Industry Revenue (billion), by Product Type 2025 & 2033
- Figure 20: Europe Composite Testing Equipment Industry Volume (K Unit), by Product Type 2025 & 2033
- Figure 21: Europe Composite Testing Equipment Industry Revenue Share (%), by Product Type 2025 & 2033
- Figure 22: Europe Composite Testing Equipment Industry Volume Share (%), by Product Type 2025 & 2033
- Figure 23: Europe Composite Testing Equipment Industry Revenue (billion), by Testing Method 2025 & 2033
- Figure 24: Europe Composite Testing Equipment Industry Volume (K Unit), by Testing Method 2025 & 2033
- Figure 25: Europe Composite Testing Equipment Industry Revenue Share (%), by Testing Method 2025 & 2033
- Figure 26: Europe Composite Testing Equipment Industry Volume Share (%), by Testing Method 2025 & 2033
- Figure 27: Europe Composite Testing Equipment Industry Revenue (billion), by Application 2025 & 2033
- Figure 28: Europe Composite Testing Equipment Industry Volume (K Unit), by Application 2025 & 2033
- Figure 29: Europe Composite Testing Equipment Industry Revenue Share (%), by Application 2025 & 2033
- Figure 30: Europe Composite Testing Equipment Industry Volume Share (%), by Application 2025 & 2033
- Figure 31: Europe Composite Testing Equipment Industry Revenue (billion), by Country 2025 & 2033
- Figure 32: Europe Composite Testing Equipment Industry Volume (K Unit), by Country 2025 & 2033
- Figure 33: Europe Composite Testing Equipment Industry Revenue Share (%), by Country 2025 & 2033
- Figure 34: Europe Composite Testing Equipment Industry Volume Share (%), by Country 2025 & 2033
- Figure 35: Asia Pacific Composite Testing Equipment Industry Revenue (billion), by Product Type 2025 & 2033
- Figure 36: Asia Pacific Composite Testing Equipment Industry Volume (K Unit), by Product Type 2025 & 2033
- Figure 37: Asia Pacific Composite Testing Equipment Industry Revenue Share (%), by Product Type 2025 & 2033
- Figure 38: Asia Pacific Composite Testing Equipment Industry Volume Share (%), by Product Type 2025 & 2033
- Figure 39: Asia Pacific Composite Testing Equipment Industry Revenue (billion), by Testing Method 2025 & 2033
- Figure 40: Asia Pacific Composite Testing Equipment Industry Volume (K Unit), by Testing Method 2025 & 2033
- Figure 41: Asia Pacific Composite Testing Equipment Industry Revenue Share (%), by Testing Method 2025 & 2033
- Figure 42: Asia Pacific Composite Testing Equipment Industry Volume Share (%), by Testing Method 2025 & 2033
- Figure 43: Asia Pacific Composite Testing Equipment Industry Revenue (billion), by Application 2025 & 2033
- Figure 44: Asia Pacific Composite Testing Equipment Industry Volume (K Unit), by Application 2025 & 2033
- Figure 45: Asia Pacific Composite Testing Equipment Industry Revenue Share (%), by Application 2025 & 2033
- Figure 46: Asia Pacific Composite Testing Equipment Industry Volume Share (%), by Application 2025 & 2033
- Figure 47: Asia Pacific Composite Testing Equipment Industry Revenue (billion), by Country 2025 & 2033
- Figure 48: Asia Pacific Composite Testing Equipment Industry Volume (K Unit), by Country 2025 & 2033
- Figure 49: Asia Pacific Composite Testing Equipment Industry Revenue Share (%), by Country 2025 & 2033
- Figure 50: Asia Pacific Composite Testing Equipment Industry Volume Share (%), by Country 2025 & 2033
- Figure 51: Latin America Composite Testing Equipment Industry Revenue (billion), by Product Type 2025 & 2033
- Figure 52: Latin America Composite Testing Equipment Industry Volume (K Unit), by Product Type 2025 & 2033
- Figure 53: Latin America Composite Testing Equipment Industry Revenue Share (%), by Product Type 2025 & 2033
- Figure 54: Latin America Composite Testing Equipment Industry Volume Share (%), by Product Type 2025 & 2033
- Figure 55: Latin America Composite Testing Equipment Industry Revenue (billion), by Testing Method 2025 & 2033
- Figure 56: Latin America Composite Testing Equipment Industry Volume (K Unit), by Testing Method 2025 & 2033
- Figure 57: Latin America Composite Testing Equipment Industry Revenue Share (%), by Testing Method 2025 & 2033
- Figure 58: Latin America Composite Testing Equipment Industry Volume Share (%), by Testing Method 2025 & 2033
- Figure 59: Latin America Composite Testing Equipment Industry Revenue (billion), by Application 2025 & 2033
- Figure 60: Latin America Composite Testing Equipment Industry Volume (K Unit), by Application 2025 & 2033
- Figure 61: Latin America Composite Testing Equipment Industry Revenue Share (%), by Application 2025 & 2033
- Figure 62: Latin America Composite Testing Equipment Industry Volume Share (%), by Application 2025 & 2033
- Figure 63: Latin America Composite Testing Equipment Industry Revenue (billion), by Country 2025 & 2033
- Figure 64: Latin America Composite Testing Equipment Industry Volume (K Unit), by Country 2025 & 2033
- Figure 65: Latin America Composite Testing Equipment Industry Revenue Share (%), by Country 2025 & 2033
- Figure 66: Latin America Composite Testing Equipment Industry Volume Share (%), by Country 2025 & 2033
- Figure 67: Middle East Composite Testing Equipment Industry Revenue (billion), by Product Type 2025 & 2033
- Figure 68: Middle East Composite Testing Equipment Industry Volume (K Unit), by Product Type 2025 & 2033
- Figure 69: Middle East Composite Testing Equipment Industry Revenue Share (%), by Product Type 2025 & 2033
- Figure 70: Middle East Composite Testing Equipment Industry Volume Share (%), by Product Type 2025 & 2033
- Figure 71: Middle East Composite Testing Equipment Industry Revenue (billion), by Testing Method 2025 & 2033
- Figure 72: Middle East Composite Testing Equipment Industry Volume (K Unit), by Testing Method 2025 & 2033
- Figure 73: Middle East Composite Testing Equipment Industry Revenue Share (%), by Testing Method 2025 & 2033
- Figure 74: Middle East Composite Testing Equipment Industry Volume Share (%), by Testing Method 2025 & 2033
- Figure 75: Middle East Composite Testing Equipment Industry Revenue (billion), by Application 2025 & 2033
- Figure 76: Middle East Composite Testing Equipment Industry Volume (K Unit), by Application 2025 & 2033
- Figure 77: Middle East Composite Testing Equipment Industry Revenue Share (%), by Application 2025 & 2033
- Figure 78: Middle East Composite Testing Equipment Industry Volume Share (%), by Application 2025 & 2033
- Figure 79: Middle East Composite Testing Equipment Industry Revenue (billion), by Country 2025 & 2033
- Figure 80: Middle East Composite Testing Equipment Industry Volume (K Unit), by Country 2025 & 2033
- Figure 81: Middle East Composite Testing Equipment Industry Revenue Share (%), by Country 2025 & 2033
- Figure 82: Middle East Composite Testing Equipment Industry Volume Share (%), by Country 2025 & 2033
List of Tables
- Table 1: Global Composite Testing Equipment Industry Revenue billion Forecast, by Product Type 2020 & 2033
- Table 2: Global Composite Testing Equipment Industry Volume K Unit Forecast, by Product Type 2020 & 2033
- Table 3: Global Composite Testing Equipment Industry Revenue billion Forecast, by Testing Method 2020 & 2033
- Table 4: Global Composite Testing Equipment Industry Volume K Unit Forecast, by Testing Method 2020 & 2033
- Table 5: Global Composite Testing Equipment Industry Revenue billion Forecast, by Application 2020 & 2033
- Table 6: Global Composite Testing Equipment Industry Volume K Unit Forecast, by Application 2020 & 2033
- Table 7: Global Composite Testing Equipment Industry Revenue billion Forecast, by Region 2020 & 2033
- Table 8: Global Composite Testing Equipment Industry Volume K Unit Forecast, by Region 2020 & 2033
- Table 9: Global Composite Testing Equipment Industry Revenue billion Forecast, by Product Type 2020 & 2033
- Table 10: Global Composite Testing Equipment Industry Volume K Unit Forecast, by Product Type 2020 & 2033
- Table 11: Global Composite Testing Equipment Industry Revenue billion Forecast, by Testing Method 2020 & 2033
- Table 12: Global Composite Testing Equipment Industry Volume K Unit Forecast, by Testing Method 2020 & 2033
- Table 13: Global Composite Testing Equipment Industry Revenue billion Forecast, by Application 2020 & 2033
- Table 14: Global Composite Testing Equipment Industry Volume K Unit Forecast, by Application 2020 & 2033
- Table 15: Global Composite Testing Equipment Industry Revenue billion Forecast, by Country 2020 & 2033
- Table 16: Global Composite Testing Equipment Industry Volume K Unit Forecast, by Country 2020 & 2033
- Table 17: Global Composite Testing Equipment Industry Revenue billion Forecast, by Product Type 2020 & 2033
- Table 18: Global Composite Testing Equipment Industry Volume K Unit Forecast, by Product Type 2020 & 2033
- Table 19: Global Composite Testing Equipment Industry Revenue billion Forecast, by Testing Method 2020 & 2033
- Table 20: Global Composite Testing Equipment Industry Volume K Unit Forecast, by Testing Method 2020 & 2033
- Table 21: Global Composite Testing Equipment Industry Revenue billion Forecast, by Application 2020 & 2033
- Table 22: Global Composite Testing Equipment Industry Volume K Unit Forecast, by Application 2020 & 2033
- Table 23: Global Composite Testing Equipment Industry Revenue billion Forecast, by Country 2020 & 2033
- Table 24: Global Composite Testing Equipment Industry Volume K Unit Forecast, by Country 2020 & 2033
- Table 25: Global Composite Testing Equipment Industry Revenue billion Forecast, by Product Type 2020 & 2033
- Table 26: Global Composite Testing Equipment Industry Volume K Unit Forecast, by Product Type 2020 & 2033
- Table 27: Global Composite Testing Equipment Industry Revenue billion Forecast, by Testing Method 2020 & 2033
- Table 28: Global Composite Testing Equipment Industry Volume K Unit Forecast, by Testing Method 2020 & 2033
- Table 29: Global Composite Testing Equipment Industry Revenue billion Forecast, by Application 2020 & 2033
- Table 30: Global Composite Testing Equipment Industry Volume K Unit Forecast, by Application 2020 & 2033
- Table 31: Global Composite Testing Equipment Industry Revenue billion Forecast, by Country 2020 & 2033
- Table 32: Global Composite Testing Equipment Industry Volume K Unit Forecast, by Country 2020 & 2033
- Table 33: Global Composite Testing Equipment Industry Revenue billion Forecast, by Product Type 2020 & 2033
- Table 34: Global Composite Testing Equipment Industry Volume K Unit Forecast, by Product Type 2020 & 2033
- Table 35: Global Composite Testing Equipment Industry Revenue billion Forecast, by Testing Method 2020 & 2033
- Table 36: Global Composite Testing Equipment Industry Volume K Unit Forecast, by Testing Method 2020 & 2033
- Table 37: Global Composite Testing Equipment Industry Revenue billion Forecast, by Application 2020 & 2033
- Table 38: Global Composite Testing Equipment Industry Volume K Unit Forecast, by Application 2020 & 2033
- Table 39: Global Composite Testing Equipment Industry Revenue billion Forecast, by Country 2020 & 2033
- Table 40: Global Composite Testing Equipment Industry Volume K Unit Forecast, by Country 2020 & 2033
- Table 41: Global Composite Testing Equipment Industry Revenue billion Forecast, by Product Type 2020 & 2033
- Table 42: Global Composite Testing Equipment Industry Volume K Unit Forecast, by Product Type 2020 & 2033
- Table 43: Global Composite Testing Equipment Industry Revenue billion Forecast, by Testing Method 2020 & 2033
- Table 44: Global Composite Testing Equipment Industry Volume K Unit Forecast, by Testing Method 2020 & 2033
- Table 45: Global Composite Testing Equipment Industry Revenue billion Forecast, by Application 2020 & 2033
- Table 46: Global Composite Testing Equipment Industry Volume K Unit Forecast, by Application 2020 & 2033
- Table 47: Global Composite Testing Equipment Industry Revenue billion Forecast, by Country 2020 & 2033
- Table 48: Global Composite Testing Equipment Industry Volume K Unit Forecast, by Country 2020 & 2033
Frequently Asked Questions
1. What is the projected Compound Annual Growth Rate (CAGR) of the Composite Testing Equipment Industry?
The projected CAGR is approximately 7.16%.
2. Which companies are prominent players in the Composite Testing Equipment Industry?
Key companies in the market include Henkel AG & Co KGaA, Intertek Group PLC, ETIM Composites Testing Laboratory, Composites Testing Laboratory, Mistras Group Inc, Westmoreland Mechanical Testing & Research Inc , Element Materials Technology, Matrix Composites Inc (ITT Inc ), Instron Corporation (Illinois Tool Works Inc ).
3. What are the main segments of the Composite Testing Equipment Industry?
The market segments include Product Type, Testing Method, Application.
4. Can you provide details about the market size?
The market size is estimated to be USD 2.58 billion as of 2022.
5. What are some drivers contributing to market growth?
; Large Investments on Composites Testing Facilities in Asia-Pacific; Increasing Demand for Composite Testing From Automotive and Aerospace & Defense; Growing Demand for Testing of Hydraulic Frames in Aerospace & Defense Application.
6. What are the notable trends driving market growth?
Building and Construction Segment Expected to Show Significant Growth in Application.
7. Are there any restraints impacting market growth?
; Lack of Trained Operators and Expertise in Developing Regions; Issues Related to Recyclability of Composites.
8. Can you provide examples of recent developments in the market?
N/A
9. What pricing options are available for accessing the report?
Pricing options include single-user, multi-user, and enterprise licenses priced at USD 4750, USD 5250, and USD 8750 respectively.
10. Is the market size provided in terms of value or volume?
The market size is provided in terms of value, measured in billion and volume, measured in K Unit.
11. Are there any specific market keywords associated with the report?
Yes, the market keyword associated with the report is "Composite Testing Equipment Industry," which aids in identifying and referencing the specific market segment covered.
12. How do I determine which pricing option suits my needs best?
The pricing options vary based on user requirements and access needs. Individual users may opt for single-user licenses, while businesses requiring broader access may choose multi-user or enterprise licenses for cost-effective access to the report.
13. Are there any additional resources or data provided in the Composite Testing Equipment Industry report?
While the report offers comprehensive insights, it's advisable to review the specific contents or supplementary materials provided to ascertain if additional resources or data are available.
14. How can I stay updated on further developments or reports in the Composite Testing Equipment Industry?
To stay informed about further developments, trends, and reports in the Composite Testing Equipment Industry, consider subscribing to industry newsletters, following relevant companies and organizations, or regularly checking reputable industry news sources and publications.
Methodology
Step 1 - Identification of Relevant Samples Size from Population Database


Step 2 - Approaches for Defining Global Market Size (Value, Volume* & Price*)

Note*: In applicable scenarios
Step 3 - Data Sources
Primary Research
- Web Analytics
- Survey Reports
- Research Institute
- Latest Research Reports
- Opinion Leaders
Secondary Research
- Annual Reports
- White Paper
- Latest Press Release
- Industry Association
- Paid Database
- Investor Presentations

Step 4 - Data Triangulation
Involves using different sources of information in order to increase the validity of a study
These sources are likely to be stakeholders in a program - participants, other researchers, program staff, other community members, and so on.
Then we put all data in single framework & apply various statistical tools to find out the dynamic on the market.
During the analysis stage, feedback from the stakeholder groups would be compared to determine areas of agreement as well as areas of divergence