

Key Insights
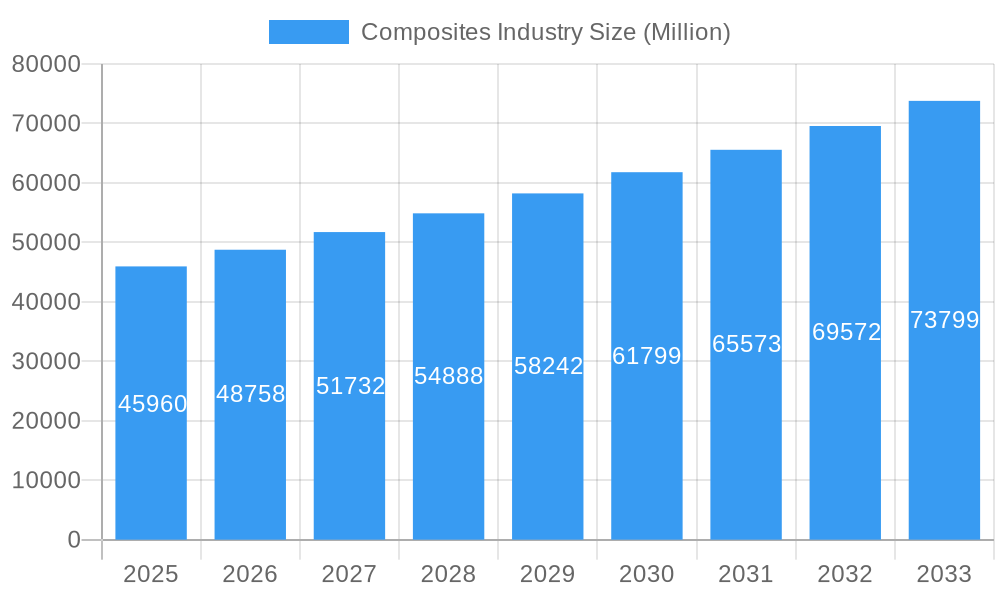
The global composites market, valued at $45.96 billion in 2025, is projected to experience robust growth, driven by a compound annual growth rate (CAGR) exceeding 5% from 2025 to 2033. This expansion is fueled by several key factors. The increasing demand for lightweight yet high-strength materials in the automotive and aerospace industries is a primary driver. The automotive sector's shift towards fuel efficiency and electric vehicles necessitates the use of composites to reduce vehicle weight and improve battery performance. Similarly, the aerospace industry leverages composites for their superior strength-to-weight ratio, enabling the design of lighter and more fuel-efficient aircraft. Furthermore, the burgeoning wind energy sector relies heavily on composite materials for the construction of wind turbine blades, contributing significantly to market growth. Technological advancements in composite manufacturing processes, leading to improved material properties and reduced production costs, further bolster market expansion. Growth is also expected to come from applications in construction (e.g., reinforced concrete, prefabricated components), pipes and tanks (due to corrosion resistance and durability), and sports and recreation equipment (e.g., high-performance bicycles, sporting goods).
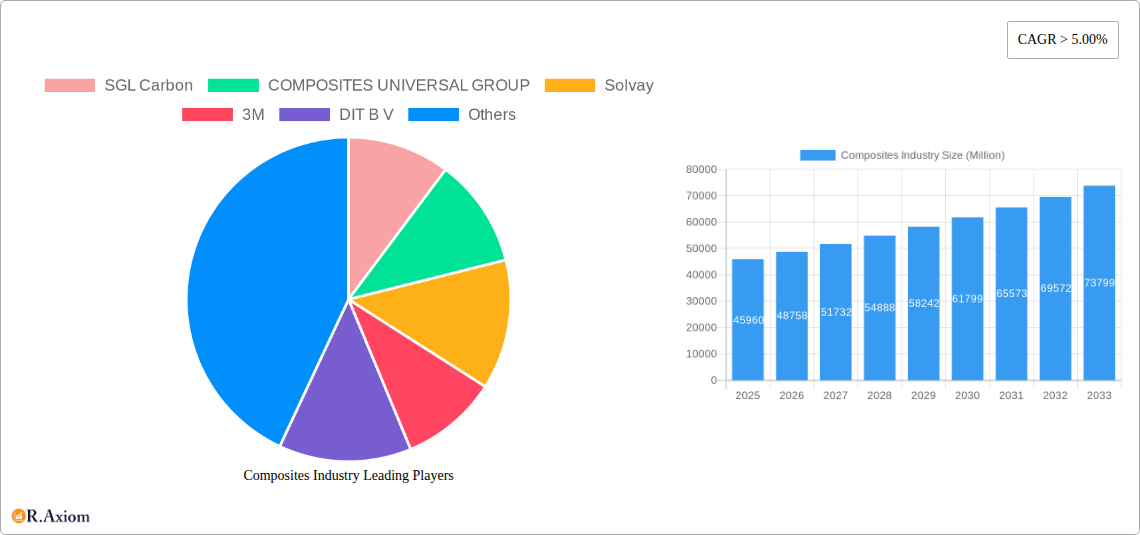
Composites Industry Market Size (In Billion)
However, the market faces certain challenges. The relatively high cost of composite materials compared to traditional materials remains a restraint, particularly for applications where cost is a primary consideration. Supply chain disruptions and the availability of raw materials, especially high-performance fibers like carbon fiber, can also impact market growth. Additionally, the complex manufacturing processes and specialized skills required for composite processing can pose challenges for wider adoption in certain sectors. Despite these restraints, the long-term outlook for the composites market remains positive, with continuous innovation and increasing demand from key end-use sectors promising substantial growth throughout the forecast period. The market segmentation by matrix material (polymer, ceramic/carbon, metal), reinforcement fiber (glass, carbon, aramid), and end-use application provides a detailed understanding of specific growth opportunities within the broader market. Leading players such as SGL Carbon, Solvay, 3M, and Toray Industries are strategically positioning themselves to capitalize on these opportunities through research and development, strategic partnerships, and geographic expansion.
Composites Industry Company Market Share
Composites Industry Market Report: 2019-2033
This comprehensive report provides an in-depth analysis of the global composites industry, covering market size, growth drivers, key players, and future trends. The study period spans from 2019 to 2033, with 2025 as the base year and a forecast period from 2025 to 2033. The report utilizes data from the historical period of 2019-2024 to provide a robust foundation for its projections. Valuations are expressed in Millions of USD.
Composites Industry Market Concentration & Innovation
The composites industry exhibits a moderately concentrated market structure, with several multinational corporations holding significant market share. Key players such as SGL Carbon, COMPOSITES UNIVERSAL GROUP, Solvay, 3M, DIT B V, Owens Corning, DuPont, TORAY INDUSTRIES INC, Mitsubishi Chemical Group Corporation, Hexcel Corporation, TEIJIN LIMITED, and Materion Corporation contribute significantly to the overall market value, estimated at xx Million in 2024. However, the presence of numerous smaller players and regional manufacturers fosters competition and innovation.
Market share analysis reveals that the top five companies collectively hold approximately xx% of the global market, indicating a moderate level of concentration. Innovation within the industry is driven by the increasing demand for lightweight, high-strength materials across various end-use applications. Regulatory frameworks, such as those promoting sustainable materials and reducing carbon emissions, influence the development and adoption of new composite materials. Product substitutes, like traditional metals and plastics, continue to pose a competitive challenge. End-user trends toward improved fuel efficiency, enhanced durability, and reduced weight are driving demand for advanced composite materials.
Mergers and acquisitions (M&A) are prevalent, with recent examples including:
- February 2024: Owens Corning’s USD 3.9 Billion acquisition of Masonite significantly strengthened its position in building and construction materials.
- June 2023: Solvay’s collaboration with Spirit AeroSystems for composite development highlights the industry's focus on sustainable aviation technologies. The combined deal value for M&A activities in the past five years is estimated to be xx Billion.
Composites Industry Trends & Insights
The global composites market is experiencing robust growth, driven by increasing demand from diverse sectors. The Compound Annual Growth Rate (CAGR) during the forecast period (2025-2033) is projected to be xx%, reaching a market value of xx Million by 2033. This growth is fueled by several factors:
- Technological advancements: Continuous improvements in material properties, manufacturing processes, and design capabilities are leading to the development of lighter, stronger, and more cost-effective composite materials.
- Expanding end-use applications: The adoption of composites is expanding rapidly in various sectors, including automotive, aerospace, wind energy, and construction, driving significant market growth. Market penetration in the automotive sector is projected to reach xx% by 2033.
- Stringent government regulations: Regulations promoting the use of lightweight and fuel-efficient materials in vehicles and aircraft are driving demand for composites.
- Increasing consumer preference: Consumers are increasingly demanding products with improved performance, durability, and sustainability attributes, which are readily offered by composite materials.
Competitive dynamics remain intense, with established players constantly striving to enhance their product portfolios and expand their market reach through strategic partnerships, acquisitions, and technological innovation.
Dominant Markets & Segments in Composites Industry
The North American region currently holds a dominant position in the global composites market, driven by robust economic growth, a well-established manufacturing base, and significant investments in research and development. However, the Asia-Pacific region is experiencing rapid growth, anticipated to surpass North America in market size within the forecast period.
Key Drivers:
- Economic Policies: Government incentives and subsidies for sustainable materials are boosting adoption.
- Infrastructure Development: Large-scale infrastructure projects, particularly in emerging economies, are driving significant demand for composite materials.
Segment Dominance Analysis:
- Matrix Material: Polymer Matrix Composites (PMC) currently holds the largest market share due to their cost-effectiveness and versatility. However, Ceramic/Carbon Matrix Composites (CMCs) are gaining traction due to their superior performance in high-temperature applications.
- Reinforcement Fiber: Carbon fiber is the fastest-growing segment, driven by its high strength-to-weight ratio and widespread use in aerospace and automotive applications. Glass fiber remains dominant in terms of volume but faces increasing competition from carbon fiber.
- End-use Application: The automotive and transportation sector is currently the largest consumer of composites, closely followed by the wind energy sector. The aerospace and defense sector presents a significant growth opportunity due to the increasing demand for lightweight and durable aircraft components.
Composites Industry Product Developments
Recent product innovations focus on enhancing material properties such as strength, stiffness, durability, and thermal stability. Advanced manufacturing techniques, like 3D printing, are also gaining traction, allowing for greater design flexibility and customization. These developments provide significant competitive advantages, enabling manufacturers to cater to specific end-user requirements and optimize product performance. The focus is on developing sustainable and recyclable composite materials to address growing environmental concerns.
Report Scope & Segmentation Analysis
This report segments the composites market based on matrix material (PMC, CMC, and other matrices), reinforcement fiber (glass fiber, carbon fiber, aramid fiber, and other fibers), and end-use application (automotive and transportation, wind energy, aerospace and defense, pipes and tanks, construction, electrical and electronics, sports and recreation, and other end-use applications). Each segment is thoroughly analyzed, providing growth projections, market sizes, and competitive dynamics. For instance, the PMC segment is expected to witness a CAGR of xx% during the forecast period, while the carbon fiber reinforcement segment is projected to grow at xx%. Competitive dynamics vary across segments, with intense competition observed in some areas and more niche players in others.
Key Drivers of Composites Industry Growth
Several factors contribute to the composites industry's growth: Technological advancements resulting in lighter, stronger, and more cost-effective materials; expanding end-use applications across diverse sectors; stringent government regulations promoting sustainable materials; and increasing consumer preference for high-performance, durable, and environmentally friendly products. Examples include the rising demand for fuel-efficient vehicles and wind turbine blades.
Challenges in the Composites Industry Sector
The composites industry faces challenges such as high raw material costs, complex manufacturing processes, and potential environmental concerns related to the disposal of composite materials. Supply chain disruptions and intense competition also impact profitability and market share. The industry is actively addressing these challenges through continuous innovation in material design, manufacturing processes, and recycling technologies. Quantifiable impacts vary; for example, supply chain disruptions in 2022 impacted overall production by an estimated xx%.
Emerging Opportunities in Composites Industry
Emerging opportunities include the development of bio-based composites, advancements in recycling technologies, and the exploration of new applications in areas such as healthcare and robotics. The increasing demand for lightweight and sustainable materials in infrastructure projects and the growing adoption of additive manufacturing for composites offer further growth potential.
Leading Players in the Composites Industry Market
- SGL Carbon
- COMPOSITES UNIVERSAL GROUP
- Solvay
- 3M
- DIT B V
- Owens Corning
- DuPont
- TORAY INDUSTRIES INC
- Mitsubishi Chemical Group Corporation
- Hexcel Corporation
- TEIJIN LIMITED
- Materion Corporation
Key Developments in Composites Industry Industry
- February 2024: Owens Corning acquired Masonite for USD 3.9 Billion, strengthening its position in building and construction.
- June 2023: Solvay collaborated with Spirit AeroSystems on composite development for sustainable aircraft technologies.
Strategic Outlook for Composites Industry Market
The composites industry is poised for continued growth, driven by technological innovation, expanding applications, and increasing demand for sustainable materials. Future market potential lies in developing advanced composites with enhanced properties, exploring new applications, and addressing environmental concerns related to production and disposal. Strategic partnerships and investments in research and development will be crucial for success in this dynamic market.
Composites Industry Segmentation
-
1. Matrix Material
-
1.1. Polymer Matrix Composites (PMC)
- 1.1.1. Thermoset Resins
- 1.1.2. Thermoplastic Resins
- 1.2. Ceramic/Carbon Matrix Composites (CMCs)
- 1.3. Other Matrices (Metal Matrix Composites)
-
1.1. Polymer Matrix Composites (PMC)
-
2. Reinforcement Fiber
- 2.1. Glass Fiber
- 2.2. Carbon Fiber
- 2.3. Aramid Fiber
- 2.4. Other Fibers
-
3. End-use Application
- 3.1. Automotive and Transportation
- 3.2. Wind Energy
- 3.3. Aerospace and Defense
- 3.4. Pipes and Tanks
- 3.5. Construction
- 3.6. Electrical and Electronics
- 3.7. Sports and Recreation
- 3.8. Other End-use Applications
Composites Industry Segmentation By Geography
-
1. Asia Pacific
- 1.1. China
- 1.2. India
- 1.3. Japan
- 1.4. South Korea
- 1.5. Thailand
- 1.6. Malaysia
- 1.7. Indonesia
- 1.8. Vietnam
- 1.9. Rest of Asia Pacific
-
2. North America
- 2.1. United States
- 2.2. Canada
- 2.3. Mexico
-
3. Europe
- 3.1. Germany
- 3.2. United Kingdom
- 3.3. France
- 3.4. Italy
- 3.5. Spain
- 3.6. Russia
- 3.7. NORDIC Countries
- 3.8. Turkey
- 3.9. Rest of Europe
-
4. South America
- 4.1. Brazil
- 4.2. Argentina
- 4.3. Colombia
- 4.4. Rest of South America
-
5. Middle East and Africa
- 5.1. Saudi Arabia
- 5.2. South Africa
- 5.3. Nigeria
- 5.4. Qatar
- 5.5. Egypt
- 5.6. United Arab Emirates
- 5.7. Rest of Middle East and Africa
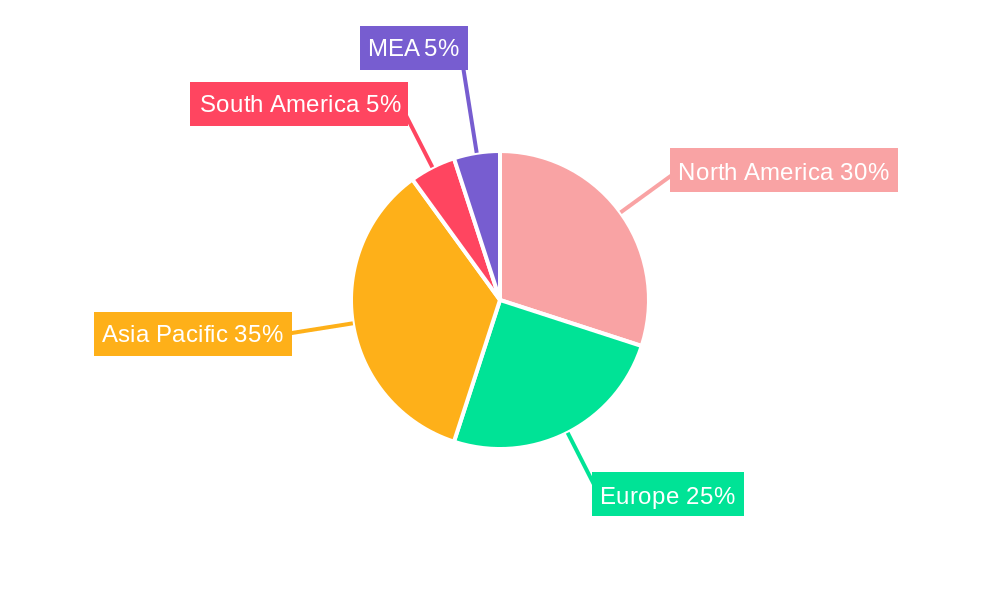
Composites Industry Regional Market Share
Geographic Coverage of Composites Industry
Composites Industry REPORT HIGHLIGHTS
| Aspects | Details |
|---|---|
| Study Period | 2020-2034 |
| Base Year | 2025 |
| Estimated Year | 2026 |
| Forecast Period | 2026-2034 |
| Historical Period | 2020-2025 |
| Growth Rate | CAGR of > 5.00% from 2020-2034 |
| Segmentation |
|
Table of Contents
- 1. Introduction
- 1.1. Research Scope
- 1.2. Market Segmentation
- 1.3. Research Objective
- 1.4. Definitions and Assumptions
- 2. Executive Summary
- 2.1. Market Snapshot
- 3. Market Dynamics
- 3.1. Market Drivers
- 3.2. Market Restrains
- 3.3. Market Trends
- 3.4. Market Opportunities
- 4. Market Factor Analysis
- 4.1. Porters Five Forces
- 4.1.1. Bargaining Power of Suppliers
- 4.1.2. Bargaining Power of Buyers
- 4.1.3. Threat of New Entrants
- 4.1.4. Threat of Substitutes
- 4.1.5. Competitive Rivalry
- 4.2. PESTEL analysis
- 4.3. BCG Analysis
- 4.3.1. Stars (High Growth, High Market Share)
- 4.3.2. Cash Cows (Low Growth, High Market Share)
- 4.3.3. Question Mark (High Growth, Low Market Share)
- 4.3.4. Dogs (Low Growth, Low Market Share)
- 4.4. Ansoff Matrix Analysis
- 4.5. Supply Chain Analysis
- 4.6. Regulatory Landscape
- 4.7. Current Market Potential and Opportunity Assessment (TAM–SAM–SOM Framework)
- 4.8. RAX Analyst Note
- 4.1. Porters Five Forces
- 5. Market Analysis, Insights and Forecast 2021-2033
- 5.1. Market Analysis, Insights and Forecast - by Matrix Material
- 5.1.1. Polymer Matrix Composites (PMC)
- 5.1.1.1. Thermoset Resins
- 5.1.1.2. Thermoplastic Resins
- 5.1.2. Ceramic/Carbon Matrix Composites (CMCs)
- 5.1.3. Other Matrices (Metal Matrix Composites)
- 5.1.1. Polymer Matrix Composites (PMC)
- 5.2. Market Analysis, Insights and Forecast - by Reinforcement Fiber
- 5.2.1. Glass Fiber
- 5.2.2. Carbon Fiber
- 5.2.3. Aramid Fiber
- 5.2.4. Other Fibers
- 5.3. Market Analysis, Insights and Forecast - by End-use Application
- 5.3.1. Automotive and Transportation
- 5.3.2. Wind Energy
- 5.3.3. Aerospace and Defense
- 5.3.4. Pipes and Tanks
- 5.3.5. Construction
- 5.3.6. Electrical and Electronics
- 5.3.7. Sports and Recreation
- 5.3.8. Other End-use Applications
- 5.4. Market Analysis, Insights and Forecast - by Region
- 5.4.1. Asia Pacific
- 5.4.2. North America
- 5.4.3. Europe
- 5.4.4. South America
- 5.4.5. Middle East and Africa
- 5.1. Market Analysis, Insights and Forecast - by Matrix Material
- 6. Global Composites Industry Analysis, Insights and Forecast, 2021-2033
- 6.1. Market Analysis, Insights and Forecast - by Matrix Material
- 6.1.1. Polymer Matrix Composites (PMC)
- 6.1.1.1. Thermoset Resins
- 6.1.1.2. Thermoplastic Resins
- 6.1.2. Ceramic/Carbon Matrix Composites (CMCs)
- 6.1.3. Other Matrices (Metal Matrix Composites)
- 6.1.1. Polymer Matrix Composites (PMC)
- 6.2. Market Analysis, Insights and Forecast - by Reinforcement Fiber
- 6.2.1. Glass Fiber
- 6.2.2. Carbon Fiber
- 6.2.3. Aramid Fiber
- 6.2.4. Other Fibers
- 6.3. Market Analysis, Insights and Forecast - by End-use Application
- 6.3.1. Automotive and Transportation
- 6.3.2. Wind Energy
- 6.3.3. Aerospace and Defense
- 6.3.4. Pipes and Tanks
- 6.3.5. Construction
- 6.3.6. Electrical and Electronics
- 6.3.7. Sports and Recreation
- 6.3.8. Other End-use Applications
- 6.1. Market Analysis, Insights and Forecast - by Matrix Material
- 7. Asia Pacific Composites Industry Analysis, Insights and Forecast, 2020-2032
- 7.1. Market Analysis, Insights and Forecast - by Matrix Material
- 7.1.1. Polymer Matrix Composites (PMC)
- 7.1.1.1. Thermoset Resins
- 7.1.1.2. Thermoplastic Resins
- 7.1.2. Ceramic/Carbon Matrix Composites (CMCs)
- 7.1.3. Other Matrices (Metal Matrix Composites)
- 7.1.1. Polymer Matrix Composites (PMC)
- 7.2. Market Analysis, Insights and Forecast - by Reinforcement Fiber
- 7.2.1. Glass Fiber
- 7.2.2. Carbon Fiber
- 7.2.3. Aramid Fiber
- 7.2.4. Other Fibers
- 7.3. Market Analysis, Insights and Forecast - by End-use Application
- 7.3.1. Automotive and Transportation
- 7.3.2. Wind Energy
- 7.3.3. Aerospace and Defense
- 7.3.4. Pipes and Tanks
- 7.3.5. Construction
- 7.3.6. Electrical and Electronics
- 7.3.7. Sports and Recreation
- 7.3.8. Other End-use Applications
- 7.1. Market Analysis, Insights and Forecast - by Matrix Material
- 8. North America Composites Industry Analysis, Insights and Forecast, 2020-2032
- 8.1. Market Analysis, Insights and Forecast - by Matrix Material
- 8.1.1. Polymer Matrix Composites (PMC)
- 8.1.1.1. Thermoset Resins
- 8.1.1.2. Thermoplastic Resins
- 8.1.2. Ceramic/Carbon Matrix Composites (CMCs)
- 8.1.3. Other Matrices (Metal Matrix Composites)
- 8.1.1. Polymer Matrix Composites (PMC)
- 8.2. Market Analysis, Insights and Forecast - by Reinforcement Fiber
- 8.2.1. Glass Fiber
- 8.2.2. Carbon Fiber
- 8.2.3. Aramid Fiber
- 8.2.4. Other Fibers
- 8.3. Market Analysis, Insights and Forecast - by End-use Application
- 8.3.1. Automotive and Transportation
- 8.3.2. Wind Energy
- 8.3.3. Aerospace and Defense
- 8.3.4. Pipes and Tanks
- 8.3.5. Construction
- 8.3.6. Electrical and Electronics
- 8.3.7. Sports and Recreation
- 8.3.8. Other End-use Applications
- 8.1. Market Analysis, Insights and Forecast - by Matrix Material
- 9. Europe Composites Industry Analysis, Insights and Forecast, 2020-2032
- 9.1. Market Analysis, Insights and Forecast - by Matrix Material
- 9.1.1. Polymer Matrix Composites (PMC)
- 9.1.1.1. Thermoset Resins
- 9.1.1.2. Thermoplastic Resins
- 9.1.2. Ceramic/Carbon Matrix Composites (CMCs)
- 9.1.3. Other Matrices (Metal Matrix Composites)
- 9.1.1. Polymer Matrix Composites (PMC)
- 9.2. Market Analysis, Insights and Forecast - by Reinforcement Fiber
- 9.2.1. Glass Fiber
- 9.2.2. Carbon Fiber
- 9.2.3. Aramid Fiber
- 9.2.4. Other Fibers
- 9.3. Market Analysis, Insights and Forecast - by End-use Application
- 9.3.1. Automotive and Transportation
- 9.3.2. Wind Energy
- 9.3.3. Aerospace and Defense
- 9.3.4. Pipes and Tanks
- 9.3.5. Construction
- 9.3.6. Electrical and Electronics
- 9.3.7. Sports and Recreation
- 9.3.8. Other End-use Applications
- 9.1. Market Analysis, Insights and Forecast - by Matrix Material
- 10. South America Composites Industry Analysis, Insights and Forecast, 2020-2032
- 10.1. Market Analysis, Insights and Forecast - by Matrix Material
- 10.1.1. Polymer Matrix Composites (PMC)
- 10.1.1.1. Thermoset Resins
- 10.1.1.2. Thermoplastic Resins
- 10.1.2. Ceramic/Carbon Matrix Composites (CMCs)
- 10.1.3. Other Matrices (Metal Matrix Composites)
- 10.1.1. Polymer Matrix Composites (PMC)
- 10.2. Market Analysis, Insights and Forecast - by Reinforcement Fiber
- 10.2.1. Glass Fiber
- 10.2.2. Carbon Fiber
- 10.2.3. Aramid Fiber
- 10.2.4. Other Fibers
- 10.3. Market Analysis, Insights and Forecast - by End-use Application
- 10.3.1. Automotive and Transportation
- 10.3.2. Wind Energy
- 10.3.3. Aerospace and Defense
- 10.3.4. Pipes and Tanks
- 10.3.5. Construction
- 10.3.6. Electrical and Electronics
- 10.3.7. Sports and Recreation
- 10.3.8. Other End-use Applications
- 10.1. Market Analysis, Insights and Forecast - by Matrix Material
- 11. Middle East and Africa Composites Industry Analysis, Insights and Forecast, 2020-2032
- 11.1. Market Analysis, Insights and Forecast - by Matrix Material
- 11.1.1. Polymer Matrix Composites (PMC)
- 11.1.1.1. Thermoset Resins
- 11.1.1.2. Thermoplastic Resins
- 11.1.2. Ceramic/Carbon Matrix Composites (CMCs)
- 11.1.3. Other Matrices (Metal Matrix Composites)
- 11.1.1. Polymer Matrix Composites (PMC)
- 11.2. Market Analysis, Insights and Forecast - by Reinforcement Fiber
- 11.2.1. Glass Fiber
- 11.2.2. Carbon Fiber
- 11.2.3. Aramid Fiber
- 11.2.4. Other Fibers
- 11.3. Market Analysis, Insights and Forecast - by End-use Application
- 11.3.1. Automotive and Transportation
- 11.3.2. Wind Energy
- 11.3.3. Aerospace and Defense
- 11.3.4. Pipes and Tanks
- 11.3.5. Construction
- 11.3.6. Electrical and Electronics
- 11.3.7. Sports and Recreation
- 11.3.8. Other End-use Applications
- 11.1. Market Analysis, Insights and Forecast - by Matrix Material
- 12. Competitive Analysis
- 12.1. Company Profiles
- 12.1.1 SGL Carbon
- 12.1.1.1. Company Overview
- 12.1.1.2. Products
- 12.1.1.3. Company Financials
- 12.1.1.4. SWOT Analysis
- 12.1.2 COMPOSITES UNIVERSAL GROUP
- 12.1.2.1. Company Overview
- 12.1.2.2. Products
- 12.1.2.3. Company Financials
- 12.1.2.4. SWOT Analysis
- 12.1.3 Solvay
- 12.1.3.1. Company Overview
- 12.1.3.2. Products
- 12.1.3.3. Company Financials
- 12.1.3.4. SWOT Analysis
- 12.1.4 3M
- 12.1.4.1. Company Overview
- 12.1.4.2. Products
- 12.1.4.3. Company Financials
- 12.1.4.4. SWOT Analysis
- 12.1.5 DIT B V
- 12.1.5.1. Company Overview
- 12.1.5.2. Products
- 12.1.5.3. Company Financials
- 12.1.5.4. SWOT Analysis
- 12.1.6 Owens Corning
- 12.1.6.1. Company Overview
- 12.1.6.2. Products
- 12.1.6.3. Company Financials
- 12.1.6.4. SWOT Analysis
- 12.1.7 DuPont
- 12.1.7.1. Company Overview
- 12.1.7.2. Products
- 12.1.7.3. Company Financials
- 12.1.7.4. SWOT Analysis
- 12.1.8 TORAY INDUSTRIES INC *List Not Exhaustive
- 12.1.8.1. Company Overview
- 12.1.8.2. Products
- 12.1.8.3. Company Financials
- 12.1.8.4. SWOT Analysis
- 12.1.9 Mitsubishi Chemical Group Corporation
- 12.1.9.1. Company Overview
- 12.1.9.2. Products
- 12.1.9.3. Company Financials
- 12.1.9.4. SWOT Analysis
- 12.1.10 Hexcel Corporation
- 12.1.10.1. Company Overview
- 12.1.10.2. Products
- 12.1.10.3. Company Financials
- 12.1.10.4. SWOT Analysis
- 12.1.11 TEIJIN LIMITED
- 12.1.11.1. Company Overview
- 12.1.11.2. Products
- 12.1.11.3. Company Financials
- 12.1.11.4. SWOT Analysis
- 12.1.12 Materion Corporation
- 12.1.12.1. Company Overview
- 12.1.12.2. Products
- 12.1.12.3. Company Financials
- 12.1.12.4. SWOT Analysis
- 12.1.1 SGL Carbon
- 12.2. Market Entropy
- 12.2.1 Company's Key Areas Served
- 12.2.2 Recent Developments
- 12.3. Company Market Share Analysis 2025
- 12.3.1 Top 5 Companies Market Share Analysis
- 12.3.2 Top 3 Companies Market Share Analysis
- 12.4. List of Potential Customers
- 13. Research Methodology
List of Figures
- Figure 1: Global Composites Industry Revenue Breakdown (Million, %) by Region 2025 & 2033
- Figure 2: Asia Pacific Composites Industry Revenue (Million), by Matrix Material 2025 & 2033
- Figure 3: Asia Pacific Composites Industry Revenue Share (%), by Matrix Material 2025 & 2033
- Figure 4: Asia Pacific Composites Industry Revenue (Million), by Reinforcement Fiber 2025 & 2033
- Figure 5: Asia Pacific Composites Industry Revenue Share (%), by Reinforcement Fiber 2025 & 2033
- Figure 6: Asia Pacific Composites Industry Revenue (Million), by End-use Application 2025 & 2033
- Figure 7: Asia Pacific Composites Industry Revenue Share (%), by End-use Application 2025 & 2033
- Figure 8: Asia Pacific Composites Industry Revenue (Million), by Country 2025 & 2033
- Figure 9: Asia Pacific Composites Industry Revenue Share (%), by Country 2025 & 2033
- Figure 10: North America Composites Industry Revenue (Million), by Matrix Material 2025 & 2033
- Figure 11: North America Composites Industry Revenue Share (%), by Matrix Material 2025 & 2033
- Figure 12: North America Composites Industry Revenue (Million), by Reinforcement Fiber 2025 & 2033
- Figure 13: North America Composites Industry Revenue Share (%), by Reinforcement Fiber 2025 & 2033
- Figure 14: North America Composites Industry Revenue (Million), by End-use Application 2025 & 2033
- Figure 15: North America Composites Industry Revenue Share (%), by End-use Application 2025 & 2033
- Figure 16: North America Composites Industry Revenue (Million), by Country 2025 & 2033
- Figure 17: North America Composites Industry Revenue Share (%), by Country 2025 & 2033
- Figure 18: Europe Composites Industry Revenue (Million), by Matrix Material 2025 & 2033
- Figure 19: Europe Composites Industry Revenue Share (%), by Matrix Material 2025 & 2033
- Figure 20: Europe Composites Industry Revenue (Million), by Reinforcement Fiber 2025 & 2033
- Figure 21: Europe Composites Industry Revenue Share (%), by Reinforcement Fiber 2025 & 2033
- Figure 22: Europe Composites Industry Revenue (Million), by End-use Application 2025 & 2033
- Figure 23: Europe Composites Industry Revenue Share (%), by End-use Application 2025 & 2033
- Figure 24: Europe Composites Industry Revenue (Million), by Country 2025 & 2033
- Figure 25: Europe Composites Industry Revenue Share (%), by Country 2025 & 2033
- Figure 26: South America Composites Industry Revenue (Million), by Matrix Material 2025 & 2033
- Figure 27: South America Composites Industry Revenue Share (%), by Matrix Material 2025 & 2033
- Figure 28: South America Composites Industry Revenue (Million), by Reinforcement Fiber 2025 & 2033
- Figure 29: South America Composites Industry Revenue Share (%), by Reinforcement Fiber 2025 & 2033
- Figure 30: South America Composites Industry Revenue (Million), by End-use Application 2025 & 2033
- Figure 31: South America Composites Industry Revenue Share (%), by End-use Application 2025 & 2033
- Figure 32: South America Composites Industry Revenue (Million), by Country 2025 & 2033
- Figure 33: South America Composites Industry Revenue Share (%), by Country 2025 & 2033
- Figure 34: Middle East and Africa Composites Industry Revenue (Million), by Matrix Material 2025 & 2033
- Figure 35: Middle East and Africa Composites Industry Revenue Share (%), by Matrix Material 2025 & 2033
- Figure 36: Middle East and Africa Composites Industry Revenue (Million), by Reinforcement Fiber 2025 & 2033
- Figure 37: Middle East and Africa Composites Industry Revenue Share (%), by Reinforcement Fiber 2025 & 2033
- Figure 38: Middle East and Africa Composites Industry Revenue (Million), by End-use Application 2025 & 2033
- Figure 39: Middle East and Africa Composites Industry Revenue Share (%), by End-use Application 2025 & 2033
- Figure 40: Middle East and Africa Composites Industry Revenue (Million), by Country 2025 & 2033
- Figure 41: Middle East and Africa Composites Industry Revenue Share (%), by Country 2025 & 2033
List of Tables
- Table 1: Global Composites Industry Revenue Million Forecast, by Matrix Material 2020 & 2033
- Table 2: Global Composites Industry Revenue Million Forecast, by Reinforcement Fiber 2020 & 2033
- Table 3: Global Composites Industry Revenue Million Forecast, by End-use Application 2020 & 2033
- Table 4: Global Composites Industry Revenue Million Forecast, by Region 2020 & 2033
- Table 5: Global Composites Industry Revenue Million Forecast, by Matrix Material 2020 & 2033
- Table 6: Global Composites Industry Revenue Million Forecast, by Reinforcement Fiber 2020 & 2033
- Table 7: Global Composites Industry Revenue Million Forecast, by End-use Application 2020 & 2033
- Table 8: Global Composites Industry Revenue Million Forecast, by Country 2020 & 2033
- Table 9: China Composites Industry Revenue (Million) Forecast, by Application 2020 & 2033
- Table 10: India Composites Industry Revenue (Million) Forecast, by Application 2020 & 2033
- Table 11: Japan Composites Industry Revenue (Million) Forecast, by Application 2020 & 2033
- Table 12: South Korea Composites Industry Revenue (Million) Forecast, by Application 2020 & 2033
- Table 13: Thailand Composites Industry Revenue (Million) Forecast, by Application 2020 & 2033
- Table 14: Malaysia Composites Industry Revenue (Million) Forecast, by Application 2020 & 2033
- Table 15: Indonesia Composites Industry Revenue (Million) Forecast, by Application 2020 & 2033
- Table 16: Vietnam Composites Industry Revenue (Million) Forecast, by Application 2020 & 2033
- Table 17: Rest of Asia Pacific Composites Industry Revenue (Million) Forecast, by Application 2020 & 2033
- Table 18: Global Composites Industry Revenue Million Forecast, by Matrix Material 2020 & 2033
- Table 19: Global Composites Industry Revenue Million Forecast, by Reinforcement Fiber 2020 & 2033
- Table 20: Global Composites Industry Revenue Million Forecast, by End-use Application 2020 & 2033
- Table 21: Global Composites Industry Revenue Million Forecast, by Country 2020 & 2033
- Table 22: United States Composites Industry Revenue (Million) Forecast, by Application 2020 & 2033
- Table 23: Canada Composites Industry Revenue (Million) Forecast, by Application 2020 & 2033
- Table 24: Mexico Composites Industry Revenue (Million) Forecast, by Application 2020 & 2033
- Table 25: Global Composites Industry Revenue Million Forecast, by Matrix Material 2020 & 2033
- Table 26: Global Composites Industry Revenue Million Forecast, by Reinforcement Fiber 2020 & 2033
- Table 27: Global Composites Industry Revenue Million Forecast, by End-use Application 2020 & 2033
- Table 28: Global Composites Industry Revenue Million Forecast, by Country 2020 & 2033
- Table 29: Germany Composites Industry Revenue (Million) Forecast, by Application 2020 & 2033
- Table 30: United Kingdom Composites Industry Revenue (Million) Forecast, by Application 2020 & 2033
- Table 31: France Composites Industry Revenue (Million) Forecast, by Application 2020 & 2033
- Table 32: Italy Composites Industry Revenue (Million) Forecast, by Application 2020 & 2033
- Table 33: Spain Composites Industry Revenue (Million) Forecast, by Application 2020 & 2033
- Table 34: Russia Composites Industry Revenue (Million) Forecast, by Application 2020 & 2033
- Table 35: NORDIC Countries Composites Industry Revenue (Million) Forecast, by Application 2020 & 2033
- Table 36: Turkey Composites Industry Revenue (Million) Forecast, by Application 2020 & 2033
- Table 37: Rest of Europe Composites Industry Revenue (Million) Forecast, by Application 2020 & 2033
- Table 38: Global Composites Industry Revenue Million Forecast, by Matrix Material 2020 & 2033
- Table 39: Global Composites Industry Revenue Million Forecast, by Reinforcement Fiber 2020 & 2033
- Table 40: Global Composites Industry Revenue Million Forecast, by End-use Application 2020 & 2033
- Table 41: Global Composites Industry Revenue Million Forecast, by Country 2020 & 2033
- Table 42: Brazil Composites Industry Revenue (Million) Forecast, by Application 2020 & 2033
- Table 43: Argentina Composites Industry Revenue (Million) Forecast, by Application 2020 & 2033
- Table 44: Colombia Composites Industry Revenue (Million) Forecast, by Application 2020 & 2033
- Table 45: Rest of South America Composites Industry Revenue (Million) Forecast, by Application 2020 & 2033
- Table 46: Global Composites Industry Revenue Million Forecast, by Matrix Material 2020 & 2033
- Table 47: Global Composites Industry Revenue Million Forecast, by Reinforcement Fiber 2020 & 2033
- Table 48: Global Composites Industry Revenue Million Forecast, by End-use Application 2020 & 2033
- Table 49: Global Composites Industry Revenue Million Forecast, by Country 2020 & 2033
- Table 50: Saudi Arabia Composites Industry Revenue (Million) Forecast, by Application 2020 & 2033
- Table 51: South Africa Composites Industry Revenue (Million) Forecast, by Application 2020 & 2033
- Table 52: Nigeria Composites Industry Revenue (Million) Forecast, by Application 2020 & 2033
- Table 53: Qatar Composites Industry Revenue (Million) Forecast, by Application 2020 & 2033
- Table 54: Egypt Composites Industry Revenue (Million) Forecast, by Application 2020 & 2033
- Table 55: United Arab Emirates Composites Industry Revenue (Million) Forecast, by Application 2020 & 2033
- Table 56: Rest of Middle East and Africa Composites Industry Revenue (Million) Forecast, by Application 2020 & 2033
Frequently Asked Questions
1. What is the projected Compound Annual Growth Rate (CAGR) of the Composites Industry?
The projected CAGR is approximately > 5.00%.
2. Which companies are prominent players in the Composites Industry?
Key companies in the market include SGL Carbon, COMPOSITES UNIVERSAL GROUP, Solvay, 3M, DIT B V, Owens Corning, DuPont, TORAY INDUSTRIES INC *List Not Exhaustive, Mitsubishi Chemical Group Corporation, Hexcel Corporation, TEIJIN LIMITED, Materion Corporation.
3. What are the main segments of the Composites Industry?
The market segments include Matrix Material, Reinforcement Fiber, End-use Application.
4. Can you provide details about the market size?
The market size is estimated to be USD 45.96 Million as of 2022.
5. What are some drivers contributing to market growth?
Technological Advancement in the Field of Material Science; Increasing Use of Composites in the Aerospace and Defense Industry; Other Drivers.
6. What are the notable trends driving market growth?
Rising Demand from Transportation sector.
7. Are there any restraints impacting market growth?
High Cost of Composite Materials.
8. Can you provide examples of recent developments in the market?
February 2024 - Owens Corning acquired USD 3.9 billion of Masonite. This acquisition would strengthen the company's position in building and construction materials and the glass reinforcement business within its Composites segment.
9. What pricing options are available for accessing the report?
Pricing options include single-user, multi-user, and enterprise licenses priced at USD 4750, USD 5250, and USD 8750 respectively.
10. Is the market size provided in terms of value or volume?
The market size is provided in terms of value, measured in Million.
11. Are there any specific market keywords associated with the report?
Yes, the market keyword associated with the report is "Composites Industry," which aids in identifying and referencing the specific market segment covered.
12. How do I determine which pricing option suits my needs best?
The pricing options vary based on user requirements and access needs. Individual users may opt for single-user licenses, while businesses requiring broader access may choose multi-user or enterprise licenses for cost-effective access to the report.
13. Are there any additional resources or data provided in the Composites Industry report?
While the report offers comprehensive insights, it's advisable to review the specific contents or supplementary materials provided to ascertain if additional resources or data are available.
14. How can I stay updated on further developments or reports in the Composites Industry?
To stay informed about further developments, trends, and reports in the Composites Industry, consider subscribing to industry newsletters, following relevant companies and organizations, or regularly checking reputable industry news sources and publications.
Methodology
Step 1 - Identification of Relevant Samples Size from Population Database


Step 2 - Approaches for Defining Global Market Size (Value, Volume* & Price*)

Note*: In applicable scenarios
Step 3 - Data Sources
Primary Research
- Web Analytics
- Survey Reports
- Research Institute
- Latest Research Reports
- Opinion Leaders
Secondary Research
- Annual Reports
- White Paper
- Latest Press Release
- Industry Association
- Paid Database
- Investor Presentations

Step 4 - Data Triangulation
Involves using different sources of information in order to increase the validity of a study
These sources are likely to be stakeholders in a program - participants, other researchers, program staff, other community members, and so on.
Then we put all data in single framework & apply various statistical tools to find out the dynamic on the market.
During the analysis stage, feedback from the stakeholder groups would be compared to determine areas of agreement as well as areas of divergence