

Key Insights
The global compression socks and hosiery market is experiencing robust growth, driven by increasing awareness of the benefits of compression therapy for various health conditions. The rising prevalence of venous disorders, such as varicose veins and deep vein thrombosis (DVT), coupled with a growing aging population susceptible to these conditions, fuels significant demand. Furthermore, the increasing popularity of athletic activities and the need for performance enhancement among athletes are contributing to market expansion. Technological advancements leading to improved comfort, durability, and aesthetic appeal of compression garments also play a crucial role. The market is segmented by product type (e.g., knee-high, thigh-high, full-length), compression level, and end-user (medical, athletic, general wellness). Key players such as Medi, Venosan, and SIGVARIS are driving innovation and expanding their product portfolios to cater to diverse needs. While pricing and the potential for substitute products represent challenges, the overall market outlook remains positive due to continuous innovation and a strong focus on customer needs.
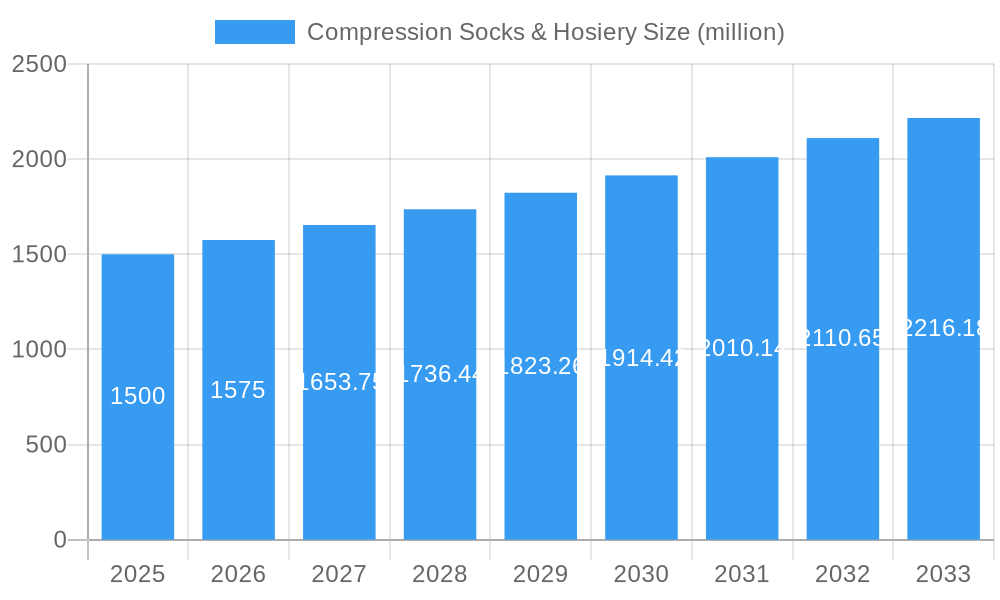
Compression Socks & Hosiery Market Size (In Billion)
The market’s growth is projected to remain consistent in the coming years. A conservative estimate, considering factors like potential economic fluctuations and varying levels of healthcare expenditure across regions, suggests a Compound Annual Growth Rate (CAGR) of approximately 5-7% between 2025 and 2033. This growth will be further propelled by the increasing adoption of compression therapy in post-surgical care and the development of specialized compression garments for specific medical conditions. Regional variations will likely exist, with developed markets in North America and Europe maintaining a substantial share, followed by gradual expansion in emerging economies fueled by rising disposable incomes and healthcare infrastructure improvements. Continued efforts in research and development focused on materials science and improved design features will remain crucial for driving innovation and growth within the market.
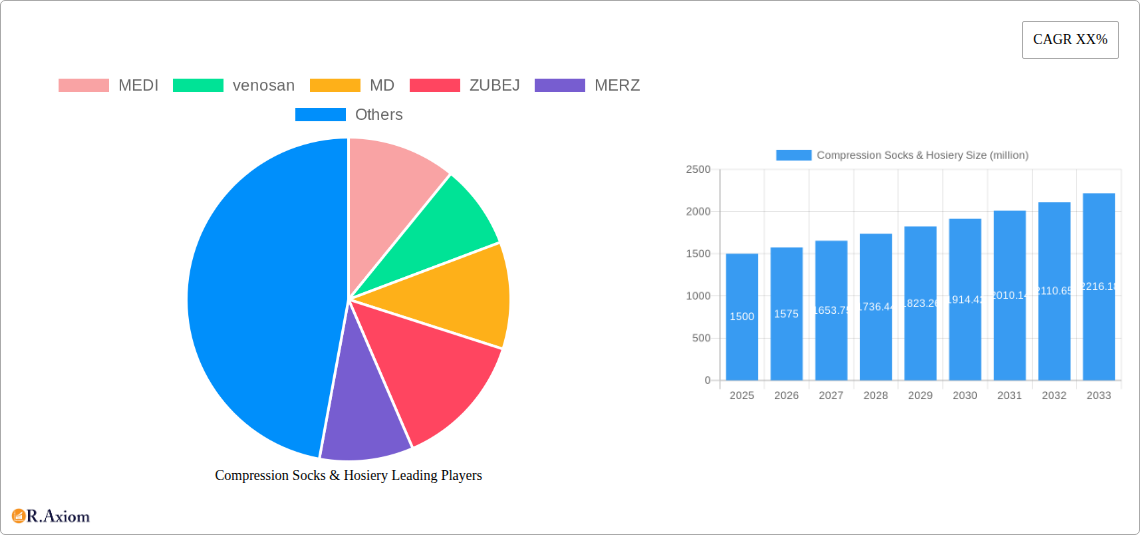
Compression Socks & Hosiery Company Market Share
Compression Socks & Hosiery Market Report: 2019-2033
This comprehensive report provides an in-depth analysis of the global compression socks & hosiery market, offering invaluable insights for industry stakeholders, investors, and businesses. The study period spans 2019-2033, with 2025 serving as the base and estimated year. The forecast period covers 2025-2033, while the historical period encompasses 2019-2024. The report leverages rigorous research methodologies to present a detailed picture of market trends, growth drivers, challenges, and opportunities, along with a competitive landscape analysis featuring key players like MEDI, venosan, MD, ZUBEJ, MERZ, 2XU, BSN medical, Dr. Scholl's, Celeste Stein, souermei, Truform, ASICS, and SIGVARIS. The market size is predicted to reach xx million by 2033.
Compression Socks & Hosiery Market Concentration & Innovation
The global compression socks & hosiery market exhibits a moderately concentrated landscape, with a few major players holding significant market share. MEDI, SIGVARIS, and BSN medical, for instance, collectively account for an estimated xx% of the market in 2025. Innovation is a key driver, with companies focusing on technological advancements like improved fabric technologies (e.g., seamless knitting, antimicrobial treatments), enhanced compression levels tailored to specific medical needs and athletic performance, and smart features for monitoring usage and providing feedback. Regulatory frameworks vary across regions, influencing product approvals and labeling requirements. The market faces competition from substitute products like elastic bandages and supportive footwear, impacting market penetration in certain segments. End-user trends show increasing demand for specialized socks catering to specific conditions like diabetes and venous insufficiency, alongside growth in the athletic and fashion segments. The estimated value of M&A activities in the period 2019-2024 is approximately xx million, indicating consolidation within the industry.
- Market Share (2025): MEDI (xx%), SIGVARIS (xx%), BSN medical (xx%), Others (xx%)
- M&A Deal Value (2019-2024): xx million
- Key Innovation Areas: Smart compression technologies, improved materials, targeted therapeutic applications.
Compression Socks & Hosiery Industry Trends & Insights
The compression socks & hosiery market is experiencing robust growth, driven by factors like increasing prevalence of chronic venous insufficiency (CVI), rising awareness of the benefits of compression therapy, growing participation in sports and athletic activities, and a shift toward preventive healthcare. The market is expected to exhibit a CAGR of xx% during the forecast period (2025-2033). Technological advancements in materials science and manufacturing processes are significantly impacting product quality, durability, and comfort. Consumer preferences are increasingly influenced by factors like aesthetics, comfort, and ease of use, driving demand for fashionable and functional products. Competitive dynamics are characterized by both innovation-driven competition and price-based competition, particularly within the mass-market segments. The market penetration rate of compression socks amongst target demographics (e.g., athletes, medical patients) is currently estimated at approximately xx%, with significant growth potential in untapped markets.
Dominant Markets & Segments in Compression Socks & Hosiery
The North American market currently holds a dominant position in the global compression socks & hosiery market, primarily driven by high healthcare expenditure, strong regulatory support, and a large elderly population susceptible to CVI. Europe follows closely, exhibiting strong growth fueled by increasing awareness and adoption of compression therapy.
- Key Drivers for North American Dominance:
- High healthcare expenditure.
- Strong regulatory support for medical compression garments.
- Large aging population with increased prevalence of venous diseases.
- Well-established healthcare infrastructure.
- Key Drivers for European Growth:
- Rising awareness of compression therapy benefits.
- Favorable healthcare policies supporting compression usage.
- Growing prevalence of sedentary lifestyles leading to venous issues.
The medical segment (therapeutic compression socks) currently represents the largest market share, driven by the growing prevalence of medical conditions requiring compression therapy. The athletic segment is witnessing rapid growth driven by increasing athlete awareness of performance enhancement benefits.
Compression Socks & Hosiery Product Developments
Recent product innovations focus on enhanced comfort, breathability, and durability through the use of advanced materials like merino wool blends and seamless knitting techniques. The integration of smart technologies, such as embedded sensors to monitor compression levels and user activity, is gaining traction, catering to the growing demand for personalized healthcare solutions. These developments provide competitive advantages by improving product performance, user experience, and compliance.
Report Scope & Segmentation Analysis
The report segments the market by product type (knee-high, thigh-high, pantyhose), compression level (light, moderate, firm), end-user (medical, athletic, general public), and geography (North America, Europe, Asia Pacific, etc.). Growth projections vary across segments, with the medical segment anticipated to maintain robust growth due to rising prevalence of related medical conditions. Market size estimates and competitive dynamics are analyzed for each segment. Market size projections for each segment are outlined in the detailed report.
Key Drivers of Compression Socks & Hosiery Growth
Several factors drive market growth, including the increasing prevalence of chronic venous diseases (like varicose veins and deep vein thrombosis), rising awareness of compression therapy benefits, a growing aging population, increased participation in sports and fitness activities, and technological advancements that enhance product performance and comfort. Government initiatives promoting preventive healthcare and positive reimbursement policies contribute significantly to growth, particularly in developed markets.
Challenges in the Compression Socks & Hosiery Sector
The industry faces challenges including fluctuating raw material costs, intense competition, stringent regulatory requirements for medical-grade compression socks, and the potential for counterfeit products to erode market confidence. Supply chain disruptions can also impact production and distribution, particularly given the increasing reliance on global supply networks. These factors can create pricing pressures and hinder market growth.
Emerging Opportunities in Compression Socks & Hosiery
Emerging opportunities lie in developing innovative products with enhanced features (e.g., smart compression, targeted therapies), expanding into untapped markets (e.g., emerging economies), and catering to the growing demand for personalized healthcare solutions. The focus on sustainable and eco-friendly materials offers a significant growth avenue for environmentally conscious consumers. Further expansion into niche applications, such as post-surgical recovery and lymphatic drainage, presents additional opportunities for growth.
Leading Players in the Compression Socks & Hosiery Market
- MEDI
- venosan
- MD
- ZUBEJ
- MERZ
- 2XU
- BSN medical
- Dr.Scholl's
- Celeste Stein
- souermei
- Truform
- ASICS
- SIGVARIS
Key Developments in Compression Socks & Hosiery Industry
- 2022 Q3: MEDI launches a new line of smart compression socks with integrated sensors.
- 2023 Q1: SIGVARIS announces a strategic partnership to expand distribution in Asia.
- 2024 Q2: BSN medical acquires a smaller competitor, strengthening its market position.
- 2024 Q4: 2XU releases a new range of compression socks targeted at marathon runners. (Further details on other key developments are provided in the full report).
Strategic Outlook for Compression Socks & Hosiery Market
The compression socks & hosiery market is poised for continued growth, driven by the aforementioned factors. Strategic opportunities exist in product diversification, expansion into new markets, and the adoption of sustainable manufacturing practices. Companies with a focus on innovation, strong brand building, and effective distribution networks are best positioned to capitalize on future market potential. The integration of digital health technologies and personalized medicine will play a crucial role in shaping the market landscape in the coming years.
Compression Socks & Hosiery Segmentation
-
1. Application
- 1.1. Men
- 1.2. Women
- 1.3. Child
-
2. Types
- 2.1. Compression Socks
- 2.2. Compression Hosiery
Compression Socks & Hosiery Segmentation By Geography
-
1. North America
- 1.1. United States
- 1.2. Canada
- 1.3. Mexico
-
2. South America
- 2.1. Brazil
- 2.2. Argentina
- 2.3. Rest of South America
-
3. Europe
- 3.1. United Kingdom
- 3.2. Germany
- 3.3. France
- 3.4. Italy
- 3.5. Spain
- 3.6. Russia
- 3.7. Benelux
- 3.8. Nordics
- 3.9. Rest of Europe
-
4. Middle East & Africa
- 4.1. Turkey
- 4.2. Israel
- 4.3. GCC
- 4.4. North Africa
- 4.5. South Africa
- 4.6. Rest of Middle East & Africa
-
5. Asia Pacific
- 5.1. China
- 5.2. India
- 5.3. Japan
- 5.4. South Korea
- 5.5. ASEAN
- 5.6. Oceania
- 5.7. Rest of Asia Pacific

Compression Socks & Hosiery Regional Market Share
Geographic Coverage of Compression Socks & Hosiery
Compression Socks & Hosiery REPORT HIGHLIGHTS
| Aspects | Details |
|---|---|
| Study Period | 2020-2034 |
| Base Year | 2025 |
| Estimated Year | 2026 |
| Forecast Period | 2026-2034 |
| Historical Period | 2020-2025 |
| Growth Rate | CAGR of XX% from 2020-2034 |
| Segmentation |
|
Table of Contents
- 1. Introduction
- 1.1. Research Scope
- 1.2. Market Segmentation
- 1.3. Research Methodology
- 1.4. Definitions and Assumptions
- 2. Executive Summary
- 2.1. Introduction
- 3. Market Dynamics
- 3.1. Introduction
- 3.2. Market Drivers
- 3.3. Market Restrains
- 3.4. Market Trends
- 4. Market Factor Analysis
- 4.1. Porters Five Forces
- 4.2. Supply/Value Chain
- 4.3. PESTEL analysis
- 4.4. Market Entropy
- 4.5. Patent/Trademark Analysis
- 5. Global Compression Socks & Hosiery Analysis, Insights and Forecast, 2020-2032
- 5.1. Market Analysis, Insights and Forecast - by Application
- 5.1.1. Men
- 5.1.2. Women
- 5.1.3. Child
- 5.2. Market Analysis, Insights and Forecast - by Types
- 5.2.1. Compression Socks
- 5.2.2. Compression Hosiery
- 5.3. Market Analysis, Insights and Forecast - by Region
- 5.3.1. North America
- 5.3.2. South America
- 5.3.3. Europe
- 5.3.4. Middle East & Africa
- 5.3.5. Asia Pacific
- 5.1. Market Analysis, Insights and Forecast - by Application
- 6. North America Compression Socks & Hosiery Analysis, Insights and Forecast, 2020-2032
- 6.1. Market Analysis, Insights and Forecast - by Application
- 6.1.1. Men
- 6.1.2. Women
- 6.1.3. Child
- 6.2. Market Analysis, Insights and Forecast - by Types
- 6.2.1. Compression Socks
- 6.2.2. Compression Hosiery
- 6.1. Market Analysis, Insights and Forecast - by Application
- 7. South America Compression Socks & Hosiery Analysis, Insights and Forecast, 2020-2032
- 7.1. Market Analysis, Insights and Forecast - by Application
- 7.1.1. Men
- 7.1.2. Women
- 7.1.3. Child
- 7.2. Market Analysis, Insights and Forecast - by Types
- 7.2.1. Compression Socks
- 7.2.2. Compression Hosiery
- 7.1. Market Analysis, Insights and Forecast - by Application
- 8. Europe Compression Socks & Hosiery Analysis, Insights and Forecast, 2020-2032
- 8.1. Market Analysis, Insights and Forecast - by Application
- 8.1.1. Men
- 8.1.2. Women
- 8.1.3. Child
- 8.2. Market Analysis, Insights and Forecast - by Types
- 8.2.1. Compression Socks
- 8.2.2. Compression Hosiery
- 8.1. Market Analysis, Insights and Forecast - by Application
- 9. Middle East & Africa Compression Socks & Hosiery Analysis, Insights and Forecast, 2020-2032
- 9.1. Market Analysis, Insights and Forecast - by Application
- 9.1.1. Men
- 9.1.2. Women
- 9.1.3. Child
- 9.2. Market Analysis, Insights and Forecast - by Types
- 9.2.1. Compression Socks
- 9.2.2. Compression Hosiery
- 9.1. Market Analysis, Insights and Forecast - by Application
- 10. Asia Pacific Compression Socks & Hosiery Analysis, Insights and Forecast, 2020-2032
- 10.1. Market Analysis, Insights and Forecast - by Application
- 10.1.1. Men
- 10.1.2. Women
- 10.1.3. Child
- 10.2. Market Analysis, Insights and Forecast - by Types
- 10.2.1. Compression Socks
- 10.2.2. Compression Hosiery
- 10.1. Market Analysis, Insights and Forecast - by Application
- 11. Competitive Analysis
- 11.1. Global Market Share Analysis 2025
- 11.2. Company Profiles
- 11.2.1 MEDI
- 11.2.1.1. Overview
- 11.2.1.2. Products
- 11.2.1.3. SWOT Analysis
- 11.2.1.4. Recent Developments
- 11.2.1.5. Financials (Based on Availability)
- 11.2.2 venosan
- 11.2.2.1. Overview
- 11.2.2.2. Products
- 11.2.2.3. SWOT Analysis
- 11.2.2.4. Recent Developments
- 11.2.2.5. Financials (Based on Availability)
- 11.2.3 MD
- 11.2.3.1. Overview
- 11.2.3.2. Products
- 11.2.3.3. SWOT Analysis
- 11.2.3.4. Recent Developments
- 11.2.3.5. Financials (Based on Availability)
- 11.2.4 ZUBEJ
- 11.2.4.1. Overview
- 11.2.4.2. Products
- 11.2.4.3. SWOT Analysis
- 11.2.4.4. Recent Developments
- 11.2.4.5. Financials (Based on Availability)
- 11.2.5 MERZ
- 11.2.5.1. Overview
- 11.2.5.2. Products
- 11.2.5.3. SWOT Analysis
- 11.2.5.4. Recent Developments
- 11.2.5.5. Financials (Based on Availability)
- 11.2.6 2XU
- 11.2.6.1. Overview
- 11.2.6.2. Products
- 11.2.6.3. SWOT Analysis
- 11.2.6.4. Recent Developments
- 11.2.6.5. Financials (Based on Availability)
- 11.2.7 BSN medical
- 11.2.7.1. Overview
- 11.2.7.2. Products
- 11.2.7.3. SWOT Analysis
- 11.2.7.4. Recent Developments
- 11.2.7.5. Financials (Based on Availability)
- 11.2.8 Dr.Scholl's
- 11.2.8.1. Overview
- 11.2.8.2. Products
- 11.2.8.3. SWOT Analysis
- 11.2.8.4. Recent Developments
- 11.2.8.5. Financials (Based on Availability)
- 11.2.9 Celeste Stein
- 11.2.9.1. Overview
- 11.2.9.2. Products
- 11.2.9.3. SWOT Analysis
- 11.2.9.4. Recent Developments
- 11.2.9.5. Financials (Based on Availability)
- 11.2.10 souermei
- 11.2.10.1. Overview
- 11.2.10.2. Products
- 11.2.10.3. SWOT Analysis
- 11.2.10.4. Recent Developments
- 11.2.10.5. Financials (Based on Availability)
- 11.2.11 Truform
- 11.2.11.1. Overview
- 11.2.11.2. Products
- 11.2.11.3. SWOT Analysis
- 11.2.11.4. Recent Developments
- 11.2.11.5. Financials (Based on Availability)
- 11.2.12 ASICS
- 11.2.12.1. Overview
- 11.2.12.2. Products
- 11.2.12.3. SWOT Analysis
- 11.2.12.4. Recent Developments
- 11.2.12.5. Financials (Based on Availability)
- 11.2.13 SIGVARIS
- 11.2.13.1. Overview
- 11.2.13.2. Products
- 11.2.13.3. SWOT Analysis
- 11.2.13.4. Recent Developments
- 11.2.13.5. Financials (Based on Availability)
- 11.2.1 MEDI
List of Figures
- Figure 1: Global Compression Socks & Hosiery Revenue Breakdown (million, %) by Region 2025 & 2033
- Figure 2: Global Compression Socks & Hosiery Volume Breakdown (K, %) by Region 2025 & 2033
- Figure 3: North America Compression Socks & Hosiery Revenue (million), by Application 2025 & 2033
- Figure 4: North America Compression Socks & Hosiery Volume (K), by Application 2025 & 2033
- Figure 5: North America Compression Socks & Hosiery Revenue Share (%), by Application 2025 & 2033
- Figure 6: North America Compression Socks & Hosiery Volume Share (%), by Application 2025 & 2033
- Figure 7: North America Compression Socks & Hosiery Revenue (million), by Types 2025 & 2033
- Figure 8: North America Compression Socks & Hosiery Volume (K), by Types 2025 & 2033
- Figure 9: North America Compression Socks & Hosiery Revenue Share (%), by Types 2025 & 2033
- Figure 10: North America Compression Socks & Hosiery Volume Share (%), by Types 2025 & 2033
- Figure 11: North America Compression Socks & Hosiery Revenue (million), by Country 2025 & 2033
- Figure 12: North America Compression Socks & Hosiery Volume (K), by Country 2025 & 2033
- Figure 13: North America Compression Socks & Hosiery Revenue Share (%), by Country 2025 & 2033
- Figure 14: North America Compression Socks & Hosiery Volume Share (%), by Country 2025 & 2033
- Figure 15: South America Compression Socks & Hosiery Revenue (million), by Application 2025 & 2033
- Figure 16: South America Compression Socks & Hosiery Volume (K), by Application 2025 & 2033
- Figure 17: South America Compression Socks & Hosiery Revenue Share (%), by Application 2025 & 2033
- Figure 18: South America Compression Socks & Hosiery Volume Share (%), by Application 2025 & 2033
- Figure 19: South America Compression Socks & Hosiery Revenue (million), by Types 2025 & 2033
- Figure 20: South America Compression Socks & Hosiery Volume (K), by Types 2025 & 2033
- Figure 21: South America Compression Socks & Hosiery Revenue Share (%), by Types 2025 & 2033
- Figure 22: South America Compression Socks & Hosiery Volume Share (%), by Types 2025 & 2033
- Figure 23: South America Compression Socks & Hosiery Revenue (million), by Country 2025 & 2033
- Figure 24: South America Compression Socks & Hosiery Volume (K), by Country 2025 & 2033
- Figure 25: South America Compression Socks & Hosiery Revenue Share (%), by Country 2025 & 2033
- Figure 26: South America Compression Socks & Hosiery Volume Share (%), by Country 2025 & 2033
- Figure 27: Europe Compression Socks & Hosiery Revenue (million), by Application 2025 & 2033
- Figure 28: Europe Compression Socks & Hosiery Volume (K), by Application 2025 & 2033
- Figure 29: Europe Compression Socks & Hosiery Revenue Share (%), by Application 2025 & 2033
- Figure 30: Europe Compression Socks & Hosiery Volume Share (%), by Application 2025 & 2033
- Figure 31: Europe Compression Socks & Hosiery Revenue (million), by Types 2025 & 2033
- Figure 32: Europe Compression Socks & Hosiery Volume (K), by Types 2025 & 2033
- Figure 33: Europe Compression Socks & Hosiery Revenue Share (%), by Types 2025 & 2033
- Figure 34: Europe Compression Socks & Hosiery Volume Share (%), by Types 2025 & 2033
- Figure 35: Europe Compression Socks & Hosiery Revenue (million), by Country 2025 & 2033
- Figure 36: Europe Compression Socks & Hosiery Volume (K), by Country 2025 & 2033
- Figure 37: Europe Compression Socks & Hosiery Revenue Share (%), by Country 2025 & 2033
- Figure 38: Europe Compression Socks & Hosiery Volume Share (%), by Country 2025 & 2033
- Figure 39: Middle East & Africa Compression Socks & Hosiery Revenue (million), by Application 2025 & 2033
- Figure 40: Middle East & Africa Compression Socks & Hosiery Volume (K), by Application 2025 & 2033
- Figure 41: Middle East & Africa Compression Socks & Hosiery Revenue Share (%), by Application 2025 & 2033
- Figure 42: Middle East & Africa Compression Socks & Hosiery Volume Share (%), by Application 2025 & 2033
- Figure 43: Middle East & Africa Compression Socks & Hosiery Revenue (million), by Types 2025 & 2033
- Figure 44: Middle East & Africa Compression Socks & Hosiery Volume (K), by Types 2025 & 2033
- Figure 45: Middle East & Africa Compression Socks & Hosiery Revenue Share (%), by Types 2025 & 2033
- Figure 46: Middle East & Africa Compression Socks & Hosiery Volume Share (%), by Types 2025 & 2033
- Figure 47: Middle East & Africa Compression Socks & Hosiery Revenue (million), by Country 2025 & 2033
- Figure 48: Middle East & Africa Compression Socks & Hosiery Volume (K), by Country 2025 & 2033
- Figure 49: Middle East & Africa Compression Socks & Hosiery Revenue Share (%), by Country 2025 & 2033
- Figure 50: Middle East & Africa Compression Socks & Hosiery Volume Share (%), by Country 2025 & 2033
- Figure 51: Asia Pacific Compression Socks & Hosiery Revenue (million), by Application 2025 & 2033
- Figure 52: Asia Pacific Compression Socks & Hosiery Volume (K), by Application 2025 & 2033
- Figure 53: Asia Pacific Compression Socks & Hosiery Revenue Share (%), by Application 2025 & 2033
- Figure 54: Asia Pacific Compression Socks & Hosiery Volume Share (%), by Application 2025 & 2033
- Figure 55: Asia Pacific Compression Socks & Hosiery Revenue (million), by Types 2025 & 2033
- Figure 56: Asia Pacific Compression Socks & Hosiery Volume (K), by Types 2025 & 2033
- Figure 57: Asia Pacific Compression Socks & Hosiery Revenue Share (%), by Types 2025 & 2033
- Figure 58: Asia Pacific Compression Socks & Hosiery Volume Share (%), by Types 2025 & 2033
- Figure 59: Asia Pacific Compression Socks & Hosiery Revenue (million), by Country 2025 & 2033
- Figure 60: Asia Pacific Compression Socks & Hosiery Volume (K), by Country 2025 & 2033
- Figure 61: Asia Pacific Compression Socks & Hosiery Revenue Share (%), by Country 2025 & 2033
- Figure 62: Asia Pacific Compression Socks & Hosiery Volume Share (%), by Country 2025 & 2033
List of Tables
- Table 1: Global Compression Socks & Hosiery Revenue million Forecast, by Application 2020 & 2033
- Table 2: Global Compression Socks & Hosiery Volume K Forecast, by Application 2020 & 2033
- Table 3: Global Compression Socks & Hosiery Revenue million Forecast, by Types 2020 & 2033
- Table 4: Global Compression Socks & Hosiery Volume K Forecast, by Types 2020 & 2033
- Table 5: Global Compression Socks & Hosiery Revenue million Forecast, by Region 2020 & 2033
- Table 6: Global Compression Socks & Hosiery Volume K Forecast, by Region 2020 & 2033
- Table 7: Global Compression Socks & Hosiery Revenue million Forecast, by Application 2020 & 2033
- Table 8: Global Compression Socks & Hosiery Volume K Forecast, by Application 2020 & 2033
- Table 9: Global Compression Socks & Hosiery Revenue million Forecast, by Types 2020 & 2033
- Table 10: Global Compression Socks & Hosiery Volume K Forecast, by Types 2020 & 2033
- Table 11: Global Compression Socks & Hosiery Revenue million Forecast, by Country 2020 & 2033
- Table 12: Global Compression Socks & Hosiery Volume K Forecast, by Country 2020 & 2033
- Table 13: United States Compression Socks & Hosiery Revenue (million) Forecast, by Application 2020 & 2033
- Table 14: United States Compression Socks & Hosiery Volume (K) Forecast, by Application 2020 & 2033
- Table 15: Canada Compression Socks & Hosiery Revenue (million) Forecast, by Application 2020 & 2033
- Table 16: Canada Compression Socks & Hosiery Volume (K) Forecast, by Application 2020 & 2033
- Table 17: Mexico Compression Socks & Hosiery Revenue (million) Forecast, by Application 2020 & 2033
- Table 18: Mexico Compression Socks & Hosiery Volume (K) Forecast, by Application 2020 & 2033
- Table 19: Global Compression Socks & Hosiery Revenue million Forecast, by Application 2020 & 2033
- Table 20: Global Compression Socks & Hosiery Volume K Forecast, by Application 2020 & 2033
- Table 21: Global Compression Socks & Hosiery Revenue million Forecast, by Types 2020 & 2033
- Table 22: Global Compression Socks & Hosiery Volume K Forecast, by Types 2020 & 2033
- Table 23: Global Compression Socks & Hosiery Revenue million Forecast, by Country 2020 & 2033
- Table 24: Global Compression Socks & Hosiery Volume K Forecast, by Country 2020 & 2033
- Table 25: Brazil Compression Socks & Hosiery Revenue (million) Forecast, by Application 2020 & 2033
- Table 26: Brazil Compression Socks & Hosiery Volume (K) Forecast, by Application 2020 & 2033
- Table 27: Argentina Compression Socks & Hosiery Revenue (million) Forecast, by Application 2020 & 2033
- Table 28: Argentina Compression Socks & Hosiery Volume (K) Forecast, by Application 2020 & 2033
- Table 29: Rest of South America Compression Socks & Hosiery Revenue (million) Forecast, by Application 2020 & 2033
- Table 30: Rest of South America Compression Socks & Hosiery Volume (K) Forecast, by Application 2020 & 2033
- Table 31: Global Compression Socks & Hosiery Revenue million Forecast, by Application 2020 & 2033
- Table 32: Global Compression Socks & Hosiery Volume K Forecast, by Application 2020 & 2033
- Table 33: Global Compression Socks & Hosiery Revenue million Forecast, by Types 2020 & 2033
- Table 34: Global Compression Socks & Hosiery Volume K Forecast, by Types 2020 & 2033
- Table 35: Global Compression Socks & Hosiery Revenue million Forecast, by Country 2020 & 2033
- Table 36: Global Compression Socks & Hosiery Volume K Forecast, by Country 2020 & 2033
- Table 37: United Kingdom Compression Socks & Hosiery Revenue (million) Forecast, by Application 2020 & 2033
- Table 38: United Kingdom Compression Socks & Hosiery Volume (K) Forecast, by Application 2020 & 2033
- Table 39: Germany Compression Socks & Hosiery Revenue (million) Forecast, by Application 2020 & 2033
- Table 40: Germany Compression Socks & Hosiery Volume (K) Forecast, by Application 2020 & 2033
- Table 41: France Compression Socks & Hosiery Revenue (million) Forecast, by Application 2020 & 2033
- Table 42: France Compression Socks & Hosiery Volume (K) Forecast, by Application 2020 & 2033
- Table 43: Italy Compression Socks & Hosiery Revenue (million) Forecast, by Application 2020 & 2033
- Table 44: Italy Compression Socks & Hosiery Volume (K) Forecast, by Application 2020 & 2033
- Table 45: Spain Compression Socks & Hosiery Revenue (million) Forecast, by Application 2020 & 2033
- Table 46: Spain Compression Socks & Hosiery Volume (K) Forecast, by Application 2020 & 2033
- Table 47: Russia Compression Socks & Hosiery Revenue (million) Forecast, by Application 2020 & 2033
- Table 48: Russia Compression Socks & Hosiery Volume (K) Forecast, by Application 2020 & 2033
- Table 49: Benelux Compression Socks & Hosiery Revenue (million) Forecast, by Application 2020 & 2033
- Table 50: Benelux Compression Socks & Hosiery Volume (K) Forecast, by Application 2020 & 2033
- Table 51: Nordics Compression Socks & Hosiery Revenue (million) Forecast, by Application 2020 & 2033
- Table 52: Nordics Compression Socks & Hosiery Volume (K) Forecast, by Application 2020 & 2033
- Table 53: Rest of Europe Compression Socks & Hosiery Revenue (million) Forecast, by Application 2020 & 2033
- Table 54: Rest of Europe Compression Socks & Hosiery Volume (K) Forecast, by Application 2020 & 2033
- Table 55: Global Compression Socks & Hosiery Revenue million Forecast, by Application 2020 & 2033
- Table 56: Global Compression Socks & Hosiery Volume K Forecast, by Application 2020 & 2033
- Table 57: Global Compression Socks & Hosiery Revenue million Forecast, by Types 2020 & 2033
- Table 58: Global Compression Socks & Hosiery Volume K Forecast, by Types 2020 & 2033
- Table 59: Global Compression Socks & Hosiery Revenue million Forecast, by Country 2020 & 2033
- Table 60: Global Compression Socks & Hosiery Volume K Forecast, by Country 2020 & 2033
- Table 61: Turkey Compression Socks & Hosiery Revenue (million) Forecast, by Application 2020 & 2033
- Table 62: Turkey Compression Socks & Hosiery Volume (K) Forecast, by Application 2020 & 2033
- Table 63: Israel Compression Socks & Hosiery Revenue (million) Forecast, by Application 2020 & 2033
- Table 64: Israel Compression Socks & Hosiery Volume (K) Forecast, by Application 2020 & 2033
- Table 65: GCC Compression Socks & Hosiery Revenue (million) Forecast, by Application 2020 & 2033
- Table 66: GCC Compression Socks & Hosiery Volume (K) Forecast, by Application 2020 & 2033
- Table 67: North Africa Compression Socks & Hosiery Revenue (million) Forecast, by Application 2020 & 2033
- Table 68: North Africa Compression Socks & Hosiery Volume (K) Forecast, by Application 2020 & 2033
- Table 69: South Africa Compression Socks & Hosiery Revenue (million) Forecast, by Application 2020 & 2033
- Table 70: South Africa Compression Socks & Hosiery Volume (K) Forecast, by Application 2020 & 2033
- Table 71: Rest of Middle East & Africa Compression Socks & Hosiery Revenue (million) Forecast, by Application 2020 & 2033
- Table 72: Rest of Middle East & Africa Compression Socks & Hosiery Volume (K) Forecast, by Application 2020 & 2033
- Table 73: Global Compression Socks & Hosiery Revenue million Forecast, by Application 2020 & 2033
- Table 74: Global Compression Socks & Hosiery Volume K Forecast, by Application 2020 & 2033
- Table 75: Global Compression Socks & Hosiery Revenue million Forecast, by Types 2020 & 2033
- Table 76: Global Compression Socks & Hosiery Volume K Forecast, by Types 2020 & 2033
- Table 77: Global Compression Socks & Hosiery Revenue million Forecast, by Country 2020 & 2033
- Table 78: Global Compression Socks & Hosiery Volume K Forecast, by Country 2020 & 2033
- Table 79: China Compression Socks & Hosiery Revenue (million) Forecast, by Application 2020 & 2033
- Table 80: China Compression Socks & Hosiery Volume (K) Forecast, by Application 2020 & 2033
- Table 81: India Compression Socks & Hosiery Revenue (million) Forecast, by Application 2020 & 2033
- Table 82: India Compression Socks & Hosiery Volume (K) Forecast, by Application 2020 & 2033
- Table 83: Japan Compression Socks & Hosiery Revenue (million) Forecast, by Application 2020 & 2033
- Table 84: Japan Compression Socks & Hosiery Volume (K) Forecast, by Application 2020 & 2033
- Table 85: South Korea Compression Socks & Hosiery Revenue (million) Forecast, by Application 2020 & 2033
- Table 86: South Korea Compression Socks & Hosiery Volume (K) Forecast, by Application 2020 & 2033
- Table 87: ASEAN Compression Socks & Hosiery Revenue (million) Forecast, by Application 2020 & 2033
- Table 88: ASEAN Compression Socks & Hosiery Volume (K) Forecast, by Application 2020 & 2033
- Table 89: Oceania Compression Socks & Hosiery Revenue (million) Forecast, by Application 2020 & 2033
- Table 90: Oceania Compression Socks & Hosiery Volume (K) Forecast, by Application 2020 & 2033
- Table 91: Rest of Asia Pacific Compression Socks & Hosiery Revenue (million) Forecast, by Application 2020 & 2033
- Table 92: Rest of Asia Pacific Compression Socks & Hosiery Volume (K) Forecast, by Application 2020 & 2033
Frequently Asked Questions
1. What is the projected Compound Annual Growth Rate (CAGR) of the Compression Socks & Hosiery?
The projected CAGR is approximately XX%.
2. Which companies are prominent players in the Compression Socks & Hosiery?
Key companies in the market include MEDI, venosan, MD, ZUBEJ, MERZ, 2XU, BSN medical, Dr.Scholl's, Celeste Stein, souermei, Truform, ASICS, SIGVARIS.
3. What are the main segments of the Compression Socks & Hosiery?
The market segments include Application, Types.
4. Can you provide details about the market size?
The market size is estimated to be USD XXX million as of 2022.
5. What are some drivers contributing to market growth?
N/A
6. What are the notable trends driving market growth?
N/A
7. Are there any restraints impacting market growth?
N/A
8. Can you provide examples of recent developments in the market?
N/A
9. What pricing options are available for accessing the report?
Pricing options include single-user, multi-user, and enterprise licenses priced at USD 3350.00, USD 5025.00, and USD 6700.00 respectively.
10. Is the market size provided in terms of value or volume?
The market size is provided in terms of value, measured in million and volume, measured in K.
11. Are there any specific market keywords associated with the report?
Yes, the market keyword associated with the report is "Compression Socks & Hosiery," which aids in identifying and referencing the specific market segment covered.
12. How do I determine which pricing option suits my needs best?
The pricing options vary based on user requirements and access needs. Individual users may opt for single-user licenses, while businesses requiring broader access may choose multi-user or enterprise licenses for cost-effective access to the report.
13. Are there any additional resources or data provided in the Compression Socks & Hosiery report?
While the report offers comprehensive insights, it's advisable to review the specific contents or supplementary materials provided to ascertain if additional resources or data are available.
14. How can I stay updated on further developments or reports in the Compression Socks & Hosiery?
To stay informed about further developments, trends, and reports in the Compression Socks & Hosiery, consider subscribing to industry newsletters, following relevant companies and organizations, or regularly checking reputable industry news sources and publications.
Methodology
Step 1 - Identification of Relevant Samples Size from Population Database


Step 2 - Approaches for Defining Global Market Size (Value, Volume* & Price*)

Note*: In applicable scenarios
Step 3 - Data Sources
Primary Research
- Web Analytics
- Survey Reports
- Research Institute
- Latest Research Reports
- Opinion Leaders
Secondary Research
- Annual Reports
- White Paper
- Latest Press Release
- Industry Association
- Paid Database
- Investor Presentations

Step 4 - Data Triangulation
Involves using different sources of information in order to increase the validity of a study
These sources are likely to be stakeholders in a program - participants, other researchers, program staff, other community members, and so on.
Then we put all data in single framework & apply various statistical tools to find out the dynamic on the market.
During the analysis stage, feedback from the stakeholder groups would be compared to determine areas of agreement as well as areas of divergence