

Key Insights
The global Computer Anti-radiation Glasses market is poised for substantial expansion, driven by heightened awareness of digital eye strain and the cumulative impact of prolonged screen usage. With a current market valuation of $8.82 billion in 2025, the sector is projected to grow at a Compound Annual Growth Rate (CAGR) of 12.43% through 2033. This growth trajectory is underpinned by several critical factors. The pervasive integration of digital devices in both professional and personal spheres has amplified concerns regarding potential health consequences, including eye fatigue, dryness, headaches, and long-term vision impairment associated with blue light exposure. This escalating health consciousness among consumers and organizations alike is a primary demand driver. Concurrently, advancements in lens technology, offering superior protection against UV and X-ray radiation while preserving optical clarity, are enhancing the appeal and efficacy of these glasses. The incorporation of these protective features into fashionable and comfortable eyewear designs is further accelerating market penetration, positioning them as essential daily accessories.
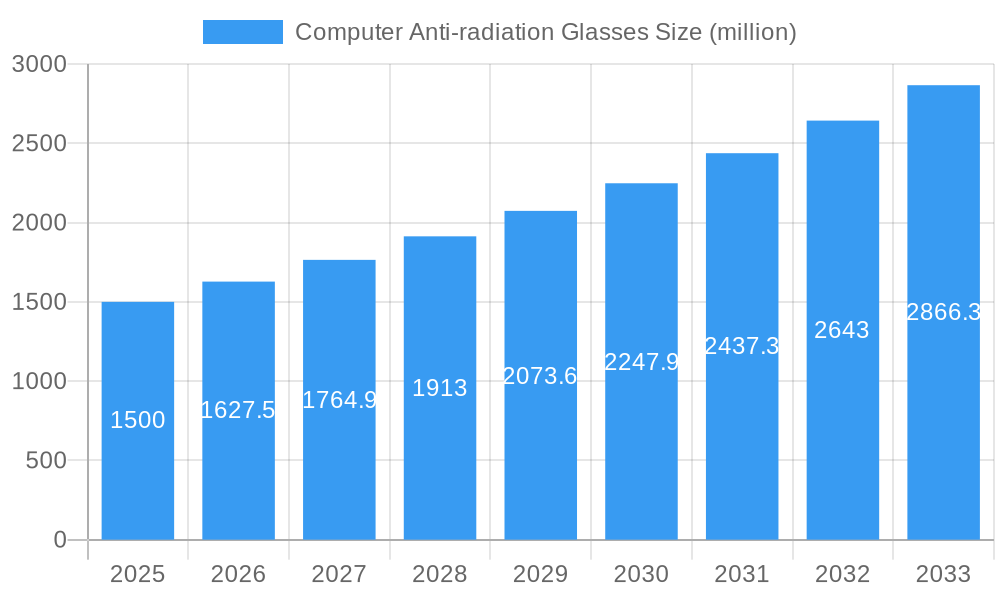
Computer Anti-radiation Glasses Market Size (In Billion)
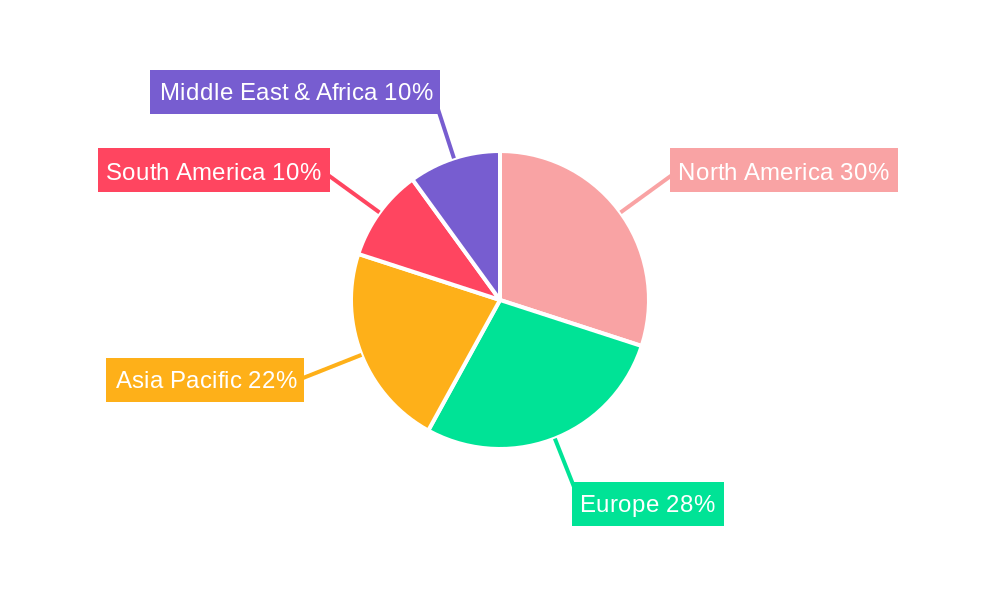
Market segmentation reveals significant adoption within the Medical sector, owing to the imperative for radiation protection among healthcare professionals. The Laboratory segment also presents considerable potential, driven by the extensive use of specialized radiation-emitting equipment. In terms of product categories, UV Radiation Glasses and X-Ray Radiation Glasses are expected to lead market share due to their direct relevance to prevalent digital screen exposure and occupational safety mandates. The competitive arena features established entities such as Phillips Safety, Corning, and Uvex Safety Group, alongside emerging innovators. These companies are actively investing in research and development to introduce cutting-edge anti-radiation lens technologies and a diverse product portfolio. Regional analysis highlights North America and Europe as current market leaders, attributed to higher disposable incomes, advanced eye health awareness, and stringent occupational safety regulations. However, the Asia Pacific region is on track for accelerated growth, propelled by increasing digitalization, a burgeoning middle class, and rising health consciousness in key economies like China and India. Potential restraints, such as the perceived high cost of specialized lenses and the absence of universally standardized regulations for computer radiation, may exert some influence on growth rates; however, the overall market outlook remains predominantly positive and expansionary.
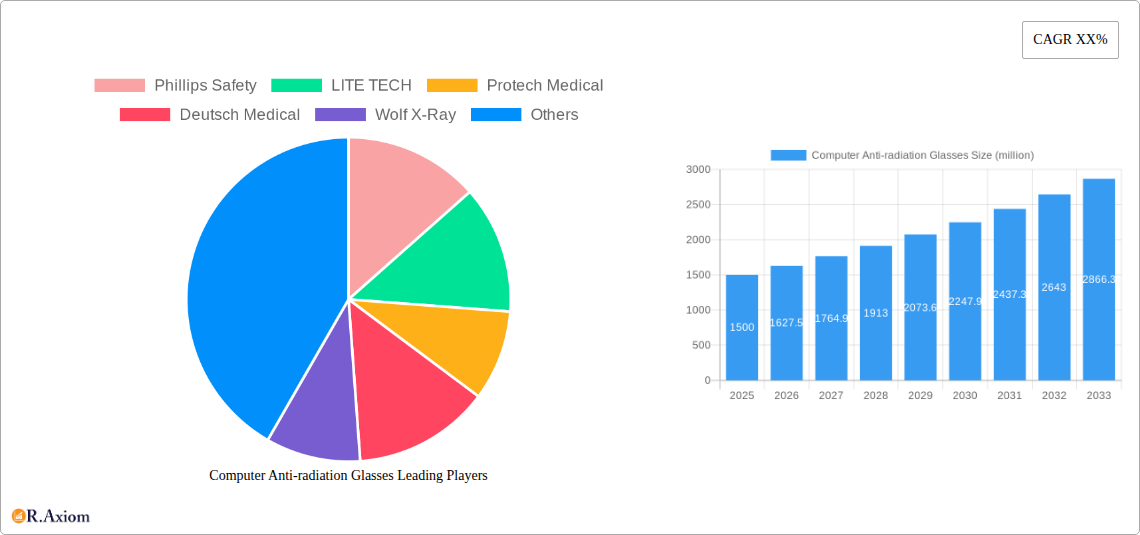
Computer Anti-radiation Glasses Company Market Share
This comprehensive market research report offers an in-depth analysis of the global Computer Anti-radiation Glasses market, detailing its current landscape, historical trends, and future projections. Covering the study period from 2019 to 2033, with a base year of 2025, this report provides critical insights for all industry stakeholders, including manufacturers, suppliers, distributors, investors, and end-users across diverse sectors. We meticulously examine market concentration, innovation, prevailing trends, segmentation, growth catalysts, prevailing challenges, and emerging opportunities, empowering you to navigate this dynamic market landscape effectively.
Computer Anti-radiation Glasses Market Concentration & Innovation
The Computer Anti-radiation Glasses market exhibits a moderate concentration, characterized by the presence of several established players and a growing number of emerging innovators. Phillips Safety, LITE TECH, Protech Medical, Deutsch Medical, Wolf X-Ray, Essilor International, BarrierTechnologies, Supertech, Corning, Uvex Safety Group, Kiran, MAVIG, NoIR Laser Company, Thorlabs, BolleSafety, Mirion Medical, ProtecX Medical, and Carl Zeiss are among the prominent companies contributing to market dynamics. Innovation is primarily driven by advancements in lens technology, material science, and increased awareness of digital eye strain and radiation protection. Regulatory frameworks, particularly in healthcare and defense, play a crucial role in dictating product standards and market access. Product substitutes, such as software-based blue light filters, present a competitive challenge, but specialized anti-radiation glasses offer superior protection for specific applications. End-user trends highlight a growing demand for ergonomic and health-conscious computing accessories, particularly among professionals and gamers. Merger and acquisition (M&A) activities, with estimated deal values reaching several hundred million dollars, are shaping the market landscape as larger entities seek to expand their product portfolios and market reach.
Computer Anti-radiation Glasses Industry Trends & Insights
The global Computer Anti-radiation Glasses market is poised for significant growth, with an estimated Compound Annual Growth Rate (CAGR) of approximately 8.5% projected over the forecast period of 2025–2033. This expansion is fueled by an escalating awareness of the detrimental effects of prolonged screen exposure, including digital eye strain, sleep disturbances, and potential long-term health risks associated with various forms of radiation. Technological disruptions, such as the development of advanced anti-reflective coatings, polarization techniques, and multi-layer filtering technologies, are enhancing the efficacy and comfort of these glasses. Consumer preferences are shifting towards personalized solutions, with demand for prescription and non-prescription options catering to diverse visual needs and protection requirements. The competitive dynamics are intensifying, with companies differentiating themselves through product innovation, brand building, and strategic partnerships. Market penetration is steadily increasing, driven by the ubiquitous use of digital devices across professional and personal spheres. The industry is witnessing a surge in demand from both enterprise and individual consumers seeking to mitigate the adverse effects of screen time. The increasing adoption of remote work models and the continuous evolution of display technologies further contribute to market expansion.
Dominant Markets & Segments in Computer Anti-radiation Glasses
The Computer Anti-radiation Glasses market is segmented across various applications and types, with the Medical application segment demonstrating significant dominance. This is driven by stringent regulatory requirements for radiation protection in healthcare settings, including X-ray procedures, laser surgeries, and diagnostic imaging. Hospitals, clinics, and research institutions are major end-users, investing heavily in specialized protective eyewear for medical professionals and patients. Key drivers for dominance in this segment include government health initiatives, technological advancements in medical imaging and treatment, and the increasing prevalence of radiation-dependent medical procedures.
Within the Types segmentation, X-Ray Radiation Glasses represent a crucial and high-demand category. Their application in radiology departments, dental clinics, and industrial radiography facilities underscores their importance. Economic policies supporting healthcare infrastructure development and safety standards are pivotal to the growth of this segment.
The Laboratory application segment also exhibits strong growth, owing to the widespread use of scientific equipment emitting various forms of radiation, including UV and laser. Research and development activities in academic institutions and industrial labs necessitate robust protective eyewear.
The Defense sector is another significant contributor, with applications in military operations involving lasers, high-intensity lighting, and potentially other forms of radiation. Government defense spending and the continuous need for advanced protective gear bolster this segment.
While the Others application segment, encompassing general consumer use for computer, smartphone, and gaming protection, represents a broader market, its dominance is increasingly being shaped by growing health consciousness and the proliferation of digital devices.
Key drivers for dominance across these segments include:
- Technological Advancements: Development of advanced filtering materials and lens designs.
- Regulatory Compliance: Strict safety standards in medical, defense, and laboratory environments.
- Increased Health Awareness: Growing consumer concern over digital eye strain and radiation exposure.
- R&D Investment: Continuous innovation in protective eyewear technology.
- Market Penetration: Widespread adoption of digital devices across all demographics.
Computer Anti-radiation Glasses Product Developments
Recent product developments in the Computer Anti-radiation Glasses market focus on enhanced multi-spectrum protection, improved optical clarity, and ergonomic designs. Innovations include advanced lens coatings that effectively filter specific wavelengths of UV, X-ray, and laser radiation, while minimizing visual distortion. Companies are also developing lighter, more durable frame materials and prescription-integrated options to cater to a wider user base. These advancements offer competitive advantages by addressing user comfort, style preferences, and specific protection needs, thereby expanding the market fit for these critical safety accessories.
Computer Anti-radiation Glasses Market Scope & Segmentation Analysis
The global Computer Anti-radiation Glasses market is meticulously segmented to provide a granular understanding of its dynamics. The Application segmentation includes Medical, Defense, Laboratory, and Others. The Medical segment is projected to witness a market size of approximately $1.5 billion by 2033, driven by increasing healthcare investments and stringent safety protocols. The Defense segment is estimated to reach $1.2 billion, fueled by government procurement and evolving military technologies. The Laboratory segment is anticipated to grow to $0.8 billion, supported by research and development activities. The Others segment, encompassing consumer electronics and general use, is expected to reach $2.0 billion.
The Types segmentation encompasses UV Radiation Glasses, X-Ray Radiation Glasses, Laser Radiation Glasses, and Other Radiation Glasses. X-Ray Radiation Glasses are expected to hold a significant market share due to their critical role in healthcare and industrial imaging. UV Radiation Glasses remain a consistent performer, driven by outdoor and industrial applications. Laser Radiation Glasses are crucial for specialized industries like manufacturing, telecommunications, and research. Other Radiation Glasses cater to emerging threats and niche applications.
Key Drivers of Computer Anti-radiation Glasses Growth
The Computer Anti-radiation Glasses market is propelled by several interconnected drivers. Firstly, the increasing awareness of the health implications of prolonged digital screen exposure, such as digital eye strain, fatigue, and potential long-term risks, is a primary catalyst. Secondly, stringent regulatory mandates in sectors like healthcare and defense necessitate the use of certified protective eyewear, driving demand for specialized glasses. Thirdly, continuous technological advancements in lens materials and coating technologies are leading to more effective and comfortable anti-radiation solutions. Finally, the widespread adoption of digital devices across all age groups and professional fields ensures a constantly expanding consumer base seeking to mitigate screen-related health concerns.
Challenges in the Computer Anti-radiation Glasses Sector
Despite robust growth prospects, the Computer Anti-radiation Glasses sector faces several challenges. Regulatory hurdles, particularly in ensuring consistent adherence to international safety standards across different markets, can pose a barrier to entry for some manufacturers. Supply chain disruptions, exacerbated by global geopolitical events and material sourcing complexities, can impact production and pricing. Intense competitive pressures, with numerous players vying for market share, often lead to price wars, affecting profit margins. Furthermore, consumer perception and education about the true benefits and necessity of anti-radiation glasses, beyond general blue light filtering, remain a continuous effort required to drive market penetration.
Emerging Opportunities in Computer Anti-radiation Glasses
Emerging opportunities in the Computer Anti-radiation Glasses market are multifaceted. The growing trend of remote work and hybrid office models is increasing the demand for eye protection in home and office environments. Technological advancements in smart glasses and augmented reality (AR) devices present opportunities for integrated anti-radiation features. The expansion of e-sports and professional gaming also creates a niche market for high-performance protective eyewear. Furthermore, rising disposable incomes in developing economies and increasing health consciousness among consumers globally are opening new geographical markets for anti-radiation glasses.
Leading Players in the Computer Anti-radiation Glasses Market
- Phillips Safety
- LITE TECH
- Protech Medical
- Deutsch Medical
- Wolf X-Ray
- Essilor International
- BarrierTechnologies
- Supertech
- Corning
- Uvex Safety Group
- Kiran
- MAVIG
- NoIR Laser Company
- Thorlabs
- BolleSafety
- Mirion Medical
- ProtecX Medical
- Carl Zeiss
Key Developments in Computer Anti-radiation Glasses Industry
- 2023/11: Phillips Safety launched a new line of advanced X-ray protective eyewear with enhanced peripheral vision.
- 2023/09: Essilor International acquired a significant stake in a leading myopia control lens manufacturer, signaling an expanded focus on eye health solutions.
- 2023/07: Uvex Safety Group introduced innovative lightweight frame materials for improved comfort in their industrial safety glasses range.
- 2022/12: Corning announced advancements in its proprietary glass-ceramic technologies, potentially impacting future lens development for radiation shielding.
- 2022/10: MAVIG expanded its product portfolio with the introduction of flexible and custom-fitted radiation protection shields.
Strategic Outlook for Computer Anti-radiation Glasses Market
The strategic outlook for the Computer Anti-radiation Glasses market remains exceptionally positive. The sustained growth in digital device usage, coupled with increasing global health awareness, creates a fertile ground for continued expansion. Future market success will hinge on continuous innovation in material science and optical technology, the ability to cater to personalized user needs, and effective market education. Companies that can demonstrate superior protection, comfort, and style, while adhering to evolving regulatory standards, are best positioned to capitalize on the burgeoning opportunities within this vital market segment. Strategic partnerships and potential mergers will likely continue to shape the competitive landscape, driving consolidation and fostering further technological advancements.
Computer Anti-radiation Glasses Segmentation
-
1. Application
- 1.1. Medical
- 1.2. Defense
- 1.3. Laboratory
- 1.4. Others
-
2. Types
- 2.1. UV Radiation Glasses
- 2.2. X-Ray Radiation Glasses
- 2.3. Laser Radiation Glasses
- 2.4. Other Radiation Glasses
Computer Anti-radiation Glasses Segmentation By Geography
-
1. North America
- 1.1. United States
- 1.2. Canada
- 1.3. Mexico
-
2. South America
- 2.1. Brazil
- 2.2. Argentina
- 2.3. Rest of South America
-
3. Europe
- 3.1. United Kingdom
- 3.2. Germany
- 3.3. France
- 3.4. Italy
- 3.5. Spain
- 3.6. Russia
- 3.7. Benelux
- 3.8. Nordics
- 3.9. Rest of Europe
-
4. Middle East & Africa
- 4.1. Turkey
- 4.2. Israel
- 4.3. GCC
- 4.4. North Africa
- 4.5. South Africa
- 4.6. Rest of Middle East & Africa
-
5. Asia Pacific
- 5.1. China
- 5.2. India
- 5.3. Japan
- 5.4. South Korea
- 5.5. ASEAN
- 5.6. Oceania
- 5.7. Rest of Asia Pacific
Computer Anti-radiation Glasses Regional Market Share
Geographic Coverage of Computer Anti-radiation Glasses
Computer Anti-radiation Glasses REPORT HIGHLIGHTS
| Aspects | Details |
|---|---|
| Study Period | 2020-2034 |
| Base Year | 2025 |
| Estimated Year | 2026 |
| Forecast Period | 2026-2034 |
| Historical Period | 2020-2025 |
| Growth Rate | CAGR of 12.43% from 2020-2034 |
| Segmentation |
|
Table of Contents
- 1. Introduction
- 1.1. Research Scope
- 1.2. Market Segmentation
- 1.3. Research Methodology
- 1.4. Definitions and Assumptions
- 2. Executive Summary
- 2.1. Introduction
- 3. Market Dynamics
- 3.1. Introduction
- 3.2. Market Drivers
- 3.3. Market Restrains
- 3.4. Market Trends
- 4. Market Factor Analysis
- 4.1. Porters Five Forces
- 4.2. Supply/Value Chain
- 4.3. PESTEL analysis
- 4.4. Market Entropy
- 4.5. Patent/Trademark Analysis
- 5. Global Computer Anti-radiation Glasses Analysis, Insights and Forecast, 2020-2032
- 5.1. Market Analysis, Insights and Forecast - by Application
- 5.1.1. Medical
- 5.1.2. Defense
- 5.1.3. Laboratory
- 5.1.4. Others
- 5.2. Market Analysis, Insights and Forecast - by Types
- 5.2.1. UV Radiation Glasses
- 5.2.2. X-Ray Radiation Glasses
- 5.2.3. Laser Radiation Glasses
- 5.2.4. Other Radiation Glasses
- 5.3. Market Analysis, Insights and Forecast - by Region
- 5.3.1. North America
- 5.3.2. South America
- 5.3.3. Europe
- 5.3.4. Middle East & Africa
- 5.3.5. Asia Pacific
- 5.1. Market Analysis, Insights and Forecast - by Application
- 6. North America Computer Anti-radiation Glasses Analysis, Insights and Forecast, 2020-2032
- 6.1. Market Analysis, Insights and Forecast - by Application
- 6.1.1. Medical
- 6.1.2. Defense
- 6.1.3. Laboratory
- 6.1.4. Others
- 6.2. Market Analysis, Insights and Forecast - by Types
- 6.2.1. UV Radiation Glasses
- 6.2.2. X-Ray Radiation Glasses
- 6.2.3. Laser Radiation Glasses
- 6.2.4. Other Radiation Glasses
- 6.1. Market Analysis, Insights and Forecast - by Application
- 7. South America Computer Anti-radiation Glasses Analysis, Insights and Forecast, 2020-2032
- 7.1. Market Analysis, Insights and Forecast - by Application
- 7.1.1. Medical
- 7.1.2. Defense
- 7.1.3. Laboratory
- 7.1.4. Others
- 7.2. Market Analysis, Insights and Forecast - by Types
- 7.2.1. UV Radiation Glasses
- 7.2.2. X-Ray Radiation Glasses
- 7.2.3. Laser Radiation Glasses
- 7.2.4. Other Radiation Glasses
- 7.1. Market Analysis, Insights and Forecast - by Application
- 8. Europe Computer Anti-radiation Glasses Analysis, Insights and Forecast, 2020-2032
- 8.1. Market Analysis, Insights and Forecast - by Application
- 8.1.1. Medical
- 8.1.2. Defense
- 8.1.3. Laboratory
- 8.1.4. Others
- 8.2. Market Analysis, Insights and Forecast - by Types
- 8.2.1. UV Radiation Glasses
- 8.2.2. X-Ray Radiation Glasses
- 8.2.3. Laser Radiation Glasses
- 8.2.4. Other Radiation Glasses
- 8.1. Market Analysis, Insights and Forecast - by Application
- 9. Middle East & Africa Computer Anti-radiation Glasses Analysis, Insights and Forecast, 2020-2032
- 9.1. Market Analysis, Insights and Forecast - by Application
- 9.1.1. Medical
- 9.1.2. Defense
- 9.1.3. Laboratory
- 9.1.4. Others
- 9.2. Market Analysis, Insights and Forecast - by Types
- 9.2.1. UV Radiation Glasses
- 9.2.2. X-Ray Radiation Glasses
- 9.2.3. Laser Radiation Glasses
- 9.2.4. Other Radiation Glasses
- 9.1. Market Analysis, Insights and Forecast - by Application
- 10. Asia Pacific Computer Anti-radiation Glasses Analysis, Insights and Forecast, 2020-2032
- 10.1. Market Analysis, Insights and Forecast - by Application
- 10.1.1. Medical
- 10.1.2. Defense
- 10.1.3. Laboratory
- 10.1.4. Others
- 10.2. Market Analysis, Insights and Forecast - by Types
- 10.2.1. UV Radiation Glasses
- 10.2.2. X-Ray Radiation Glasses
- 10.2.3. Laser Radiation Glasses
- 10.2.4. Other Radiation Glasses
- 10.1. Market Analysis, Insights and Forecast - by Application
- 11. Competitive Analysis
- 11.1. Global Market Share Analysis 2025
- 11.2. Company Profiles
- 11.2.1 Phillips Safety
- 11.2.1.1. Overview
- 11.2.1.2. Products
- 11.2.1.3. SWOT Analysis
- 11.2.1.4. Recent Developments
- 11.2.1.5. Financials (Based on Availability)
- 11.2.2 LITE TECH
- 11.2.2.1. Overview
- 11.2.2.2. Products
- 11.2.2.3. SWOT Analysis
- 11.2.2.4. Recent Developments
- 11.2.2.5. Financials (Based on Availability)
- 11.2.3 Protech Medical
- 11.2.3.1. Overview
- 11.2.3.2. Products
- 11.2.3.3. SWOT Analysis
- 11.2.3.4. Recent Developments
- 11.2.3.5. Financials (Based on Availability)
- 11.2.4 Deutsch Medical
- 11.2.4.1. Overview
- 11.2.4.2. Products
- 11.2.4.3. SWOT Analysis
- 11.2.4.4. Recent Developments
- 11.2.4.5. Financials (Based on Availability)
- 11.2.5 Wolf X-Ray
- 11.2.5.1. Overview
- 11.2.5.2. Products
- 11.2.5.3. SWOT Analysis
- 11.2.5.4. Recent Developments
- 11.2.5.5. Financials (Based on Availability)
- 11.2.6 Essilor International
- 11.2.6.1. Overview
- 11.2.6.2. Products
- 11.2.6.3. SWOT Analysis
- 11.2.6.4. Recent Developments
- 11.2.6.5. Financials (Based on Availability)
- 11.2.7 BarrierTechnologies
- 11.2.7.1. Overview
- 11.2.7.2. Products
- 11.2.7.3. SWOT Analysis
- 11.2.7.4. Recent Developments
- 11.2.7.5. Financials (Based on Availability)
- 11.2.8 Supertech
- 11.2.8.1. Overview
- 11.2.8.2. Products
- 11.2.8.3. SWOT Analysis
- 11.2.8.4. Recent Developments
- 11.2.8.5. Financials (Based on Availability)
- 11.2.9 Corning
- 11.2.9.1. Overview
- 11.2.9.2. Products
- 11.2.9.3. SWOT Analysis
- 11.2.9.4. Recent Developments
- 11.2.9.5. Financials (Based on Availability)
- 11.2.10 Uvex Safety Group
- 11.2.10.1. Overview
- 11.2.10.2. Products
- 11.2.10.3. SWOT Analysis
- 11.2.10.4. Recent Developments
- 11.2.10.5. Financials (Based on Availability)
- 11.2.11 Kiran
- 11.2.11.1. Overview
- 11.2.11.2. Products
- 11.2.11.3. SWOT Analysis
- 11.2.11.4. Recent Developments
- 11.2.11.5. Financials (Based on Availability)
- 11.2.12 MAVIG
- 11.2.12.1. Overview
- 11.2.12.2. Products
- 11.2.12.3. SWOT Analysis
- 11.2.12.4. Recent Developments
- 11.2.12.5. Financials (Based on Availability)
- 11.2.13 NoIR Laser Company
- 11.2.13.1. Overview
- 11.2.13.2. Products
- 11.2.13.3. SWOT Analysis
- 11.2.13.4. Recent Developments
- 11.2.13.5. Financials (Based on Availability)
- 11.2.14 Thorlabs
- 11.2.14.1. Overview
- 11.2.14.2. Products
- 11.2.14.3. SWOT Analysis
- 11.2.14.4. Recent Developments
- 11.2.14.5. Financials (Based on Availability)
- 11.2.15 BolleSafety
- 11.2.15.1. Overview
- 11.2.15.2. Products
- 11.2.15.3. SWOT Analysis
- 11.2.15.4. Recent Developments
- 11.2.15.5. Financials (Based on Availability)
- 11.2.16 Mirion Medical
- 11.2.16.1. Overview
- 11.2.16.2. Products
- 11.2.16.3. SWOT Analysis
- 11.2.16.4. Recent Developments
- 11.2.16.5. Financials (Based on Availability)
- 11.2.17 ProtecX Medical
- 11.2.17.1. Overview
- 11.2.17.2. Products
- 11.2.17.3. SWOT Analysis
- 11.2.17.4. Recent Developments
- 11.2.17.5. Financials (Based on Availability)
- 11.2.18 Carl Zeiss
- 11.2.18.1. Overview
- 11.2.18.2. Products
- 11.2.18.3. SWOT Analysis
- 11.2.18.4. Recent Developments
- 11.2.18.5. Financials (Based on Availability)
- 11.2.1 Phillips Safety
List of Figures
- Figure 1: Global Computer Anti-radiation Glasses Revenue Breakdown (billion, %) by Region 2025 & 2033
- Figure 2: Global Computer Anti-radiation Glasses Volume Breakdown (K, %) by Region 2025 & 2033
- Figure 3: North America Computer Anti-radiation Glasses Revenue (billion), by Application 2025 & 2033
- Figure 4: North America Computer Anti-radiation Glasses Volume (K), by Application 2025 & 2033
- Figure 5: North America Computer Anti-radiation Glasses Revenue Share (%), by Application 2025 & 2033
- Figure 6: North America Computer Anti-radiation Glasses Volume Share (%), by Application 2025 & 2033
- Figure 7: North America Computer Anti-radiation Glasses Revenue (billion), by Types 2025 & 2033
- Figure 8: North America Computer Anti-radiation Glasses Volume (K), by Types 2025 & 2033
- Figure 9: North America Computer Anti-radiation Glasses Revenue Share (%), by Types 2025 & 2033
- Figure 10: North America Computer Anti-radiation Glasses Volume Share (%), by Types 2025 & 2033
- Figure 11: North America Computer Anti-radiation Glasses Revenue (billion), by Country 2025 & 2033
- Figure 12: North America Computer Anti-radiation Glasses Volume (K), by Country 2025 & 2033
- Figure 13: North America Computer Anti-radiation Glasses Revenue Share (%), by Country 2025 & 2033
- Figure 14: North America Computer Anti-radiation Glasses Volume Share (%), by Country 2025 & 2033
- Figure 15: South America Computer Anti-radiation Glasses Revenue (billion), by Application 2025 & 2033
- Figure 16: South America Computer Anti-radiation Glasses Volume (K), by Application 2025 & 2033
- Figure 17: South America Computer Anti-radiation Glasses Revenue Share (%), by Application 2025 & 2033
- Figure 18: South America Computer Anti-radiation Glasses Volume Share (%), by Application 2025 & 2033
- Figure 19: South America Computer Anti-radiation Glasses Revenue (billion), by Types 2025 & 2033
- Figure 20: South America Computer Anti-radiation Glasses Volume (K), by Types 2025 & 2033
- Figure 21: South America Computer Anti-radiation Glasses Revenue Share (%), by Types 2025 & 2033
- Figure 22: South America Computer Anti-radiation Glasses Volume Share (%), by Types 2025 & 2033
- Figure 23: South America Computer Anti-radiation Glasses Revenue (billion), by Country 2025 & 2033
- Figure 24: South America Computer Anti-radiation Glasses Volume (K), by Country 2025 & 2033
- Figure 25: South America Computer Anti-radiation Glasses Revenue Share (%), by Country 2025 & 2033
- Figure 26: South America Computer Anti-radiation Glasses Volume Share (%), by Country 2025 & 2033
- Figure 27: Europe Computer Anti-radiation Glasses Revenue (billion), by Application 2025 & 2033
- Figure 28: Europe Computer Anti-radiation Glasses Volume (K), by Application 2025 & 2033
- Figure 29: Europe Computer Anti-radiation Glasses Revenue Share (%), by Application 2025 & 2033
- Figure 30: Europe Computer Anti-radiation Glasses Volume Share (%), by Application 2025 & 2033
- Figure 31: Europe Computer Anti-radiation Glasses Revenue (billion), by Types 2025 & 2033
- Figure 32: Europe Computer Anti-radiation Glasses Volume (K), by Types 2025 & 2033
- Figure 33: Europe Computer Anti-radiation Glasses Revenue Share (%), by Types 2025 & 2033
- Figure 34: Europe Computer Anti-radiation Glasses Volume Share (%), by Types 2025 & 2033
- Figure 35: Europe Computer Anti-radiation Glasses Revenue (billion), by Country 2025 & 2033
- Figure 36: Europe Computer Anti-radiation Glasses Volume (K), by Country 2025 & 2033
- Figure 37: Europe Computer Anti-radiation Glasses Revenue Share (%), by Country 2025 & 2033
- Figure 38: Europe Computer Anti-radiation Glasses Volume Share (%), by Country 2025 & 2033
- Figure 39: Middle East & Africa Computer Anti-radiation Glasses Revenue (billion), by Application 2025 & 2033
- Figure 40: Middle East & Africa Computer Anti-radiation Glasses Volume (K), by Application 2025 & 2033
- Figure 41: Middle East & Africa Computer Anti-radiation Glasses Revenue Share (%), by Application 2025 & 2033
- Figure 42: Middle East & Africa Computer Anti-radiation Glasses Volume Share (%), by Application 2025 & 2033
- Figure 43: Middle East & Africa Computer Anti-radiation Glasses Revenue (billion), by Types 2025 & 2033
- Figure 44: Middle East & Africa Computer Anti-radiation Glasses Volume (K), by Types 2025 & 2033
- Figure 45: Middle East & Africa Computer Anti-radiation Glasses Revenue Share (%), by Types 2025 & 2033
- Figure 46: Middle East & Africa Computer Anti-radiation Glasses Volume Share (%), by Types 2025 & 2033
- Figure 47: Middle East & Africa Computer Anti-radiation Glasses Revenue (billion), by Country 2025 & 2033
- Figure 48: Middle East & Africa Computer Anti-radiation Glasses Volume (K), by Country 2025 & 2033
- Figure 49: Middle East & Africa Computer Anti-radiation Glasses Revenue Share (%), by Country 2025 & 2033
- Figure 50: Middle East & Africa Computer Anti-radiation Glasses Volume Share (%), by Country 2025 & 2033
- Figure 51: Asia Pacific Computer Anti-radiation Glasses Revenue (billion), by Application 2025 & 2033
- Figure 52: Asia Pacific Computer Anti-radiation Glasses Volume (K), by Application 2025 & 2033
- Figure 53: Asia Pacific Computer Anti-radiation Glasses Revenue Share (%), by Application 2025 & 2033
- Figure 54: Asia Pacific Computer Anti-radiation Glasses Volume Share (%), by Application 2025 & 2033
- Figure 55: Asia Pacific Computer Anti-radiation Glasses Revenue (billion), by Types 2025 & 2033
- Figure 56: Asia Pacific Computer Anti-radiation Glasses Volume (K), by Types 2025 & 2033
- Figure 57: Asia Pacific Computer Anti-radiation Glasses Revenue Share (%), by Types 2025 & 2033
- Figure 58: Asia Pacific Computer Anti-radiation Glasses Volume Share (%), by Types 2025 & 2033
- Figure 59: Asia Pacific Computer Anti-radiation Glasses Revenue (billion), by Country 2025 & 2033
- Figure 60: Asia Pacific Computer Anti-radiation Glasses Volume (K), by Country 2025 & 2033
- Figure 61: Asia Pacific Computer Anti-radiation Glasses Revenue Share (%), by Country 2025 & 2033
- Figure 62: Asia Pacific Computer Anti-radiation Glasses Volume Share (%), by Country 2025 & 2033
List of Tables
- Table 1: Global Computer Anti-radiation Glasses Revenue billion Forecast, by Application 2020 & 2033
- Table 2: Global Computer Anti-radiation Glasses Volume K Forecast, by Application 2020 & 2033
- Table 3: Global Computer Anti-radiation Glasses Revenue billion Forecast, by Types 2020 & 2033
- Table 4: Global Computer Anti-radiation Glasses Volume K Forecast, by Types 2020 & 2033
- Table 5: Global Computer Anti-radiation Glasses Revenue billion Forecast, by Region 2020 & 2033
- Table 6: Global Computer Anti-radiation Glasses Volume K Forecast, by Region 2020 & 2033
- Table 7: Global Computer Anti-radiation Glasses Revenue billion Forecast, by Application 2020 & 2033
- Table 8: Global Computer Anti-radiation Glasses Volume K Forecast, by Application 2020 & 2033
- Table 9: Global Computer Anti-radiation Glasses Revenue billion Forecast, by Types 2020 & 2033
- Table 10: Global Computer Anti-radiation Glasses Volume K Forecast, by Types 2020 & 2033
- Table 11: Global Computer Anti-radiation Glasses Revenue billion Forecast, by Country 2020 & 2033
- Table 12: Global Computer Anti-radiation Glasses Volume K Forecast, by Country 2020 & 2033
- Table 13: United States Computer Anti-radiation Glasses Revenue (billion) Forecast, by Application 2020 & 2033
- Table 14: United States Computer Anti-radiation Glasses Volume (K) Forecast, by Application 2020 & 2033
- Table 15: Canada Computer Anti-radiation Glasses Revenue (billion) Forecast, by Application 2020 & 2033
- Table 16: Canada Computer Anti-radiation Glasses Volume (K) Forecast, by Application 2020 & 2033
- Table 17: Mexico Computer Anti-radiation Glasses Revenue (billion) Forecast, by Application 2020 & 2033
- Table 18: Mexico Computer Anti-radiation Glasses Volume (K) Forecast, by Application 2020 & 2033
- Table 19: Global Computer Anti-radiation Glasses Revenue billion Forecast, by Application 2020 & 2033
- Table 20: Global Computer Anti-radiation Glasses Volume K Forecast, by Application 2020 & 2033
- Table 21: Global Computer Anti-radiation Glasses Revenue billion Forecast, by Types 2020 & 2033
- Table 22: Global Computer Anti-radiation Glasses Volume K Forecast, by Types 2020 & 2033
- Table 23: Global Computer Anti-radiation Glasses Revenue billion Forecast, by Country 2020 & 2033
- Table 24: Global Computer Anti-radiation Glasses Volume K Forecast, by Country 2020 & 2033
- Table 25: Brazil Computer Anti-radiation Glasses Revenue (billion) Forecast, by Application 2020 & 2033
- Table 26: Brazil Computer Anti-radiation Glasses Volume (K) Forecast, by Application 2020 & 2033
- Table 27: Argentina Computer Anti-radiation Glasses Revenue (billion) Forecast, by Application 2020 & 2033
- Table 28: Argentina Computer Anti-radiation Glasses Volume (K) Forecast, by Application 2020 & 2033
- Table 29: Rest of South America Computer Anti-radiation Glasses Revenue (billion) Forecast, by Application 2020 & 2033
- Table 30: Rest of South America Computer Anti-radiation Glasses Volume (K) Forecast, by Application 2020 & 2033
- Table 31: Global Computer Anti-radiation Glasses Revenue billion Forecast, by Application 2020 & 2033
- Table 32: Global Computer Anti-radiation Glasses Volume K Forecast, by Application 2020 & 2033
- Table 33: Global Computer Anti-radiation Glasses Revenue billion Forecast, by Types 2020 & 2033
- Table 34: Global Computer Anti-radiation Glasses Volume K Forecast, by Types 2020 & 2033
- Table 35: Global Computer Anti-radiation Glasses Revenue billion Forecast, by Country 2020 & 2033
- Table 36: Global Computer Anti-radiation Glasses Volume K Forecast, by Country 2020 & 2033
- Table 37: United Kingdom Computer Anti-radiation Glasses Revenue (billion) Forecast, by Application 2020 & 2033
- Table 38: United Kingdom Computer Anti-radiation Glasses Volume (K) Forecast, by Application 2020 & 2033
- Table 39: Germany Computer Anti-radiation Glasses Revenue (billion) Forecast, by Application 2020 & 2033
- Table 40: Germany Computer Anti-radiation Glasses Volume (K) Forecast, by Application 2020 & 2033
- Table 41: France Computer Anti-radiation Glasses Revenue (billion) Forecast, by Application 2020 & 2033
- Table 42: France Computer Anti-radiation Glasses Volume (K) Forecast, by Application 2020 & 2033
- Table 43: Italy Computer Anti-radiation Glasses Revenue (billion) Forecast, by Application 2020 & 2033
- Table 44: Italy Computer Anti-radiation Glasses Volume (K) Forecast, by Application 2020 & 2033
- Table 45: Spain Computer Anti-radiation Glasses Revenue (billion) Forecast, by Application 2020 & 2033
- Table 46: Spain Computer Anti-radiation Glasses Volume (K) Forecast, by Application 2020 & 2033
- Table 47: Russia Computer Anti-radiation Glasses Revenue (billion) Forecast, by Application 2020 & 2033
- Table 48: Russia Computer Anti-radiation Glasses Volume (K) Forecast, by Application 2020 & 2033
- Table 49: Benelux Computer Anti-radiation Glasses Revenue (billion) Forecast, by Application 2020 & 2033
- Table 50: Benelux Computer Anti-radiation Glasses Volume (K) Forecast, by Application 2020 & 2033
- Table 51: Nordics Computer Anti-radiation Glasses Revenue (billion) Forecast, by Application 2020 & 2033
- Table 52: Nordics Computer Anti-radiation Glasses Volume (K) Forecast, by Application 2020 & 2033
- Table 53: Rest of Europe Computer Anti-radiation Glasses Revenue (billion) Forecast, by Application 2020 & 2033
- Table 54: Rest of Europe Computer Anti-radiation Glasses Volume (K) Forecast, by Application 2020 & 2033
- Table 55: Global Computer Anti-radiation Glasses Revenue billion Forecast, by Application 2020 & 2033
- Table 56: Global Computer Anti-radiation Glasses Volume K Forecast, by Application 2020 & 2033
- Table 57: Global Computer Anti-radiation Glasses Revenue billion Forecast, by Types 2020 & 2033
- Table 58: Global Computer Anti-radiation Glasses Volume K Forecast, by Types 2020 & 2033
- Table 59: Global Computer Anti-radiation Glasses Revenue billion Forecast, by Country 2020 & 2033
- Table 60: Global Computer Anti-radiation Glasses Volume K Forecast, by Country 2020 & 2033
- Table 61: Turkey Computer Anti-radiation Glasses Revenue (billion) Forecast, by Application 2020 & 2033
- Table 62: Turkey Computer Anti-radiation Glasses Volume (K) Forecast, by Application 2020 & 2033
- Table 63: Israel Computer Anti-radiation Glasses Revenue (billion) Forecast, by Application 2020 & 2033
- Table 64: Israel Computer Anti-radiation Glasses Volume (K) Forecast, by Application 2020 & 2033
- Table 65: GCC Computer Anti-radiation Glasses Revenue (billion) Forecast, by Application 2020 & 2033
- Table 66: GCC Computer Anti-radiation Glasses Volume (K) Forecast, by Application 2020 & 2033
- Table 67: North Africa Computer Anti-radiation Glasses Revenue (billion) Forecast, by Application 2020 & 2033
- Table 68: North Africa Computer Anti-radiation Glasses Volume (K) Forecast, by Application 2020 & 2033
- Table 69: South Africa Computer Anti-radiation Glasses Revenue (billion) Forecast, by Application 2020 & 2033
- Table 70: South Africa Computer Anti-radiation Glasses Volume (K) Forecast, by Application 2020 & 2033
- Table 71: Rest of Middle East & Africa Computer Anti-radiation Glasses Revenue (billion) Forecast, by Application 2020 & 2033
- Table 72: Rest of Middle East & Africa Computer Anti-radiation Glasses Volume (K) Forecast, by Application 2020 & 2033
- Table 73: Global Computer Anti-radiation Glasses Revenue billion Forecast, by Application 2020 & 2033
- Table 74: Global Computer Anti-radiation Glasses Volume K Forecast, by Application 2020 & 2033
- Table 75: Global Computer Anti-radiation Glasses Revenue billion Forecast, by Types 2020 & 2033
- Table 76: Global Computer Anti-radiation Glasses Volume K Forecast, by Types 2020 & 2033
- Table 77: Global Computer Anti-radiation Glasses Revenue billion Forecast, by Country 2020 & 2033
- Table 78: Global Computer Anti-radiation Glasses Volume K Forecast, by Country 2020 & 2033
- Table 79: China Computer Anti-radiation Glasses Revenue (billion) Forecast, by Application 2020 & 2033
- Table 80: China Computer Anti-radiation Glasses Volume (K) Forecast, by Application 2020 & 2033
- Table 81: India Computer Anti-radiation Glasses Revenue (billion) Forecast, by Application 2020 & 2033
- Table 82: India Computer Anti-radiation Glasses Volume (K) Forecast, by Application 2020 & 2033
- Table 83: Japan Computer Anti-radiation Glasses Revenue (billion) Forecast, by Application 2020 & 2033
- Table 84: Japan Computer Anti-radiation Glasses Volume (K) Forecast, by Application 2020 & 2033
- Table 85: South Korea Computer Anti-radiation Glasses Revenue (billion) Forecast, by Application 2020 & 2033
- Table 86: South Korea Computer Anti-radiation Glasses Volume (K) Forecast, by Application 2020 & 2033
- Table 87: ASEAN Computer Anti-radiation Glasses Revenue (billion) Forecast, by Application 2020 & 2033
- Table 88: ASEAN Computer Anti-radiation Glasses Volume (K) Forecast, by Application 2020 & 2033
- Table 89: Oceania Computer Anti-radiation Glasses Revenue (billion) Forecast, by Application 2020 & 2033
- Table 90: Oceania Computer Anti-radiation Glasses Volume (K) Forecast, by Application 2020 & 2033
- Table 91: Rest of Asia Pacific Computer Anti-radiation Glasses Revenue (billion) Forecast, by Application 2020 & 2033
- Table 92: Rest of Asia Pacific Computer Anti-radiation Glasses Volume (K) Forecast, by Application 2020 & 2033
Frequently Asked Questions
1. What is the projected Compound Annual Growth Rate (CAGR) of the Computer Anti-radiation Glasses?
The projected CAGR is approximately 12.43%.
2. Which companies are prominent players in the Computer Anti-radiation Glasses?
Key companies in the market include Phillips Safety, LITE TECH, Protech Medical, Deutsch Medical, Wolf X-Ray, Essilor International, BarrierTechnologies, Supertech, Corning, Uvex Safety Group, Kiran, MAVIG, NoIR Laser Company, Thorlabs, BolleSafety, Mirion Medical, ProtecX Medical, Carl Zeiss.
3. What are the main segments of the Computer Anti-radiation Glasses?
The market segments include Application, Types.
4. Can you provide details about the market size?
The market size is estimated to be USD 8.82 billion as of 2022.
5. What are some drivers contributing to market growth?
N/A
6. What are the notable trends driving market growth?
N/A
7. Are there any restraints impacting market growth?
N/A
8. Can you provide examples of recent developments in the market?
N/A
9. What pricing options are available for accessing the report?
Pricing options include single-user, multi-user, and enterprise licenses priced at USD 3350.00, USD 5025.00, and USD 6700.00 respectively.
10. Is the market size provided in terms of value or volume?
The market size is provided in terms of value, measured in billion and volume, measured in K.
11. Are there any specific market keywords associated with the report?
Yes, the market keyword associated with the report is "Computer Anti-radiation Glasses," which aids in identifying and referencing the specific market segment covered.
12. How do I determine which pricing option suits my needs best?
The pricing options vary based on user requirements and access needs. Individual users may opt for single-user licenses, while businesses requiring broader access may choose multi-user or enterprise licenses for cost-effective access to the report.
13. Are there any additional resources or data provided in the Computer Anti-radiation Glasses report?
While the report offers comprehensive insights, it's advisable to review the specific contents or supplementary materials provided to ascertain if additional resources or data are available.
14. How can I stay updated on further developments or reports in the Computer Anti-radiation Glasses?
To stay informed about further developments, trends, and reports in the Computer Anti-radiation Glasses, consider subscribing to industry newsletters, following relevant companies and organizations, or regularly checking reputable industry news sources and publications.
Methodology
Step 1 - Identification of Relevant Samples Size from Population Database


Step 2 - Approaches for Defining Global Market Size (Value, Volume* & Price*)

Note*: In applicable scenarios
Step 3 - Data Sources
Primary Research
- Web Analytics
- Survey Reports
- Research Institute
- Latest Research Reports
- Opinion Leaders
Secondary Research
- Annual Reports
- White Paper
- Latest Press Release
- Industry Association
- Paid Database
- Investor Presentations

Step 4 - Data Triangulation
Involves using different sources of information in order to increase the validity of a study
These sources are likely to be stakeholders in a program - participants, other researchers, program staff, other community members, and so on.
Then we put all data in single framework & apply various statistical tools to find out the dynamic on the market.
During the analysis stage, feedback from the stakeholder groups would be compared to determine areas of agreement as well as areas of divergence