

Key Insights
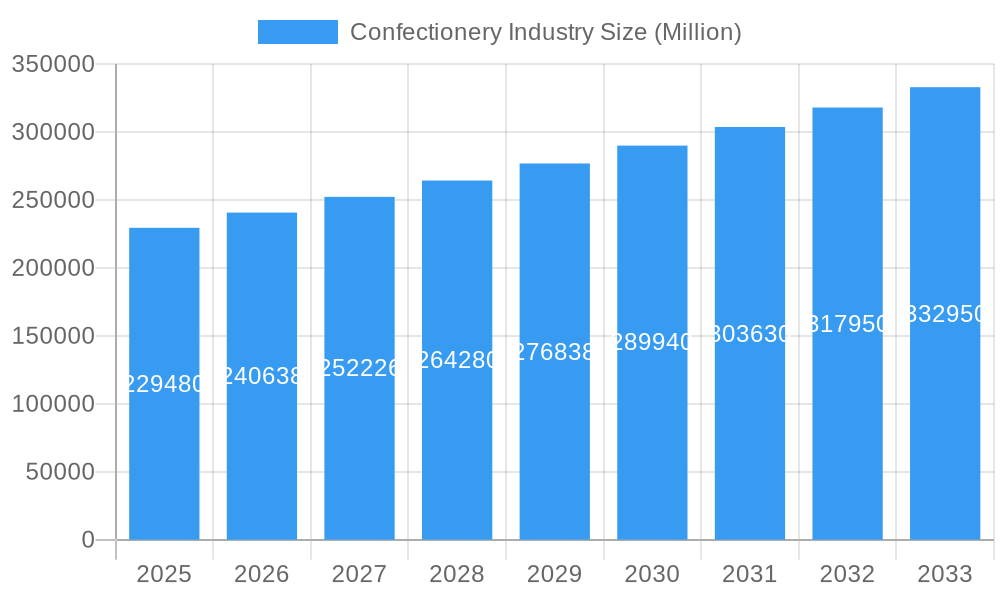
The global confectionery market, valued at $83.5 billion in 2025, is poised for significant growth. This expansion is driven by rising disposable incomes in emerging economies, product innovation including healthier options and functional ingredients, and the expanding reach of e-commerce. Key challenges include growing health concerns related to sugar consumption and increasing obesity rates, alongside government regulations. Chocolate dominates the market, with candies and gums following. Online retail and supermarkets are leading distribution channels. Major players like Nestlé, Lindt, and Ferrero leverage brand strength and distribution, while smaller firms target niche markets. The competitive landscape is dynamic, marked by strategic consolidations.
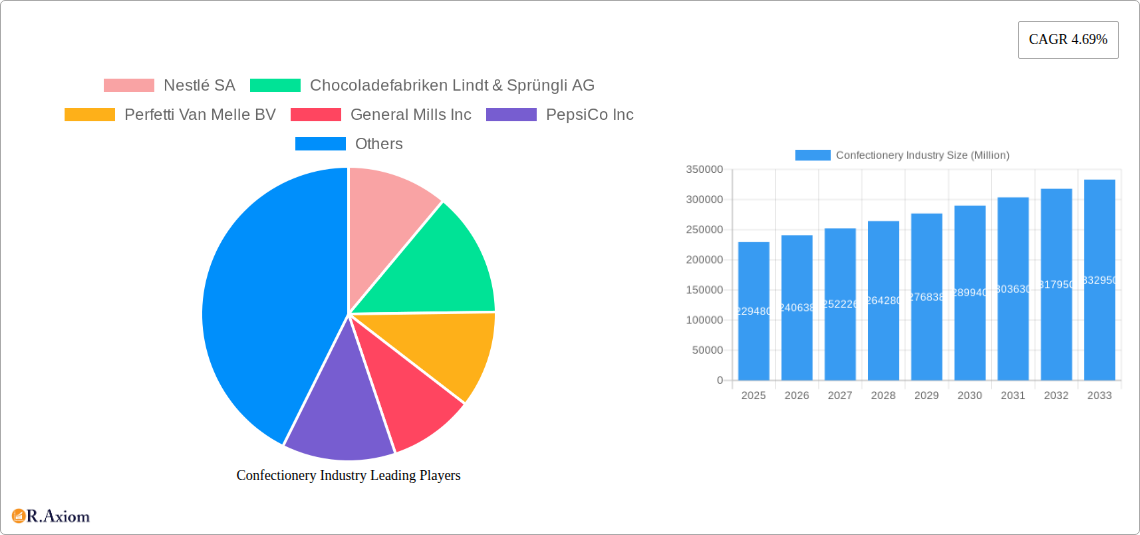
Confectionery Industry Market Size (In Billion)
The forecast period (2025-2033) indicates continued market expansion, with a projected Compound Annual Growth Rate (CAGR) of 1.5%. Growth will be fueled by premiumization and evolving consumer preferences for healthier, sustainable confectionery. Geographic expansion into untapped emerging markets is a key strategy. Despite persistent health and regulatory challenges, the industry's adaptability and innovation point to a promising future with diverse offerings and efficient distribution.
Confectionery Industry Company Market Share
This report offers a comprehensive analysis of the global confectionery industry, covering market size, segmentation, key players, trends, and future projections. The study period spans 2019-2033, with a base year of 2025 and a forecast period of 2025-2033, providing critical insights for stakeholders and decision-makers.
Confectionery Industry Market Concentration & Innovation
This section analyzes the competitive landscape of the confectionery industry, exploring market concentration, innovation drivers, regulatory frameworks, and mergers & acquisitions (M&A) activities. The global confectionery market is characterized by a moderately high level of concentration, with a few multinational giants holding significant market share. Nestlé SA, Mars Incorporated, and Mondelez International Inc. are amongst the leading players, collectively controlling an estimated xx% of the global market in 2024. However, regional players and smaller niche brands also contribute significantly to market diversity.
Market Concentration Metrics (2024):
- Top 3 players' combined market share: xx%
- Top 5 players' combined market share: xx%
- Average market share of the top 10 players: xx%
Innovation Drivers:
- Growing demand for premium and specialized confectionery products (e.g., organic, vegan, gluten-free).
- Technological advancements in production processes, packaging, and product formulation.
- Increasing consumer preference for healthier and functional confectionery options.
Regulatory Frameworks & Product Substitutes:
- Stringent regulations regarding sugar content, artificial additives, and labeling are influencing product formulation and marketing strategies.
- The rise of healthy snack alternatives (e.g., fruit, nuts, yogurt) presents a competitive challenge to traditional confectionery products.
M&A Activities:
- The confectionery industry has witnessed several significant M&A deals in recent years, driven by the desire for expansion, diversification, and market consolidation. Deal values have ranged from tens of Millions to several Billion US Dollars. The acquisition of Dori Alimentos by Ferrara Candy Co. in July 2023 exemplifies this trend.
End-User Trends:
- The increasing demand for convenient and on-the-go snacking options is fueling growth in the convenience store and online retail channels.
- Health-conscious consumers are driving demand for healthier confectionery products with reduced sugar content and natural ingredients.
Confectionery Industry Industry Trends & Insights
The global confectionery market is projected to exhibit a CAGR of xx% during the forecast period (2025-2033), driven by several key factors. Rising disposable incomes in emerging economies, coupled with changing consumer preferences and increased demand for premium confectionery products, are fueling market expansion. Technological advancements in manufacturing and packaging are improving efficiency and enabling the development of innovative product formats. However, fluctuations in raw material prices and increasing health concerns related to sugar consumption pose significant challenges. Market penetration within various segments varies significantly, with chocolate confectionery maintaining a dominant position. The growing popularity of online retail channels is significantly altering the distribution landscape.
Market Growth Drivers:
- Growing disposable incomes in developing countries
- Increasing demand for premium and specialized confectionery products
- Technological advancements leading to efficiency gains
- Expansion of online retail channels
Technological Disruptions:
- Automation and robotics in manufacturing processes
- Innovative packaging solutions to enhance shelf life and consumer experience
- 3D printing technology for customized confectionery products
Consumer Preferences:
- Shift towards healthier confectionery options (reduced sugar, organic, natural ingredients)
- Growing preference for premium and experiential confectionery
- Demand for personalized and customized confectionery products
Competitive Dynamics:
- Intense competition among established players and the emergence of innovative new entrants
- Price wars and promotional activities are common strategies
- Focus on brand building and product differentiation to gain market share
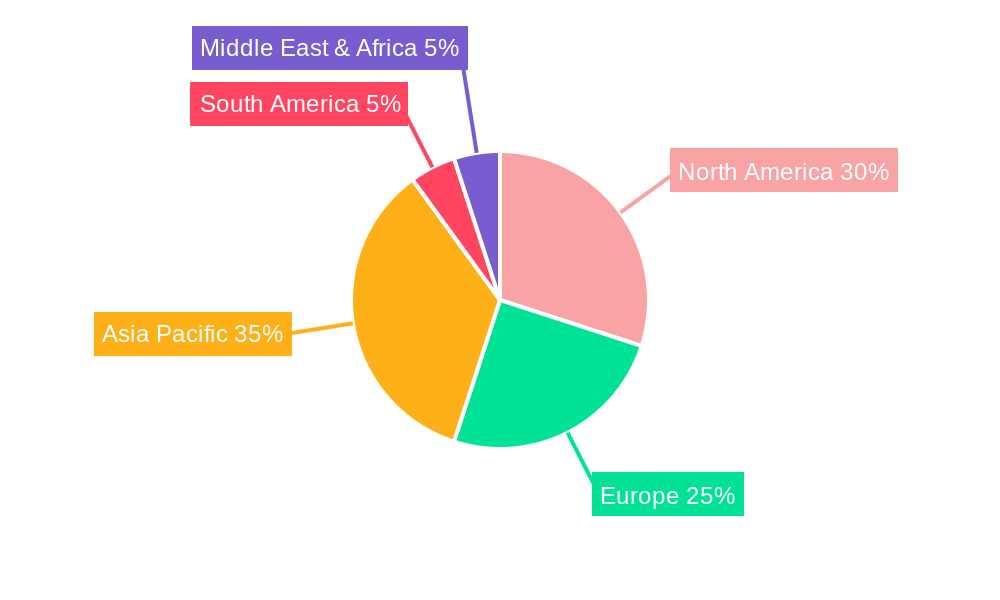
Dominant Markets & Segments in Confectionery Industry
The North American and European regions currently dominate the global confectionery market, but significant growth opportunities exist in Asia-Pacific and other developing regions. Within distribution channels, supermarkets/hypermarkets maintain the largest share, followed by convenience stores and online retail stores. Chocolate confectionery holds a dominant position within the product segment, but other types of confectionery, such as gum, candy, and other sweets, contribute significantly to market size.
Dominant Regions & Countries:
- North America: High per capita consumption, established distribution networks, and strong consumer demand.
- Europe: Mature market with diverse product offerings and established brands.
- Asia-Pacific: Rapidly expanding market driven by rising disposable incomes and increasing urbanization.
Dominant Segments:
- Distribution Channel: Supermarkets/hypermarkets benefit from scale and established distribution networks. Online retail is experiencing strong growth driven by e-commerce penetration and convenience. Convenience stores cater to impulse purchases and on-the-go consumption.
- Confections: Chocolate maintains its dominance due to its popularity and versatility. However, other confectionery categories, such as gum and hard candy, also show robust growth.
Key Drivers of Segment Dominance:
- Supermarkets/Hypermarkets: Wide product availability, established distribution networks, and competitive pricing strategies.
- Chocolate Confectionery: Strong consumer preference, versatile product applications (bars, candies, desserts), and established brands.
Confectionery Industry Product Developments
Recent innovations in the confectionery industry have focused on healthier options, such as reduced sugar formulations, the use of natural ingredients, and the development of functional confectionery products with added nutritional benefits. Technological advancements in production processes, such as automation and 3D printing, have enhanced efficiency and customization possibilities. New product formats and packaging designs are aimed at enhancing consumer experience and shelf appeal. These innovations reflect a response to evolving consumer preferences and competitive pressures.
Report Scope & Segmentation Analysis
This report segments the confectionery market by distribution channel (Convenience Store, Online Retail Store, Supermarket/Hypermarket, Others) and confectionery type (Chocolate, Others). Each segment's growth projection, market size, and competitive dynamics are analyzed in detail. The chocolate segment is projected to maintain its dominant position, but the “others” segment, encompassing hard candies, gums, and other sweets, also exhibits substantial growth potential, especially in developing economies. Online retail is anticipated to experience significant growth across all confectionery types, driven by e-commerce expansion.
Key Drivers of Confectionery Industry Growth
Several factors are driving the growth of the confectionery industry. These include increasing disposable incomes, particularly in emerging markets, leading to higher discretionary spending on confectionery products. Changing lifestyles and increased urbanization have increased snacking frequency, benefiting the confectionery sector. Technological advancements in production and packaging have streamlined processes and enabled the creation of new and innovative products. Moreover, effective marketing and branding strategies play a significant role in driving sales.
Challenges in the Confectionery Industry Sector
The confectionery industry faces several challenges, including increasing health consciousness among consumers leading to a shift toward healthier alternatives. Fluctuations in raw material prices, particularly sugar and cocoa, impact profitability and pricing strategies. Stringent regulatory frameworks regarding sugar content and labeling necessitate product reformulations and marketing adjustments. Intense competition among established players and the emergence of new entrants create price pressures and necessitate continuous innovation.
Emerging Opportunities in Confectionery Industry
Emerging opportunities in the confectionery industry include the rising demand for premium and specialized confectionery, such as organic, vegan, and gluten-free products. The growth of online retail channels presents significant distribution opportunities. The increasing popularity of personalized and customized confectionery products offers avenues for innovative product development. Expanding into new and developing markets with significant growth potential is another key opportunity.
Leading Players in the Confectionery Industry Market
- Nestlé SA
- Chocoladefabriken Lindt & Sprüngli AG
- Perfetti Van Melle BV
- General Mills Inc
- PepsiCo Inc
- August Storck KG
- Ferrero International SA
- Mars Incorporated
- Yıldız Holding A.Ş.
- Lotte Corporation
- HARIBO Holding GmbH & Co KG
- Mondelēz International Inc
- Meiji Holdings Company Ltd
- The Hershey Company
- Kellogg Company
Key Developments in Confectionery Industry Industry
- July 2023: HARIBO® opened its first North American manufacturing facility, boosting US gummi production and responding to increased consumer demand.
- July 2023: Ferrero's Ferrara Candy Co. acquired Dori Alimentos, expanding its presence in the Brazilian chocolate and confectionery market.
- August 2023: Ferrero North America showcased new Kinder Chocolate products and seasonal offerings at the Sweets & Snacks Expo in Chicago.
Strategic Outlook for Confectionery Industry Market
The confectionery industry is poised for continued growth, driven by evolving consumer preferences, technological advancements, and expansion into new markets. Companies focusing on health-conscious options, innovative product formats, and effective branding strategies are well-positioned for success. The strategic use of online channels and e-commerce platforms will be crucial for capturing market share and driving revenue growth. The industry's future hinges on adapting to changing consumer demands while managing challenges related to health concerns, raw material costs, and regulatory changes.
Confectionery Industry Segmentation
-
1. Confections
-
1.1. Chocolate
-
1.1.1. By Confectionery Variant
- 1.1.1.1. Dark Chocolate
- 1.1.1.2. Milk and White Chocolate
-
1.1.1. By Confectionery Variant
-
1.2. Gums
- 1.2.1. Bubble Gum
-
1.2.2. Chewing Gum
-
1.2.2.1. By Sugar Content
- 1.2.2.1.1. Sugar Chewing Gum
- 1.2.2.1.2. Sugar-free Chewing Gum
-
1.2.2.1. By Sugar Content
-
1.3. Snack Bar
- 1.3.1. Cereal Bar
- 1.3.2. Fruit & Nut Bar
- 1.3.3. Protein Bar
-
1.4. Sugar Confectionery
- 1.4.1. Hard Candy
- 1.4.2. Lollipops
- 1.4.3. Mints
- 1.4.4. Pastilles, Gummies, and Jellies
- 1.4.5. Toffees and Nougats
- 1.4.6. Others
-
1.1. Chocolate
-
2. Distribution Channel
- 2.1. Convenience Store
- 2.2. Online Retail Store
- 2.3. Supermarket/Hypermarket
- 2.4. Others
Confectionery Industry Segmentation By Geography
-
1. North America
- 1.1. United States
- 1.2. Canada
- 1.3. Mexico
-
2. South America
- 2.1. Brazil
- 2.2. Argentina
- 2.3. Rest of South America
-
3. Europe
- 3.1. United Kingdom
- 3.2. Germany
- 3.3. France
- 3.4. Italy
- 3.5. Spain
- 3.6. Russia
- 3.7. Benelux
- 3.8. Nordics
- 3.9. Rest of Europe
-
4. Middle East & Africa
- 4.1. Turkey
- 4.2. Israel
- 4.3. GCC
- 4.4. North Africa
- 4.5. South Africa
- 4.6. Rest of Middle East & Africa
-
5. Asia Pacific
- 5.1. China
- 5.2. India
- 5.3. Japan
- 5.4. South Korea
- 5.5. ASEAN
- 5.6. Oceania
- 5.7. Rest of Asia Pacific
Confectionery Industry Regional Market Share
Geographic Coverage of Confectionery Industry
Confectionery Industry REPORT HIGHLIGHTS
| Aspects | Details |
|---|---|
| Study Period | 2020-2034 |
| Base Year | 2025 |
| Estimated Year | 2026 |
| Forecast Period | 2026-2034 |
| Historical Period | 2020-2025 |
| Growth Rate | CAGR of 1.5% from 2020-2034 |
| Segmentation |
|
Table of Contents
- 1. Introduction
- 1.1. Research Scope
- 1.2. Market Segmentation
- 1.3. Research Objective
- 1.4. Definitions and Assumptions
- 2. Executive Summary
- 2.1. Market Snapshot
- 3. Market Dynamics
- 3.1. Market Drivers
- 3.2. Market Restrains
- 3.3. Market Trends
- 3.4. Market Opportunities
- 4. Market Factor Analysis
- 4.1. Porters Five Forces
- 4.1.1. Bargaining Power of Suppliers
- 4.1.2. Bargaining Power of Buyers
- 4.1.3. Threat of New Entrants
- 4.1.4. Threat of Substitutes
- 4.1.5. Competitive Rivalry
- 4.2. PESTEL analysis
- 4.3. BCG Analysis
- 4.3.1. Stars (High Growth, High Market Share)
- 4.3.2. Cash Cows (Low Growth, High Market Share)
- 4.3.3. Question Mark (High Growth, Low Market Share)
- 4.3.4. Dogs (Low Growth, Low Market Share)
- 4.4. Ansoff Matrix Analysis
- 4.5. Supply Chain Analysis
- 4.6. Regulatory Landscape
- 4.7. Current Market Potential and Opportunity Assessment (TAM–SAM–SOM Framework)
- 4.8. RAX Analyst Note
- 4.1. Porters Five Forces
- 5. Market Analysis, Insights and Forecast 2021-2033
- 5.1. Market Analysis, Insights and Forecast - by Confections
- 5.1.1. Chocolate
- 5.1.1.1. By Confectionery Variant
- 5.1.1.1.1. Dark Chocolate
- 5.1.1.1.2. Milk and White Chocolate
- 5.1.1.1. By Confectionery Variant
- 5.1.2. Gums
- 5.1.2.1. Bubble Gum
- 5.1.2.2. Chewing Gum
- 5.1.2.2.1. By Sugar Content
- 5.1.2.2.1.1. Sugar Chewing Gum
- 5.1.2.2.1.2. Sugar-free Chewing Gum
- 5.1.2.2.1. By Sugar Content
- 5.1.3. Snack Bar
- 5.1.3.1. Cereal Bar
- 5.1.3.2. Fruit & Nut Bar
- 5.1.3.3. Protein Bar
- 5.1.4. Sugar Confectionery
- 5.1.4.1. Hard Candy
- 5.1.4.2. Lollipops
- 5.1.4.3. Mints
- 5.1.4.4. Pastilles, Gummies, and Jellies
- 5.1.4.5. Toffees and Nougats
- 5.1.4.6. Others
- 5.1.1. Chocolate
- 5.2. Market Analysis, Insights and Forecast - by Distribution Channel
- 5.2.1. Convenience Store
- 5.2.2. Online Retail Store
- 5.2.3. Supermarket/Hypermarket
- 5.2.4. Others
- 5.3. Market Analysis, Insights and Forecast - by Region
- 5.3.1. North America
- 5.3.2. South America
- 5.3.3. Europe
- 5.3.4. Middle East & Africa
- 5.3.5. Asia Pacific
- 5.1. Market Analysis, Insights and Forecast - by Confections
- 6. Global Confectionery Industry Analysis, Insights and Forecast, 2021-2033
- 6.1. Market Analysis, Insights and Forecast - by Confections
- 6.1.1. Chocolate
- 6.1.1.1. By Confectionery Variant
- 6.1.1.1.1. Dark Chocolate
- 6.1.1.1.2. Milk and White Chocolate
- 6.1.1.1. By Confectionery Variant
- 6.1.2. Gums
- 6.1.2.1. Bubble Gum
- 6.1.2.2. Chewing Gum
- 6.1.2.2.1. By Sugar Content
- 6.1.2.2.1.1. Sugar Chewing Gum
- 6.1.2.2.1.2. Sugar-free Chewing Gum
- 6.1.2.2.1. By Sugar Content
- 6.1.3. Snack Bar
- 6.1.3.1. Cereal Bar
- 6.1.3.2. Fruit & Nut Bar
- 6.1.3.3. Protein Bar
- 6.1.4. Sugar Confectionery
- 6.1.4.1. Hard Candy
- 6.1.4.2. Lollipops
- 6.1.4.3. Mints
- 6.1.4.4. Pastilles, Gummies, and Jellies
- 6.1.4.5. Toffees and Nougats
- 6.1.4.6. Others
- 6.1.1. Chocolate
- 6.2. Market Analysis, Insights and Forecast - by Distribution Channel
- 6.2.1. Convenience Store
- 6.2.2. Online Retail Store
- 6.2.3. Supermarket/Hypermarket
- 6.2.4. Others
- 6.1. Market Analysis, Insights and Forecast - by Confections
- 7. North America Confectionery Industry Analysis, Insights and Forecast, 2020-2032
- 7.1. Market Analysis, Insights and Forecast - by Confections
- 7.1.1. Chocolate
- 7.1.1.1. By Confectionery Variant
- 7.1.1.1.1. Dark Chocolate
- 7.1.1.1.2. Milk and White Chocolate
- 7.1.1.1. By Confectionery Variant
- 7.1.2. Gums
- 7.1.2.1. Bubble Gum
- 7.1.2.2. Chewing Gum
- 7.1.2.2.1. By Sugar Content
- 7.1.2.2.1.1. Sugar Chewing Gum
- 7.1.2.2.1.2. Sugar-free Chewing Gum
- 7.1.2.2.1. By Sugar Content
- 7.1.3. Snack Bar
- 7.1.3.1. Cereal Bar
- 7.1.3.2. Fruit & Nut Bar
- 7.1.3.3. Protein Bar
- 7.1.4. Sugar Confectionery
- 7.1.4.1. Hard Candy
- 7.1.4.2. Lollipops
- 7.1.4.3. Mints
- 7.1.4.4. Pastilles, Gummies, and Jellies
- 7.1.4.5. Toffees and Nougats
- 7.1.4.6. Others
- 7.1.1. Chocolate
- 7.2. Market Analysis, Insights and Forecast - by Distribution Channel
- 7.2.1. Convenience Store
- 7.2.2. Online Retail Store
- 7.2.3. Supermarket/Hypermarket
- 7.2.4. Others
- 7.1. Market Analysis, Insights and Forecast - by Confections
- 8. South America Confectionery Industry Analysis, Insights and Forecast, 2020-2032
- 8.1. Market Analysis, Insights and Forecast - by Confections
- 8.1.1. Chocolate
- 8.1.1.1. By Confectionery Variant
- 8.1.1.1.1. Dark Chocolate
- 8.1.1.1.2. Milk and White Chocolate
- 8.1.1.1. By Confectionery Variant
- 8.1.2. Gums
- 8.1.2.1. Bubble Gum
- 8.1.2.2. Chewing Gum
- 8.1.2.2.1. By Sugar Content
- 8.1.2.2.1.1. Sugar Chewing Gum
- 8.1.2.2.1.2. Sugar-free Chewing Gum
- 8.1.2.2.1. By Sugar Content
- 8.1.3. Snack Bar
- 8.1.3.1. Cereal Bar
- 8.1.3.2. Fruit & Nut Bar
- 8.1.3.3. Protein Bar
- 8.1.4. Sugar Confectionery
- 8.1.4.1. Hard Candy
- 8.1.4.2. Lollipops
- 8.1.4.3. Mints
- 8.1.4.4. Pastilles, Gummies, and Jellies
- 8.1.4.5. Toffees and Nougats
- 8.1.4.6. Others
- 8.1.1. Chocolate
- 8.2. Market Analysis, Insights and Forecast - by Distribution Channel
- 8.2.1. Convenience Store
- 8.2.2. Online Retail Store
- 8.2.3. Supermarket/Hypermarket
- 8.2.4. Others
- 8.1. Market Analysis, Insights and Forecast - by Confections
- 9. Europe Confectionery Industry Analysis, Insights and Forecast, 2020-2032
- 9.1. Market Analysis, Insights and Forecast - by Confections
- 9.1.1. Chocolate
- 9.1.1.1. By Confectionery Variant
- 9.1.1.1.1. Dark Chocolate
- 9.1.1.1.2. Milk and White Chocolate
- 9.1.1.1. By Confectionery Variant
- 9.1.2. Gums
- 9.1.2.1. Bubble Gum
- 9.1.2.2. Chewing Gum
- 9.1.2.2.1. By Sugar Content
- 9.1.2.2.1.1. Sugar Chewing Gum
- 9.1.2.2.1.2. Sugar-free Chewing Gum
- 9.1.2.2.1. By Sugar Content
- 9.1.3. Snack Bar
- 9.1.3.1. Cereal Bar
- 9.1.3.2. Fruit & Nut Bar
- 9.1.3.3. Protein Bar
- 9.1.4. Sugar Confectionery
- 9.1.4.1. Hard Candy
- 9.1.4.2. Lollipops
- 9.1.4.3. Mints
- 9.1.4.4. Pastilles, Gummies, and Jellies
- 9.1.4.5. Toffees and Nougats
- 9.1.4.6. Others
- 9.1.1. Chocolate
- 9.2. Market Analysis, Insights and Forecast - by Distribution Channel
- 9.2.1. Convenience Store
- 9.2.2. Online Retail Store
- 9.2.3. Supermarket/Hypermarket
- 9.2.4. Others
- 9.1. Market Analysis, Insights and Forecast - by Confections
- 10. Middle East & Africa Confectionery Industry Analysis, Insights and Forecast, 2020-2032
- 10.1. Market Analysis, Insights and Forecast - by Confections
- 10.1.1. Chocolate
- 10.1.1.1. By Confectionery Variant
- 10.1.1.1.1. Dark Chocolate
- 10.1.1.1.2. Milk and White Chocolate
- 10.1.1.1. By Confectionery Variant
- 10.1.2. Gums
- 10.1.2.1. Bubble Gum
- 10.1.2.2. Chewing Gum
- 10.1.2.2.1. By Sugar Content
- 10.1.2.2.1.1. Sugar Chewing Gum
- 10.1.2.2.1.2. Sugar-free Chewing Gum
- 10.1.2.2.1. By Sugar Content
- 10.1.3. Snack Bar
- 10.1.3.1. Cereal Bar
- 10.1.3.2. Fruit & Nut Bar
- 10.1.3.3. Protein Bar
- 10.1.4. Sugar Confectionery
- 10.1.4.1. Hard Candy
- 10.1.4.2. Lollipops
- 10.1.4.3. Mints
- 10.1.4.4. Pastilles, Gummies, and Jellies
- 10.1.4.5. Toffees and Nougats
- 10.1.4.6. Others
- 10.1.1. Chocolate
- 10.2. Market Analysis, Insights and Forecast - by Distribution Channel
- 10.2.1. Convenience Store
- 10.2.2. Online Retail Store
- 10.2.3. Supermarket/Hypermarket
- 10.2.4. Others
- 10.1. Market Analysis, Insights and Forecast - by Confections
- 11. Asia Pacific Confectionery Industry Analysis, Insights and Forecast, 2020-2032
- 11.1. Market Analysis, Insights and Forecast - by Confections
- 11.1.1. Chocolate
- 11.1.1.1. By Confectionery Variant
- 11.1.1.1.1. Dark Chocolate
- 11.1.1.1.2. Milk and White Chocolate
- 11.1.1.1. By Confectionery Variant
- 11.1.2. Gums
- 11.1.2.1. Bubble Gum
- 11.1.2.2. Chewing Gum
- 11.1.2.2.1. By Sugar Content
- 11.1.2.2.1.1. Sugar Chewing Gum
- 11.1.2.2.1.2. Sugar-free Chewing Gum
- 11.1.2.2.1. By Sugar Content
- 11.1.3. Snack Bar
- 11.1.3.1. Cereal Bar
- 11.1.3.2. Fruit & Nut Bar
- 11.1.3.3. Protein Bar
- 11.1.4. Sugar Confectionery
- 11.1.4.1. Hard Candy
- 11.1.4.2. Lollipops
- 11.1.4.3. Mints
- 11.1.4.4. Pastilles, Gummies, and Jellies
- 11.1.4.5. Toffees and Nougats
- 11.1.4.6. Others
- 11.1.1. Chocolate
- 11.2. Market Analysis, Insights and Forecast - by Distribution Channel
- 11.2.1. Convenience Store
- 11.2.2. Online Retail Store
- 11.2.3. Supermarket/Hypermarket
- 11.2.4. Others
- 11.1. Market Analysis, Insights and Forecast - by Confections
- 12. Competitive Analysis
- 12.1. Company Profiles
- 12.1.1 Nestlé SA
- 12.1.1.1. Company Overview
- 12.1.1.2. Products
- 12.1.1.3. Company Financials
- 12.1.1.4. SWOT Analysis
- 12.1.2 Chocoladefabriken Lindt & Sprüngli AG
- 12.1.2.1. Company Overview
- 12.1.2.2. Products
- 12.1.2.3. Company Financials
- 12.1.2.4. SWOT Analysis
- 12.1.3 Perfetti Van Melle BV
- 12.1.3.1. Company Overview
- 12.1.3.2. Products
- 12.1.3.3. Company Financials
- 12.1.3.4. SWOT Analysis
- 12.1.4 General Mills Inc
- 12.1.4.1. Company Overview
- 12.1.4.2. Products
- 12.1.4.3. Company Financials
- 12.1.4.4. SWOT Analysis
- 12.1.5 PepsiCo Inc
- 12.1.5.1. Company Overview
- 12.1.5.2. Products
- 12.1.5.3. Company Financials
- 12.1.5.4. SWOT Analysis
- 12.1.6 August Storck KG
- 12.1.6.1. Company Overview
- 12.1.6.2. Products
- 12.1.6.3. Company Financials
- 12.1.6.4. SWOT Analysis
- 12.1.7 Ferrero International SA
- 12.1.7.1. Company Overview
- 12.1.7.2. Products
- 12.1.7.3. Company Financials
- 12.1.7.4. SWOT Analysis
- 12.1.8 Mars Incorporated
- 12.1.8.1. Company Overview
- 12.1.8.2. Products
- 12.1.8.3. Company Financials
- 12.1.8.4. SWOT Analysis
- 12.1.9 Yıldız Holding A
- 12.1.9.1. Company Overview
- 12.1.9.2. Products
- 12.1.9.3. Company Financials
- 12.1.9.4. SWOT Analysis
- 12.1.10 Lotte Corporation
- 12.1.10.1. Company Overview
- 12.1.10.2. Products
- 12.1.10.3. Company Financials
- 12.1.10.4. SWOT Analysis
- 12.1.11 HARIBO Holding GmbH & Co KG
- 12.1.11.1. Company Overview
- 12.1.11.2. Products
- 12.1.11.3. Company Financials
- 12.1.11.4. SWOT Analysis
- 12.1.12 Mondelēz International Inc
- 12.1.12.1. Company Overview
- 12.1.12.2. Products
- 12.1.12.3. Company Financials
- 12.1.12.4. SWOT Analysis
- 12.1.13 Meiji Holdings Company Ltd
- 12.1.13.1. Company Overview
- 12.1.13.2. Products
- 12.1.13.3. Company Financials
- 12.1.13.4. SWOT Analysis
- 12.1.14 The Hershey Company
- 12.1.14.1. Company Overview
- 12.1.14.2. Products
- 12.1.14.3. Company Financials
- 12.1.14.4. SWOT Analysis
- 12.1.15 Kellogg Company
- 12.1.15.1. Company Overview
- 12.1.15.2. Products
- 12.1.15.3. Company Financials
- 12.1.15.4. SWOT Analysis
- 12.1.1 Nestlé SA
- 12.2. Market Entropy
- 12.2.1 Company's Key Areas Served
- 12.2.2 Recent Developments
- 12.3. Company Market Share Analysis 2025
- 12.3.1 Top 5 Companies Market Share Analysis
- 12.3.2 Top 3 Companies Market Share Analysis
- 12.4. List of Potential Customers
- 13. Research Methodology
List of Figures
- Figure 1: Global Confectionery Industry Revenue Breakdown (billion, %) by Region 2025 & 2033
- Figure 2: Global Confectionery Industry Volume Breakdown (K Tons, %) by Region 2025 & 2033
- Figure 3: North America Confectionery Industry Revenue (billion), by Confections 2025 & 2033
- Figure 4: North America Confectionery Industry Volume (K Tons), by Confections 2025 & 2033
- Figure 5: North America Confectionery Industry Revenue Share (%), by Confections 2025 & 2033
- Figure 6: North America Confectionery Industry Volume Share (%), by Confections 2025 & 2033
- Figure 7: North America Confectionery Industry Revenue (billion), by Distribution Channel 2025 & 2033
- Figure 8: North America Confectionery Industry Volume (K Tons), by Distribution Channel 2025 & 2033
- Figure 9: North America Confectionery Industry Revenue Share (%), by Distribution Channel 2025 & 2033
- Figure 10: North America Confectionery Industry Volume Share (%), by Distribution Channel 2025 & 2033
- Figure 11: North America Confectionery Industry Revenue (billion), by Country 2025 & 2033
- Figure 12: North America Confectionery Industry Volume (K Tons), by Country 2025 & 2033
- Figure 13: North America Confectionery Industry Revenue Share (%), by Country 2025 & 2033
- Figure 14: North America Confectionery Industry Volume Share (%), by Country 2025 & 2033
- Figure 15: South America Confectionery Industry Revenue (billion), by Confections 2025 & 2033
- Figure 16: South America Confectionery Industry Volume (K Tons), by Confections 2025 & 2033
- Figure 17: South America Confectionery Industry Revenue Share (%), by Confections 2025 & 2033
- Figure 18: South America Confectionery Industry Volume Share (%), by Confections 2025 & 2033
- Figure 19: South America Confectionery Industry Revenue (billion), by Distribution Channel 2025 & 2033
- Figure 20: South America Confectionery Industry Volume (K Tons), by Distribution Channel 2025 & 2033
- Figure 21: South America Confectionery Industry Revenue Share (%), by Distribution Channel 2025 & 2033
- Figure 22: South America Confectionery Industry Volume Share (%), by Distribution Channel 2025 & 2033
- Figure 23: South America Confectionery Industry Revenue (billion), by Country 2025 & 2033
- Figure 24: South America Confectionery Industry Volume (K Tons), by Country 2025 & 2033
- Figure 25: South America Confectionery Industry Revenue Share (%), by Country 2025 & 2033
- Figure 26: South America Confectionery Industry Volume Share (%), by Country 2025 & 2033
- Figure 27: Europe Confectionery Industry Revenue (billion), by Confections 2025 & 2033
- Figure 28: Europe Confectionery Industry Volume (K Tons), by Confections 2025 & 2033
- Figure 29: Europe Confectionery Industry Revenue Share (%), by Confections 2025 & 2033
- Figure 30: Europe Confectionery Industry Volume Share (%), by Confections 2025 & 2033
- Figure 31: Europe Confectionery Industry Revenue (billion), by Distribution Channel 2025 & 2033
- Figure 32: Europe Confectionery Industry Volume (K Tons), by Distribution Channel 2025 & 2033
- Figure 33: Europe Confectionery Industry Revenue Share (%), by Distribution Channel 2025 & 2033
- Figure 34: Europe Confectionery Industry Volume Share (%), by Distribution Channel 2025 & 2033
- Figure 35: Europe Confectionery Industry Revenue (billion), by Country 2025 & 2033
- Figure 36: Europe Confectionery Industry Volume (K Tons), by Country 2025 & 2033
- Figure 37: Europe Confectionery Industry Revenue Share (%), by Country 2025 & 2033
- Figure 38: Europe Confectionery Industry Volume Share (%), by Country 2025 & 2033
- Figure 39: Middle East & Africa Confectionery Industry Revenue (billion), by Confections 2025 & 2033
- Figure 40: Middle East & Africa Confectionery Industry Volume (K Tons), by Confections 2025 & 2033
- Figure 41: Middle East & Africa Confectionery Industry Revenue Share (%), by Confections 2025 & 2033
- Figure 42: Middle East & Africa Confectionery Industry Volume Share (%), by Confections 2025 & 2033
- Figure 43: Middle East & Africa Confectionery Industry Revenue (billion), by Distribution Channel 2025 & 2033
- Figure 44: Middle East & Africa Confectionery Industry Volume (K Tons), by Distribution Channel 2025 & 2033
- Figure 45: Middle East & Africa Confectionery Industry Revenue Share (%), by Distribution Channel 2025 & 2033
- Figure 46: Middle East & Africa Confectionery Industry Volume Share (%), by Distribution Channel 2025 & 2033
- Figure 47: Middle East & Africa Confectionery Industry Revenue (billion), by Country 2025 & 2033
- Figure 48: Middle East & Africa Confectionery Industry Volume (K Tons), by Country 2025 & 2033
- Figure 49: Middle East & Africa Confectionery Industry Revenue Share (%), by Country 2025 & 2033
- Figure 50: Middle East & Africa Confectionery Industry Volume Share (%), by Country 2025 & 2033
- Figure 51: Asia Pacific Confectionery Industry Revenue (billion), by Confections 2025 & 2033
- Figure 52: Asia Pacific Confectionery Industry Volume (K Tons), by Confections 2025 & 2033
- Figure 53: Asia Pacific Confectionery Industry Revenue Share (%), by Confections 2025 & 2033
- Figure 54: Asia Pacific Confectionery Industry Volume Share (%), by Confections 2025 & 2033
- Figure 55: Asia Pacific Confectionery Industry Revenue (billion), by Distribution Channel 2025 & 2033
- Figure 56: Asia Pacific Confectionery Industry Volume (K Tons), by Distribution Channel 2025 & 2033
- Figure 57: Asia Pacific Confectionery Industry Revenue Share (%), by Distribution Channel 2025 & 2033
- Figure 58: Asia Pacific Confectionery Industry Volume Share (%), by Distribution Channel 2025 & 2033
- Figure 59: Asia Pacific Confectionery Industry Revenue (billion), by Country 2025 & 2033
- Figure 60: Asia Pacific Confectionery Industry Volume (K Tons), by Country 2025 & 2033
- Figure 61: Asia Pacific Confectionery Industry Revenue Share (%), by Country 2025 & 2033
- Figure 62: Asia Pacific Confectionery Industry Volume Share (%), by Country 2025 & 2033
List of Tables
- Table 1: Global Confectionery Industry Revenue billion Forecast, by Confections 2020 & 2033
- Table 2: Global Confectionery Industry Volume K Tons Forecast, by Confections 2020 & 2033
- Table 3: Global Confectionery Industry Revenue billion Forecast, by Distribution Channel 2020 & 2033
- Table 4: Global Confectionery Industry Volume K Tons Forecast, by Distribution Channel 2020 & 2033
- Table 5: Global Confectionery Industry Revenue billion Forecast, by Region 2020 & 2033
- Table 6: Global Confectionery Industry Volume K Tons Forecast, by Region 2020 & 2033
- Table 7: Global Confectionery Industry Revenue billion Forecast, by Confections 2020 & 2033
- Table 8: Global Confectionery Industry Volume K Tons Forecast, by Confections 2020 & 2033
- Table 9: Global Confectionery Industry Revenue billion Forecast, by Distribution Channel 2020 & 2033
- Table 10: Global Confectionery Industry Volume K Tons Forecast, by Distribution Channel 2020 & 2033
- Table 11: Global Confectionery Industry Revenue billion Forecast, by Country 2020 & 2033
- Table 12: Global Confectionery Industry Volume K Tons Forecast, by Country 2020 & 2033
- Table 13: United States Confectionery Industry Revenue (billion) Forecast, by Application 2020 & 2033
- Table 14: United States Confectionery Industry Volume (K Tons) Forecast, by Application 2020 & 2033
- Table 15: Canada Confectionery Industry Revenue (billion) Forecast, by Application 2020 & 2033
- Table 16: Canada Confectionery Industry Volume (K Tons) Forecast, by Application 2020 & 2033
- Table 17: Mexico Confectionery Industry Revenue (billion) Forecast, by Application 2020 & 2033
- Table 18: Mexico Confectionery Industry Volume (K Tons) Forecast, by Application 2020 & 2033
- Table 19: Global Confectionery Industry Revenue billion Forecast, by Confections 2020 & 2033
- Table 20: Global Confectionery Industry Volume K Tons Forecast, by Confections 2020 & 2033
- Table 21: Global Confectionery Industry Revenue billion Forecast, by Distribution Channel 2020 & 2033
- Table 22: Global Confectionery Industry Volume K Tons Forecast, by Distribution Channel 2020 & 2033
- Table 23: Global Confectionery Industry Revenue billion Forecast, by Country 2020 & 2033
- Table 24: Global Confectionery Industry Volume K Tons Forecast, by Country 2020 & 2033
- Table 25: Brazil Confectionery Industry Revenue (billion) Forecast, by Application 2020 & 2033
- Table 26: Brazil Confectionery Industry Volume (K Tons) Forecast, by Application 2020 & 2033
- Table 27: Argentina Confectionery Industry Revenue (billion) Forecast, by Application 2020 & 2033
- Table 28: Argentina Confectionery Industry Volume (K Tons) Forecast, by Application 2020 & 2033
- Table 29: Rest of South America Confectionery Industry Revenue (billion) Forecast, by Application 2020 & 2033
- Table 30: Rest of South America Confectionery Industry Volume (K Tons) Forecast, by Application 2020 & 2033
- Table 31: Global Confectionery Industry Revenue billion Forecast, by Confections 2020 & 2033
- Table 32: Global Confectionery Industry Volume K Tons Forecast, by Confections 2020 & 2033
- Table 33: Global Confectionery Industry Revenue billion Forecast, by Distribution Channel 2020 & 2033
- Table 34: Global Confectionery Industry Volume K Tons Forecast, by Distribution Channel 2020 & 2033
- Table 35: Global Confectionery Industry Revenue billion Forecast, by Country 2020 & 2033
- Table 36: Global Confectionery Industry Volume K Tons Forecast, by Country 2020 & 2033
- Table 37: United Kingdom Confectionery Industry Revenue (billion) Forecast, by Application 2020 & 2033
- Table 38: United Kingdom Confectionery Industry Volume (K Tons) Forecast, by Application 2020 & 2033
- Table 39: Germany Confectionery Industry Revenue (billion) Forecast, by Application 2020 & 2033
- Table 40: Germany Confectionery Industry Volume (K Tons) Forecast, by Application 2020 & 2033
- Table 41: France Confectionery Industry Revenue (billion) Forecast, by Application 2020 & 2033
- Table 42: France Confectionery Industry Volume (K Tons) Forecast, by Application 2020 & 2033
- Table 43: Italy Confectionery Industry Revenue (billion) Forecast, by Application 2020 & 2033
- Table 44: Italy Confectionery Industry Volume (K Tons) Forecast, by Application 2020 & 2033
- Table 45: Spain Confectionery Industry Revenue (billion) Forecast, by Application 2020 & 2033
- Table 46: Spain Confectionery Industry Volume (K Tons) Forecast, by Application 2020 & 2033
- Table 47: Russia Confectionery Industry Revenue (billion) Forecast, by Application 2020 & 2033
- Table 48: Russia Confectionery Industry Volume (K Tons) Forecast, by Application 2020 & 2033
- Table 49: Benelux Confectionery Industry Revenue (billion) Forecast, by Application 2020 & 2033
- Table 50: Benelux Confectionery Industry Volume (K Tons) Forecast, by Application 2020 & 2033
- Table 51: Nordics Confectionery Industry Revenue (billion) Forecast, by Application 2020 & 2033
- Table 52: Nordics Confectionery Industry Volume (K Tons) Forecast, by Application 2020 & 2033
- Table 53: Rest of Europe Confectionery Industry Revenue (billion) Forecast, by Application 2020 & 2033
- Table 54: Rest of Europe Confectionery Industry Volume (K Tons) Forecast, by Application 2020 & 2033
- Table 55: Global Confectionery Industry Revenue billion Forecast, by Confections 2020 & 2033
- Table 56: Global Confectionery Industry Volume K Tons Forecast, by Confections 2020 & 2033
- Table 57: Global Confectionery Industry Revenue billion Forecast, by Distribution Channel 2020 & 2033
- Table 58: Global Confectionery Industry Volume K Tons Forecast, by Distribution Channel 2020 & 2033
- Table 59: Global Confectionery Industry Revenue billion Forecast, by Country 2020 & 2033
- Table 60: Global Confectionery Industry Volume K Tons Forecast, by Country 2020 & 2033
- Table 61: Turkey Confectionery Industry Revenue (billion) Forecast, by Application 2020 & 2033
- Table 62: Turkey Confectionery Industry Volume (K Tons) Forecast, by Application 2020 & 2033
- Table 63: Israel Confectionery Industry Revenue (billion) Forecast, by Application 2020 & 2033
- Table 64: Israel Confectionery Industry Volume (K Tons) Forecast, by Application 2020 & 2033
- Table 65: GCC Confectionery Industry Revenue (billion) Forecast, by Application 2020 & 2033
- Table 66: GCC Confectionery Industry Volume (K Tons) Forecast, by Application 2020 & 2033
- Table 67: North Africa Confectionery Industry Revenue (billion) Forecast, by Application 2020 & 2033
- Table 68: North Africa Confectionery Industry Volume (K Tons) Forecast, by Application 2020 & 2033
- Table 69: South Africa Confectionery Industry Revenue (billion) Forecast, by Application 2020 & 2033
- Table 70: South Africa Confectionery Industry Volume (K Tons) Forecast, by Application 2020 & 2033
- Table 71: Rest of Middle East & Africa Confectionery Industry Revenue (billion) Forecast, by Application 2020 & 2033
- Table 72: Rest of Middle East & Africa Confectionery Industry Volume (K Tons) Forecast, by Application 2020 & 2033
- Table 73: Global Confectionery Industry Revenue billion Forecast, by Confections 2020 & 2033
- Table 74: Global Confectionery Industry Volume K Tons Forecast, by Confections 2020 & 2033
- Table 75: Global Confectionery Industry Revenue billion Forecast, by Distribution Channel 2020 & 2033
- Table 76: Global Confectionery Industry Volume K Tons Forecast, by Distribution Channel 2020 & 2033
- Table 77: Global Confectionery Industry Revenue billion Forecast, by Country 2020 & 2033
- Table 78: Global Confectionery Industry Volume K Tons Forecast, by Country 2020 & 2033
- Table 79: China Confectionery Industry Revenue (billion) Forecast, by Application 2020 & 2033
- Table 80: China Confectionery Industry Volume (K Tons) Forecast, by Application 2020 & 2033
- Table 81: India Confectionery Industry Revenue (billion) Forecast, by Application 2020 & 2033
- Table 82: India Confectionery Industry Volume (K Tons) Forecast, by Application 2020 & 2033
- Table 83: Japan Confectionery Industry Revenue (billion) Forecast, by Application 2020 & 2033
- Table 84: Japan Confectionery Industry Volume (K Tons) Forecast, by Application 2020 & 2033
- Table 85: South Korea Confectionery Industry Revenue (billion) Forecast, by Application 2020 & 2033
- Table 86: South Korea Confectionery Industry Volume (K Tons) Forecast, by Application 2020 & 2033
- Table 87: ASEAN Confectionery Industry Revenue (billion) Forecast, by Application 2020 & 2033
- Table 88: ASEAN Confectionery Industry Volume (K Tons) Forecast, by Application 2020 & 2033
- Table 89: Oceania Confectionery Industry Revenue (billion) Forecast, by Application 2020 & 2033
- Table 90: Oceania Confectionery Industry Volume (K Tons) Forecast, by Application 2020 & 2033
- Table 91: Rest of Asia Pacific Confectionery Industry Revenue (billion) Forecast, by Application 2020 & 2033
- Table 92: Rest of Asia Pacific Confectionery Industry Volume (K Tons) Forecast, by Application 2020 & 2033
Frequently Asked Questions
1. What is the projected Compound Annual Growth Rate (CAGR) of the Confectionery Industry?
The projected CAGR is approximately 1.5%.
2. Which companies are prominent players in the Confectionery Industry?
Key companies in the market include Nestlé SA, Chocoladefabriken Lindt & Sprüngli AG, Perfetti Van Melle BV, General Mills Inc, PepsiCo Inc, August Storck KG, Ferrero International SA, Mars Incorporated, Yıldız Holding A, Lotte Corporation, HARIBO Holding GmbH & Co KG, Mondelēz International Inc, Meiji Holdings Company Ltd, The Hershey Company, Kellogg Company.
3. What are the main segments of the Confectionery Industry?
The market segments include Confections, Distribution Channel.
4. Can you provide details about the market size?
The market size is estimated to be USD 83.5 billion as of 2022.
5. What are some drivers contributing to market growth?
Increased Consumption of Baked Goods; Demand for Indigenous Fermented Foods.
6. What are the notable trends driving market growth?
OTHER KEY INDUSTRY TRENDS COVERED IN THE REPORT.
7. Are there any restraints impacting market growth?
Potential Side-effects of Yeast.
8. Can you provide examples of recent developments in the market?
August 2023: Ferrero North America, in the United States, revealed new products and seasonal offerings, including Kinder Chocolate, at the Annual Sweets & Snacks Expo in Chicago.July 2023: HARIBO® officially began gummi production at its first-ever North American manufacturing facility, located in Pleasant Prairie, Wis. The brand-new, state-of-the-art factory was created to meet the growing demand by US consumers of the beloved gummi brand, which produces over 25 varieties of gummi treats in the US and more than 1,200 types globally.July 2023: Ferrero's sister company, Ferrara Candy Co., announced the acquisition of Brazilian snacks company Dori Alimentos, which sells a variety of chocolate and sugar confectionery brands, including Dori, Pettiz, and Jubes.
9. What pricing options are available for accessing the report?
Pricing options include single-user, multi-user, and enterprise licenses priced at USD 3800, USD 4500, and USD 5800 respectively.
10. Is the market size provided in terms of value or volume?
The market size is provided in terms of value, measured in billion and volume, measured in K Tons.
11. Are there any specific market keywords associated with the report?
Yes, the market keyword associated with the report is "Confectionery Industry," which aids in identifying and referencing the specific market segment covered.
12. How do I determine which pricing option suits my needs best?
The pricing options vary based on user requirements and access needs. Individual users may opt for single-user licenses, while businesses requiring broader access may choose multi-user or enterprise licenses for cost-effective access to the report.
13. Are there any additional resources or data provided in the Confectionery Industry report?
While the report offers comprehensive insights, it's advisable to review the specific contents or supplementary materials provided to ascertain if additional resources or data are available.
14. How can I stay updated on further developments or reports in the Confectionery Industry?
To stay informed about further developments, trends, and reports in the Confectionery Industry, consider subscribing to industry newsletters, following relevant companies and organizations, or regularly checking reputable industry news sources and publications.
Methodology
Step 1 - Identification of Relevant Samples Size from Population Database


Step 2 - Approaches for Defining Global Market Size (Value, Volume* & Price*)

Note*: In applicable scenarios
Step 3 - Data Sources
Primary Research
- Web Analytics
- Survey Reports
- Research Institute
- Latest Research Reports
- Opinion Leaders
Secondary Research
- Annual Reports
- White Paper
- Latest Press Release
- Industry Association
- Paid Database
- Investor Presentations

Step 4 - Data Triangulation
Involves using different sources of information in order to increase the validity of a study
These sources are likely to be stakeholders in a program - participants, other researchers, program staff, other community members, and so on.
Then we put all data in single framework & apply various statistical tools to find out the dynamic on the market.
During the analysis stage, feedback from the stakeholder groups would be compared to determine areas of agreement as well as areas of divergence