

Key Insights
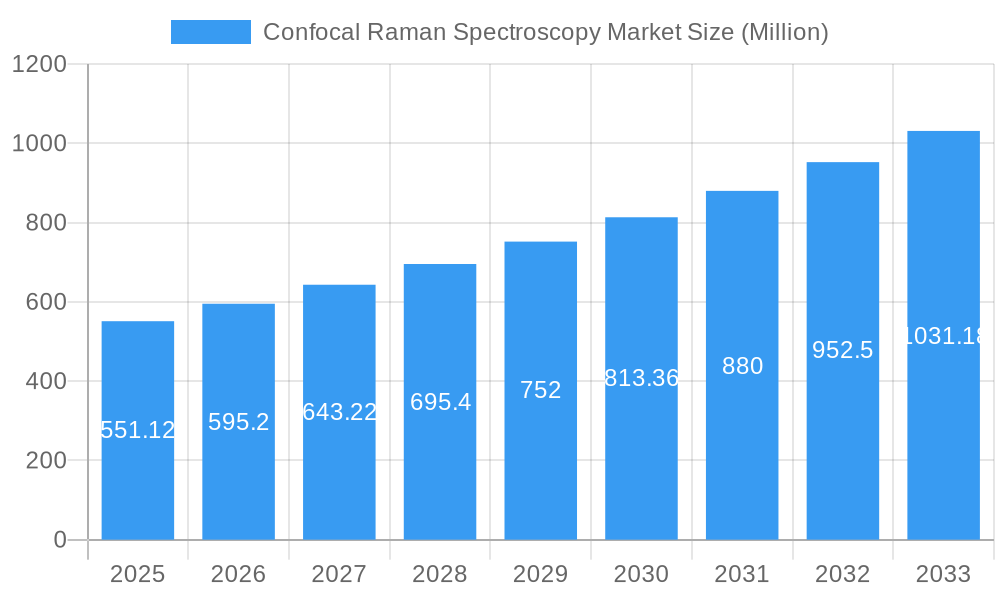
The Confocal Raman Spectroscopy market is experiencing robust growth, with a market size of $551.12 million in 2025 and a projected Compound Annual Growth Rate (CAGR) of 8% from 2025 to 2033. This expansion is driven by several key factors. The increasing demand for advanced analytical techniques across diverse sectors, including pharmaceuticals, materials science, and life sciences, is a primary driver. Confocal Raman spectroscopy's unique capabilities in non-destructive chemical imaging and its suitability for analyzing a wide range of samples, from biological tissues to complex materials, contribute significantly to its adoption. Furthermore, ongoing technological advancements leading to enhanced sensitivity, resolution, and automation are fueling market growth. The development of portable and user-friendly systems is also broadening the market's accessibility and expanding its applications in various settings, including field-based analyses and point-of-care diagnostics.
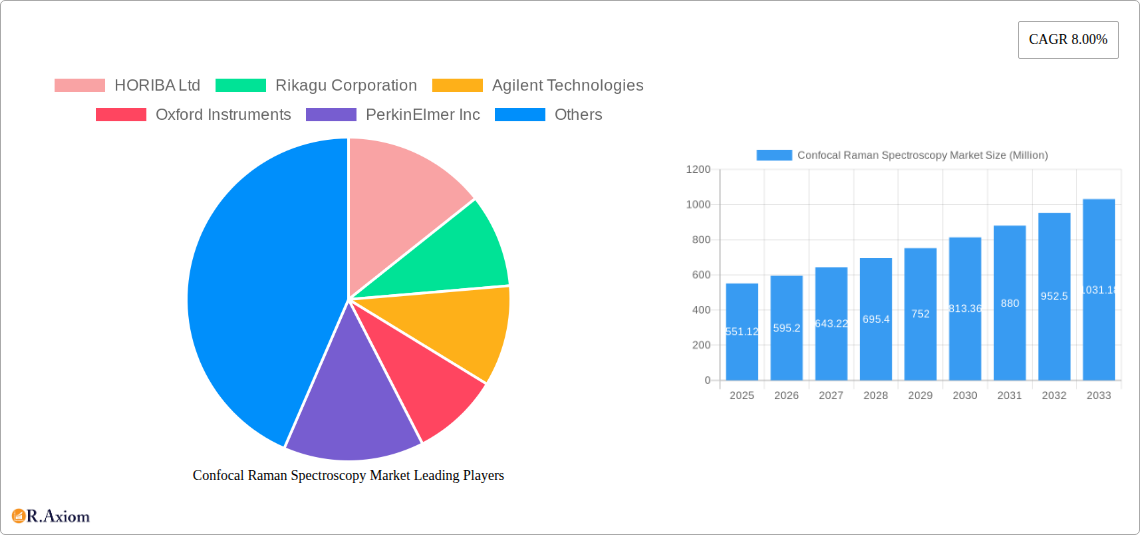
Confocal Raman Spectroscopy Market Market Size (In Million)
The market's competitive landscape is characterized by a mix of established players and emerging companies. Major players like HORIBA, Renishaw, and Thermo Fisher Scientific are driving innovation and expanding their product portfolios to cater to evolving market needs. The presence of several smaller companies indicates a dynamic competitive environment with opportunities for innovation and market penetration. While the market faces potential restraints such as high instrument costs and the need for specialized expertise, the overall growth trajectory remains positive due to the increasing demand for sophisticated analytical tools and the consistent development of more accessible and affordable technologies. The regional distribution of the market likely shows a strong concentration in developed economies initially, with North America and Europe commanding significant market shares. However, the adoption of confocal Raman spectroscopy is expected to increase in emerging markets as research and development funding increases and economies develop.
Confocal Raman Spectroscopy Market Company Market Share
Confocal Raman Spectroscopy Market: A Comprehensive Report (2019-2033)
This comprehensive report provides an in-depth analysis of the Confocal Raman Spectroscopy market, offering invaluable insights for stakeholders, investors, and industry professionals. Covering the period from 2019 to 2033, with a focus on 2025, this report meticulously examines market trends, competitive dynamics, technological advancements, and future growth prospects. The report leverages extensive data analysis and expert insights to deliver actionable strategies for navigating this dynamic market. The market is valued at xx Million in 2025 and is projected to reach xx Million by 2033, exhibiting a CAGR of xx% during the forecast period (2025-2033).
Confocal Raman Spectroscopy Market Concentration & Innovation
The Confocal Raman Spectroscopy market exhibits a moderately concentrated landscape, with key players holding significant market share. While exact figures are proprietary to the full report, HORIBA Ltd, Rikagu Corporation, Agilent Technologies, Oxford Instruments, PerkinElmer Inc, Renishaw PLC, Bruker Corporation, Thermo Fisher Scientific Inc, Mettler Toledo, and Hamamatsu Photonics KK are among the leading companies. The market share distribution amongst these companies is dynamic, influenced by factors such as innovation, M&A activity, and regulatory changes.
- Market Concentration: The Herfindahl-Hirschman Index (HHI) is estimated to be xx, indicating a moderately concentrated market.
- Innovation Drivers: Continuous advancements in laser technology, detector sensitivity, and data analysis software drive market innovation. Miniaturization and integration with other analytical techniques are key trends.
- Regulatory Frameworks: Stringent regulatory approvals for medical and pharmaceutical applications influence market growth.
- Product Substitutes: Other spectroscopic techniques like FTIR and NMR pose some competitive pressure, though Confocal Raman Spectroscopy offers unique advantages in specific applications.
- End-User Trends: Growing demand from research institutions, pharmaceutical companies, and materials science industries drives market expansion.
- M&A Activities: The recent acquisition of Nanophoton Corporation by Bruker Corporation (February 2024) highlights the strategic importance of consolidating market share and expanding technological capabilities. The deal value was xx Million. Further M&A activity is anticipated to shape the competitive landscape.
Confocal Raman Spectroscopy Market Industry Trends & Insights
The Confocal Raman Spectroscopy market is experiencing significant growth, propelled by several key factors. The increasing demand for non-destructive material characterization across diverse applications, coupled with continuous technological advancements, is fueling market expansion. The market is witnessing a substantial shift towards higher resolution, faster scanning, and improved data analysis capabilities. Consumer preferences are trending toward user-friendly, automated systems with comprehensive software packages.
- Market Growth Drivers: The rising demand for advanced material characterization in various sectors like pharmaceuticals, semiconductors, and life sciences is a significant driver. Growing research activities and the need for high-throughput analysis also contribute to market growth.
- Technological Disruptions: The development of novel laser sources, improved detectors, and advanced data processing algorithms are transforming the capabilities and accessibility of Confocal Raman Spectroscopy.
- Consumer Preferences: Ease of use, high sensitivity, and rapid data acquisition are key preferences driving market demand. Integrated software solutions for data analysis and visualization are becoming increasingly important.
- Competitive Dynamics: Intense competition among established players necessitates continuous innovation, strategic partnerships, and expansion into emerging markets.
Dominant Markets & Segments in Confocal Raman Spectroscopy Market
The North American market currently holds a dominant position in the Confocal Raman Spectroscopy market, driven by substantial research funding, a strong presence of key industry players, and robust technological infrastructure. However, the Asia-Pacific region exhibits significant growth potential due to increasing industrialization and rising investments in research and development.
- Key Drivers for North America: Strong research funding, presence of major players, established regulatory frameworks.
- Key Drivers for Asia-Pacific: Rapid industrialization, expanding research infrastructure, growing demand from emerging economies.
- Dominance Analysis: While North America retains the largest market share in terms of revenue, the Asia-Pacific region is experiencing faster growth, potentially surpassing North America in the long term. Europe and other regions contribute to global market expansion.
Confocal Raman Spectroscopy Market Product Developments
Recent product developments highlight a trend towards miniaturization, increased sensitivity, and improved ease of use. Manufacturers are integrating advanced technologies like automated sample handling and sophisticated data analysis software to enhance the capabilities of Confocal Raman Spectroscopy systems. These innovations are expanding the applications of this technique to a broader range of industries and research areas. The integration of FTIR and Raman spectroscopy into a single platform (Shimadzu AIRsight) showcases a significant advancement, streamlining workflow and data correlation.
Report Scope & Segmentation Analysis
This comprehensive report delves into the Confocal Raman Spectroscopy market, providing an in-depth analysis segmented across key parameters to offer a nuanced understanding of its landscape.
-
By Type: The market is meticulously segmented into handheld, benchtop, and integrated systems. Each category exhibits distinct growth trajectories, market valuations, and adoption rates, heavily influenced by application-specific demands, cost-effectiveness, and user-friendliness. The competitive strategies and market positioning also vary significantly among these system types.
-
By Application: This segment highlights the diverse and expanding utility of Confocal Raman Spectroscopy across critical fields including life sciences, materials science, pharmaceutical research and development, quality control, and environmental monitoring. Each application area is characterized by unique market dynamics, driven by evolving research needs, regulatory landscapes, and the inherent advantages of Raman spectroscopy in probing molecular structures and chemical compositions.
-
By End-User: The market is further segmented based on the primary consumers, encompassing academic and government research institutions, leading pharmaceutical and biotechnology companies, diverse manufacturing industries (including semiconductors, polymers, and food), and specialized forensic and industrial laboratories. The size and growth of these segments are directly correlated with their investment capacity, research intensity, and the specific analytical challenges they aim to address.
Key Drivers of Confocal Raman Spectroscopy Market Growth
Several factors contribute to the growth of the Confocal Raman Spectroscopy market:
- Technological advancements: Continuous improvements in laser technology, detectors, and data analysis software enhance the capabilities and applications of Confocal Raman Spectroscopy.
- Increased demand for non-destructive testing: The ability of this technique to provide detailed chemical information without damaging the sample is driving its adoption across various industries.
- Growing research and development: Increased funding in research and development across diverse scientific fields is fueling the demand for advanced analytical tools.
Challenges in the Confocal Raman Spectroscopy Market Sector
While the Confocal Raman Spectroscopy market demonstrates robust growth potential, several key challenges warrant attention:
- High Initial Investment and Operational Costs: The sophisticated technology and precision engineering involved in advanced Confocal Raman Spectroscopy systems translate to significant upfront capital expenditure. Furthermore, ongoing operational expenses, including maintenance, consumables, and specialized software, can pose a barrier to widespread adoption, particularly for smaller research groups or organizations with limited budgets.
- Requirement for Specialized Technical Expertise: The effective operation and interpretation of data from Confocal Raman Spectroscopy systems demand a high level of technical proficiency and a deep understanding of spectroscopic principles. This necessitates ongoing training for personnel, which can be a resource-intensive undertaking for many institutions and companies.
- Intense Competitive Landscape and Rapid Technological Advancements: The market is characterized by a dynamic and competitive environment where established players and emerging innovators are continuously striving to introduce enhanced functionalities, improved resolution, and novel applications. This pace of innovation requires companies to invest heavily in R&D to maintain market share and stay ahead of the curve, while users must adapt to evolving technological standards.
- Sample Preparation Complexity for Certain Applications: While Raman spectroscopy is generally non-destructive, certain complex samples or specific analytical requirements may necessitate intricate or time-consuming sample preparation procedures, which can impact workflow efficiency and throughput.
Emerging Opportunities in Confocal Raman Spectroscopy Market
The Confocal Raman Spectroscopy market presents significant opportunities:
- Expansion into new applications: Emerging applications in areas such as forensic science, art conservation, and food safety are driving market growth.
- Development of portable and handheld devices: Miniaturization is enabling the development of more portable and user-friendly systems, increasing market accessibility.
- Integration with other analytical techniques: Combining Confocal Raman Spectroscopy with other analytical methods, like FTIR, creates synergies leading to advanced analytical capabilities.
Leading Players in the Confocal Raman Spectroscopy Market Market
Key Developments in Confocal Raman Spectroscopy Market Industry
- June 2024: Shimadzu Scientific Instruments unveiled its groundbreaking AIRsight Infrared/Raman Microscope, a synergistic platform that seamlessly integrates both FTIR and Raman spectroscopy. This dual-mode capability significantly enhances molecular analysis, offering researchers the ability to obtain complementary spectroscopic data from a single measurement, thus streamlining sample examination and improving the correlation between different analytical techniques.
- February 2024: Bruker Corporation strategically announced the acquisition of Nanophoton Corporation, a move that substantially bolsters Bruker's comprehensive molecular microscopy portfolio. This acquisition not only expands Bruker's technological offerings but also enhances its global market presence, particularly within the high-growth sectors of life sciences, biopharmaceuticals, and advanced materials research.
- Q4 2023: Thermo Fisher Scientific introduced a new generation of high-performance confocal Raman microscopes featuring advanced automation and AI-driven data analysis software. These enhancements aim to improve user accessibility, accelerate research workflows, and enable more complex spectral analysis for a wider range of scientific applications.
Strategic Outlook for Confocal Raman Spectroscopy Market Market
The Confocal Raman Spectroscopy market is poised for sustained growth driven by technological advancements, expanding applications across various industries, and increased research funding. Opportunities exist in miniaturization, integration with other techniques, and development of user-friendly software. Strategic partnerships and investments in research and development are crucial for companies seeking to maintain competitiveness in this dynamic market.
Confocal Raman Spectroscopy Market Segmentation
-
1. Type
- 1.1. Desktop
- 1.2. Portable
-
2. End User
- 2.1. Pharmaceuticals
- 2.2. R&D in Academia
- 2.3. Industrial Sectors
- 2.4. Others
Confocal Raman Spectroscopy Market Segmentation By Geography
- 1. North America
- 2. Europe
- 3. Asia
- 4. Australia and New Zealand
- 5. Latin America
- 6. Middle East and Africa

Confocal Raman Spectroscopy Market Regional Market Share
Geographic Coverage of Confocal Raman Spectroscopy Market
Confocal Raman Spectroscopy Market REPORT HIGHLIGHTS
| Aspects | Details |
|---|---|
| Study Period | 2020-2034 |
| Base Year | 2025 |
| Estimated Year | 2026 |
| Forecast Period | 2026-2034 |
| Historical Period | 2020-2025 |
| Growth Rate | CAGR of 8.00% from 2020-2034 |
| Segmentation |
|
Table of Contents
- 1. Introduction
- 1.1. Research Scope
- 1.2. Market Segmentation
- 1.3. Research Objective
- 1.4. Definitions and Assumptions
- 2. Executive Summary
- 2.1. Market Snapshot
- 3. Market Dynamics
- 3.1. Market Drivers
- 3.2. Market Restrains
- 3.3. Market Trends
- 3.4. Market Opportunities
- 4. Market Factor Analysis
- 4.1. Porters Five Forces
- 4.1.1. Bargaining Power of Suppliers
- 4.1.2. Bargaining Power of Buyers
- 4.1.3. Threat of New Entrants
- 4.1.4. Threat of Substitutes
- 4.1.5. Competitive Rivalry
- 4.2. PESTEL analysis
- 4.3. BCG Analysis
- 4.3.1. Stars (High Growth, High Market Share)
- 4.3.2. Cash Cows (Low Growth, High Market Share)
- 4.3.3. Question Mark (High Growth, Low Market Share)
- 4.3.4. Dogs (Low Growth, Low Market Share)
- 4.4. Ansoff Matrix Analysis
- 4.5. Supply Chain Analysis
- 4.6. Regulatory Landscape
- 4.7. Current Market Potential and Opportunity Assessment (TAM–SAM–SOM Framework)
- 4.8. RAX Analyst Note
- 4.1. Porters Five Forces
- 5. Market Analysis, Insights and Forecast 2021-2033
- 5.1. Market Analysis, Insights and Forecast - by Type
- 5.1.1. Desktop
- 5.1.2. Portable
- 5.2. Market Analysis, Insights and Forecast - by End User
- 5.2.1. Pharmaceuticals
- 5.2.2. R&D in Academia
- 5.2.3. Industrial Sectors
- 5.2.4. Others
- 5.3. Market Analysis, Insights and Forecast - by Region
- 5.3.1. North America
- 5.3.2. Europe
- 5.3.3. Asia
- 5.3.4. Australia and New Zealand
- 5.3.5. Latin America
- 5.3.6. Middle East and Africa
- 5.1. Market Analysis, Insights and Forecast - by Type
- 6. Global Confocal Raman Spectroscopy Market Analysis, Insights and Forecast, 2021-2033
- 6.1. Market Analysis, Insights and Forecast - by Type
- 6.1.1. Desktop
- 6.1.2. Portable
- 6.2. Market Analysis, Insights and Forecast - by End User
- 6.2.1. Pharmaceuticals
- 6.2.2. R&D in Academia
- 6.2.3. Industrial Sectors
- 6.2.4. Others
- 6.1. Market Analysis, Insights and Forecast - by Type
- 7. North America Confocal Raman Spectroscopy Market Analysis, Insights and Forecast, 2020-2032
- 7.1. Market Analysis, Insights and Forecast - by Type
- 7.1.1. Desktop
- 7.1.2. Portable
- 7.2. Market Analysis, Insights and Forecast - by End User
- 7.2.1. Pharmaceuticals
- 7.2.2. R&D in Academia
- 7.2.3. Industrial Sectors
- 7.2.4. Others
- 7.1. Market Analysis, Insights and Forecast - by Type
- 8. Europe Confocal Raman Spectroscopy Market Analysis, Insights and Forecast, 2020-2032
- 8.1. Market Analysis, Insights and Forecast - by Type
- 8.1.1. Desktop
- 8.1.2. Portable
- 8.2. Market Analysis, Insights and Forecast - by End User
- 8.2.1. Pharmaceuticals
- 8.2.2. R&D in Academia
- 8.2.3. Industrial Sectors
- 8.2.4. Others
- 8.1. Market Analysis, Insights and Forecast - by Type
- 9. Asia Confocal Raman Spectroscopy Market Analysis, Insights and Forecast, 2020-2032
- 9.1. Market Analysis, Insights and Forecast - by Type
- 9.1.1. Desktop
- 9.1.2. Portable
- 9.2. Market Analysis, Insights and Forecast - by End User
- 9.2.1. Pharmaceuticals
- 9.2.2. R&D in Academia
- 9.2.3. Industrial Sectors
- 9.2.4. Others
- 9.1. Market Analysis, Insights and Forecast - by Type
- 10. Australia and New Zealand Confocal Raman Spectroscopy Market Analysis, Insights and Forecast, 2020-2032
- 10.1. Market Analysis, Insights and Forecast - by Type
- 10.1.1. Desktop
- 10.1.2. Portable
- 10.2. Market Analysis, Insights and Forecast - by End User
- 10.2.1. Pharmaceuticals
- 10.2.2. R&D in Academia
- 10.2.3. Industrial Sectors
- 10.2.4. Others
- 10.1. Market Analysis, Insights and Forecast - by Type
- 11. Latin America Confocal Raman Spectroscopy Market Analysis, Insights and Forecast, 2020-2032
- 11.1. Market Analysis, Insights and Forecast - by Type
- 11.1.1. Desktop
- 11.1.2. Portable
- 11.2. Market Analysis, Insights and Forecast - by End User
- 11.2.1. Pharmaceuticals
- 11.2.2. R&D in Academia
- 11.2.3. Industrial Sectors
- 11.2.4. Others
- 11.1. Market Analysis, Insights and Forecast - by Type
- 12. Middle East and Africa Confocal Raman Spectroscopy Market Analysis, Insights and Forecast, 2020-2032
- 12.1. Market Analysis, Insights and Forecast - by Type
- 12.1.1. Desktop
- 12.1.2. Portable
- 12.2. Market Analysis, Insights and Forecast - by End User
- 12.2.1. Pharmaceuticals
- 12.2.2. R&D in Academia
- 12.2.3. Industrial Sectors
- 12.2.4. Others
- 12.1. Market Analysis, Insights and Forecast - by Type
- 13. Competitive Analysis
- 13.1. Company Profiles
- 13.1.1 HORIBA Ltd
- 13.1.1.1. Company Overview
- 13.1.1.2. Products
- 13.1.1.3. Company Financials
- 13.1.1.4. SWOT Analysis
- 13.1.2 Rikagu Corporation
- 13.1.2.1. Company Overview
- 13.1.2.2. Products
- 13.1.2.3. Company Financials
- 13.1.2.4. SWOT Analysis
- 13.1.3 Agilent Technologies
- 13.1.3.1. Company Overview
- 13.1.3.2. Products
- 13.1.3.3. Company Financials
- 13.1.3.4. SWOT Analysis
- 13.1.4 Oxford Instruments
- 13.1.4.1. Company Overview
- 13.1.4.2. Products
- 13.1.4.3. Company Financials
- 13.1.4.4. SWOT Analysis
- 13.1.5 PerkinElmer Inc
- 13.1.5.1. Company Overview
- 13.1.5.2. Products
- 13.1.5.3. Company Financials
- 13.1.5.4. SWOT Analysis
- 13.1.6 Renishaw PLC
- 13.1.6.1. Company Overview
- 13.1.6.2. Products
- 13.1.6.3. Company Financials
- 13.1.6.4. SWOT Analysis
- 13.1.7 Bruker Corporation
- 13.1.7.1. Company Overview
- 13.1.7.2. Products
- 13.1.7.3. Company Financials
- 13.1.7.4. SWOT Analysis
- 13.1.8 Thermo Fisher Scientific Inc
- 13.1.8.1. Company Overview
- 13.1.8.2. Products
- 13.1.8.3. Company Financials
- 13.1.8.4. SWOT Analysis
- 13.1.9 Mettler Toledo
- 13.1.9.1. Company Overview
- 13.1.9.2. Products
- 13.1.9.3. Company Financials
- 13.1.9.4. SWOT Analysis
- 13.1.10 Hamamatsu Photonics KK*List Not Exhaustive
- 13.1.10.1. Company Overview
- 13.1.10.2. Products
- 13.1.10.3. Company Financials
- 13.1.10.4. SWOT Analysis
- 13.1.1 HORIBA Ltd
- 13.2. Market Entropy
- 13.2.1 Company's Key Areas Served
- 13.2.2 Recent Developments
- 13.3. Company Market Share Analysis 2025
- 13.3.1 Top 5 Companies Market Share Analysis
- 13.3.2 Top 3 Companies Market Share Analysis
- 13.4. List of Potential Customers
- 14. Research Methodology
List of Figures
- Figure 1: Global Confocal Raman Spectroscopy Market Revenue Breakdown (Million, %) by Region 2025 & 2033
- Figure 2: Global Confocal Raman Spectroscopy Market Volume Breakdown (Million, %) by Region 2025 & 2033
- Figure 3: North America Confocal Raman Spectroscopy Market Revenue (Million), by Type 2025 & 2033
- Figure 4: North America Confocal Raman Spectroscopy Market Volume (Million), by Type 2025 & 2033
- Figure 5: North America Confocal Raman Spectroscopy Market Revenue Share (%), by Type 2025 & 2033
- Figure 6: North America Confocal Raman Spectroscopy Market Volume Share (%), by Type 2025 & 2033
- Figure 7: North America Confocal Raman Spectroscopy Market Revenue (Million), by End User 2025 & 2033
- Figure 8: North America Confocal Raman Spectroscopy Market Volume (Million), by End User 2025 & 2033
- Figure 9: North America Confocal Raman Spectroscopy Market Revenue Share (%), by End User 2025 & 2033
- Figure 10: North America Confocal Raman Spectroscopy Market Volume Share (%), by End User 2025 & 2033
- Figure 11: North America Confocal Raman Spectroscopy Market Revenue (Million), by Country 2025 & 2033
- Figure 12: North America Confocal Raman Spectroscopy Market Volume (Million), by Country 2025 & 2033
- Figure 13: North America Confocal Raman Spectroscopy Market Revenue Share (%), by Country 2025 & 2033
- Figure 14: North America Confocal Raman Spectroscopy Market Volume Share (%), by Country 2025 & 2033
- Figure 15: Europe Confocal Raman Spectroscopy Market Revenue (Million), by Type 2025 & 2033
- Figure 16: Europe Confocal Raman Spectroscopy Market Volume (Million), by Type 2025 & 2033
- Figure 17: Europe Confocal Raman Spectroscopy Market Revenue Share (%), by Type 2025 & 2033
- Figure 18: Europe Confocal Raman Spectroscopy Market Volume Share (%), by Type 2025 & 2033
- Figure 19: Europe Confocal Raman Spectroscopy Market Revenue (Million), by End User 2025 & 2033
- Figure 20: Europe Confocal Raman Spectroscopy Market Volume (Million), by End User 2025 & 2033
- Figure 21: Europe Confocal Raman Spectroscopy Market Revenue Share (%), by End User 2025 & 2033
- Figure 22: Europe Confocal Raman Spectroscopy Market Volume Share (%), by End User 2025 & 2033
- Figure 23: Europe Confocal Raman Spectroscopy Market Revenue (Million), by Country 2025 & 2033
- Figure 24: Europe Confocal Raman Spectroscopy Market Volume (Million), by Country 2025 & 2033
- Figure 25: Europe Confocal Raman Spectroscopy Market Revenue Share (%), by Country 2025 & 2033
- Figure 26: Europe Confocal Raman Spectroscopy Market Volume Share (%), by Country 2025 & 2033
- Figure 27: Asia Confocal Raman Spectroscopy Market Revenue (Million), by Type 2025 & 2033
- Figure 28: Asia Confocal Raman Spectroscopy Market Volume (Million), by Type 2025 & 2033
- Figure 29: Asia Confocal Raman Spectroscopy Market Revenue Share (%), by Type 2025 & 2033
- Figure 30: Asia Confocal Raman Spectroscopy Market Volume Share (%), by Type 2025 & 2033
- Figure 31: Asia Confocal Raman Spectroscopy Market Revenue (Million), by End User 2025 & 2033
- Figure 32: Asia Confocal Raman Spectroscopy Market Volume (Million), by End User 2025 & 2033
- Figure 33: Asia Confocal Raman Spectroscopy Market Revenue Share (%), by End User 2025 & 2033
- Figure 34: Asia Confocal Raman Spectroscopy Market Volume Share (%), by End User 2025 & 2033
- Figure 35: Asia Confocal Raman Spectroscopy Market Revenue (Million), by Country 2025 & 2033
- Figure 36: Asia Confocal Raman Spectroscopy Market Volume (Million), by Country 2025 & 2033
- Figure 37: Asia Confocal Raman Spectroscopy Market Revenue Share (%), by Country 2025 & 2033
- Figure 38: Asia Confocal Raman Spectroscopy Market Volume Share (%), by Country 2025 & 2033
- Figure 39: Australia and New Zealand Confocal Raman Spectroscopy Market Revenue (Million), by Type 2025 & 2033
- Figure 40: Australia and New Zealand Confocal Raman Spectroscopy Market Volume (Million), by Type 2025 & 2033
- Figure 41: Australia and New Zealand Confocal Raman Spectroscopy Market Revenue Share (%), by Type 2025 & 2033
- Figure 42: Australia and New Zealand Confocal Raman Spectroscopy Market Volume Share (%), by Type 2025 & 2033
- Figure 43: Australia and New Zealand Confocal Raman Spectroscopy Market Revenue (Million), by End User 2025 & 2033
- Figure 44: Australia and New Zealand Confocal Raman Spectroscopy Market Volume (Million), by End User 2025 & 2033
- Figure 45: Australia and New Zealand Confocal Raman Spectroscopy Market Revenue Share (%), by End User 2025 & 2033
- Figure 46: Australia and New Zealand Confocal Raman Spectroscopy Market Volume Share (%), by End User 2025 & 2033
- Figure 47: Australia and New Zealand Confocal Raman Spectroscopy Market Revenue (Million), by Country 2025 & 2033
- Figure 48: Australia and New Zealand Confocal Raman Spectroscopy Market Volume (Million), by Country 2025 & 2033
- Figure 49: Australia and New Zealand Confocal Raman Spectroscopy Market Revenue Share (%), by Country 2025 & 2033
- Figure 50: Australia and New Zealand Confocal Raman Spectroscopy Market Volume Share (%), by Country 2025 & 2033
- Figure 51: Latin America Confocal Raman Spectroscopy Market Revenue (Million), by Type 2025 & 2033
- Figure 52: Latin America Confocal Raman Spectroscopy Market Volume (Million), by Type 2025 & 2033
- Figure 53: Latin America Confocal Raman Spectroscopy Market Revenue Share (%), by Type 2025 & 2033
- Figure 54: Latin America Confocal Raman Spectroscopy Market Volume Share (%), by Type 2025 & 2033
- Figure 55: Latin America Confocal Raman Spectroscopy Market Revenue (Million), by End User 2025 & 2033
- Figure 56: Latin America Confocal Raman Spectroscopy Market Volume (Million), by End User 2025 & 2033
- Figure 57: Latin America Confocal Raman Spectroscopy Market Revenue Share (%), by End User 2025 & 2033
- Figure 58: Latin America Confocal Raman Spectroscopy Market Volume Share (%), by End User 2025 & 2033
- Figure 59: Latin America Confocal Raman Spectroscopy Market Revenue (Million), by Country 2025 & 2033
- Figure 60: Latin America Confocal Raman Spectroscopy Market Volume (Million), by Country 2025 & 2033
- Figure 61: Latin America Confocal Raman Spectroscopy Market Revenue Share (%), by Country 2025 & 2033
- Figure 62: Latin America Confocal Raman Spectroscopy Market Volume Share (%), by Country 2025 & 2033
- Figure 63: Middle East and Africa Confocal Raman Spectroscopy Market Revenue (Million), by Type 2025 & 2033
- Figure 64: Middle East and Africa Confocal Raman Spectroscopy Market Volume (Million), by Type 2025 & 2033
- Figure 65: Middle East and Africa Confocal Raman Spectroscopy Market Revenue Share (%), by Type 2025 & 2033
- Figure 66: Middle East and Africa Confocal Raman Spectroscopy Market Volume Share (%), by Type 2025 & 2033
- Figure 67: Middle East and Africa Confocal Raman Spectroscopy Market Revenue (Million), by End User 2025 & 2033
- Figure 68: Middle East and Africa Confocal Raman Spectroscopy Market Volume (Million), by End User 2025 & 2033
- Figure 69: Middle East and Africa Confocal Raman Spectroscopy Market Revenue Share (%), by End User 2025 & 2033
- Figure 70: Middle East and Africa Confocal Raman Spectroscopy Market Volume Share (%), by End User 2025 & 2033
- Figure 71: Middle East and Africa Confocal Raman Spectroscopy Market Revenue (Million), by Country 2025 & 2033
- Figure 72: Middle East and Africa Confocal Raman Spectroscopy Market Volume (Million), by Country 2025 & 2033
- Figure 73: Middle East and Africa Confocal Raman Spectroscopy Market Revenue Share (%), by Country 2025 & 2033
- Figure 74: Middle East and Africa Confocal Raman Spectroscopy Market Volume Share (%), by Country 2025 & 2033
List of Tables
- Table 1: Global Confocal Raman Spectroscopy Market Revenue Million Forecast, by Type 2020 & 2033
- Table 2: Global Confocal Raman Spectroscopy Market Volume Million Forecast, by Type 2020 & 2033
- Table 3: Global Confocal Raman Spectroscopy Market Revenue Million Forecast, by End User 2020 & 2033
- Table 4: Global Confocal Raman Spectroscopy Market Volume Million Forecast, by End User 2020 & 2033
- Table 5: Global Confocal Raman Spectroscopy Market Revenue Million Forecast, by Region 2020 & 2033
- Table 6: Global Confocal Raman Spectroscopy Market Volume Million Forecast, by Region 2020 & 2033
- Table 7: Global Confocal Raman Spectroscopy Market Revenue Million Forecast, by Type 2020 & 2033
- Table 8: Global Confocal Raman Spectroscopy Market Volume Million Forecast, by Type 2020 & 2033
- Table 9: Global Confocal Raman Spectroscopy Market Revenue Million Forecast, by End User 2020 & 2033
- Table 10: Global Confocal Raman Spectroscopy Market Volume Million Forecast, by End User 2020 & 2033
- Table 11: Global Confocal Raman Spectroscopy Market Revenue Million Forecast, by Country 2020 & 2033
- Table 12: Global Confocal Raman Spectroscopy Market Volume Million Forecast, by Country 2020 & 2033
- Table 13: Global Confocal Raman Spectroscopy Market Revenue Million Forecast, by Type 2020 & 2033
- Table 14: Global Confocal Raman Spectroscopy Market Volume Million Forecast, by Type 2020 & 2033
- Table 15: Global Confocal Raman Spectroscopy Market Revenue Million Forecast, by End User 2020 & 2033
- Table 16: Global Confocal Raman Spectroscopy Market Volume Million Forecast, by End User 2020 & 2033
- Table 17: Global Confocal Raman Spectroscopy Market Revenue Million Forecast, by Country 2020 & 2033
- Table 18: Global Confocal Raman Spectroscopy Market Volume Million Forecast, by Country 2020 & 2033
- Table 19: Global Confocal Raman Spectroscopy Market Revenue Million Forecast, by Type 2020 & 2033
- Table 20: Global Confocal Raman Spectroscopy Market Volume Million Forecast, by Type 2020 & 2033
- Table 21: Global Confocal Raman Spectroscopy Market Revenue Million Forecast, by End User 2020 & 2033
- Table 22: Global Confocal Raman Spectroscopy Market Volume Million Forecast, by End User 2020 & 2033
- Table 23: Global Confocal Raman Spectroscopy Market Revenue Million Forecast, by Country 2020 & 2033
- Table 24: Global Confocal Raman Spectroscopy Market Volume Million Forecast, by Country 2020 & 2033
- Table 25: Global Confocal Raman Spectroscopy Market Revenue Million Forecast, by Type 2020 & 2033
- Table 26: Global Confocal Raman Spectroscopy Market Volume Million Forecast, by Type 2020 & 2033
- Table 27: Global Confocal Raman Spectroscopy Market Revenue Million Forecast, by End User 2020 & 2033
- Table 28: Global Confocal Raman Spectroscopy Market Volume Million Forecast, by End User 2020 & 2033
- Table 29: Global Confocal Raman Spectroscopy Market Revenue Million Forecast, by Country 2020 & 2033
- Table 30: Global Confocal Raman Spectroscopy Market Volume Million Forecast, by Country 2020 & 2033
- Table 31: Global Confocal Raman Spectroscopy Market Revenue Million Forecast, by Type 2020 & 2033
- Table 32: Global Confocal Raman Spectroscopy Market Volume Million Forecast, by Type 2020 & 2033
- Table 33: Global Confocal Raman Spectroscopy Market Revenue Million Forecast, by End User 2020 & 2033
- Table 34: Global Confocal Raman Spectroscopy Market Volume Million Forecast, by End User 2020 & 2033
- Table 35: Global Confocal Raman Spectroscopy Market Revenue Million Forecast, by Country 2020 & 2033
- Table 36: Global Confocal Raman Spectroscopy Market Volume Million Forecast, by Country 2020 & 2033
- Table 37: Global Confocal Raman Spectroscopy Market Revenue Million Forecast, by Type 2020 & 2033
- Table 38: Global Confocal Raman Spectroscopy Market Volume Million Forecast, by Type 2020 & 2033
- Table 39: Global Confocal Raman Spectroscopy Market Revenue Million Forecast, by End User 2020 & 2033
- Table 40: Global Confocal Raman Spectroscopy Market Volume Million Forecast, by End User 2020 & 2033
- Table 41: Global Confocal Raman Spectroscopy Market Revenue Million Forecast, by Country 2020 & 2033
- Table 42: Global Confocal Raman Spectroscopy Market Volume Million Forecast, by Country 2020 & 2033
Frequently Asked Questions
1. What is the projected Compound Annual Growth Rate (CAGR) of the Confocal Raman Spectroscopy Market?
The projected CAGR is approximately 8.00%.
2. Which companies are prominent players in the Confocal Raman Spectroscopy Market?
Key companies in the market include HORIBA Ltd, Rikagu Corporation, Agilent Technologies, Oxford Instruments, PerkinElmer Inc, Renishaw PLC, Bruker Corporation, Thermo Fisher Scientific Inc, Mettler Toledo, Hamamatsu Photonics KK*List Not Exhaustive.
3. What are the main segments of the Confocal Raman Spectroscopy Market?
The market segments include Type, End User.
4. Can you provide details about the market size?
The market size is estimated to be USD 551.12 Million as of 2022.
5. What are some drivers contributing to market growth?
Rising Investment Towards Drug Development; Growing Application in Forensic Science. Food Safety. and Gemology.
6. What are the notable trends driving market growth?
The Portable Segment is Driving Popularity.
7. Are there any restraints impacting market growth?
Rising Investment Towards Drug Development; Growing Application in Forensic Science. Food Safety. and Gemology.
8. Can you provide examples of recent developments in the market?
June 2024: The Shimadzu AIRsight Infrared/Raman Microscope revolutionized molecular analysis. By merging Fourier transform infrared (FTIR) and Raman spectroscopy into a single instrument, it equips researchers with a robust tool for in-depth sample examination. This innovation allows for the simultaneous acquisition of both spectra from a stationary sample, streamlining the process and enhancing the accuracy of technique correlation.February 2024: Brukar Corporation acquired Nanophoton Corporation, which is based in Osaka and boasts a diverse range of cutting-edge Raman microscopes, catering to both academic and industrial research, predominantly in Japan. This strategic move enhanced Bruker's molecular microscopy offerings. The company aims to promote Nanophoton's rapid, adaptable, and sensitive Raman systems globally across various fields, including life sciences, biopharma, advanced materials, semiconductors, and polymers.
9. What pricing options are available for accessing the report?
Pricing options include single-user, multi-user, and enterprise licenses priced at USD 4750, USD 5250, and USD 8750 respectively.
10. Is the market size provided in terms of value or volume?
The market size is provided in terms of value, measured in Million and volume, measured in Million.
11. Are there any specific market keywords associated with the report?
Yes, the market keyword associated with the report is "Confocal Raman Spectroscopy Market," which aids in identifying and referencing the specific market segment covered.
12. How do I determine which pricing option suits my needs best?
The pricing options vary based on user requirements and access needs. Individual users may opt for single-user licenses, while businesses requiring broader access may choose multi-user or enterprise licenses for cost-effective access to the report.
13. Are there any additional resources or data provided in the Confocal Raman Spectroscopy Market report?
While the report offers comprehensive insights, it's advisable to review the specific contents or supplementary materials provided to ascertain if additional resources or data are available.
14. How can I stay updated on further developments or reports in the Confocal Raman Spectroscopy Market?
To stay informed about further developments, trends, and reports in the Confocal Raman Spectroscopy Market, consider subscribing to industry newsletters, following relevant companies and organizations, or regularly checking reputable industry news sources and publications.
Methodology
Step 1 - Identification of Relevant Samples Size from Population Database


Step 2 - Approaches for Defining Global Market Size (Value, Volume* & Price*)

Note*: In applicable scenarios
Step 3 - Data Sources
Primary Research
- Web Analytics
- Survey Reports
- Research Institute
- Latest Research Reports
- Opinion Leaders
Secondary Research
- Annual Reports
- White Paper
- Latest Press Release
- Industry Association
- Paid Database
- Investor Presentations

Step 4 - Data Triangulation
Involves using different sources of information in order to increase the validity of a study
These sources are likely to be stakeholders in a program - participants, other researchers, program staff, other community members, and so on.
Then we put all data in single framework & apply various statistical tools to find out the dynamic on the market.
During the analysis stage, feedback from the stakeholder groups would be compared to determine areas of agreement as well as areas of divergence