


Key Insights
The Connected Drug Delivery Devices market is experiencing robust growth, projected to reach a substantial size driven by technological advancements and a rising demand for improved patient care. The market's Compound Annual Growth Rate (CAGR) of 35.13% from 2019 to 2024 indicates a significant upward trajectory, expected to continue throughout the forecast period (2025-2033). Key drivers include the increasing prevalence of chronic diseases necessitating regular medication adherence, the growing adoption of telehealth and remote patient monitoring, and the development of sophisticated connected sensors and injection devices. The integration of Bluetooth and Near-field Communication (NFC) technologies enables real-time data tracking, enhancing patient compliance and providing valuable insights for healthcare providers. Market segmentation reveals strong growth in connected sensors, connectable injection sensors, and integrated connected devices across healthcare providers and homecare settings. Major players like West Pharmaceutical Services Inc., Adherium Limited, and Ypsomed AG are actively shaping the market landscape through innovation and strategic partnerships. Geographic analysis indicates strong growth across North America and Europe, fueled by advanced healthcare infrastructure and regulatory support, with the Asia Pacific region demonstrating high growth potential due to increasing healthcare expenditure and rising adoption of connected health solutions. The market is poised for continued expansion, driven by further technological advancements, increasing government initiatives focused on improving patient outcomes, and an expanding elderly population requiring more effective medication management systems.
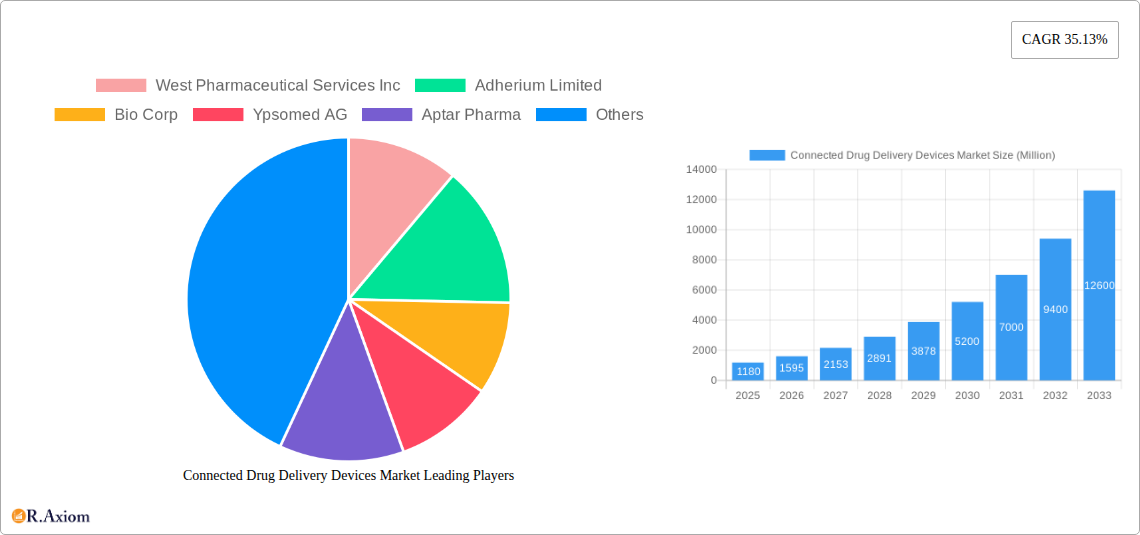
Connected Drug Delivery Devices Market Market Size (In Billion)

The market's substantial growth is anticipated to persist through 2033, fueled by factors like the increasing integration of AI and machine learning for personalized medicine, expansion into emerging markets, and the continuous development of user-friendly and highly effective connected drug delivery systems. Furthermore, the rising demand for improved medication adherence among patients with chronic conditions, coupled with the rising popularity of remote patient monitoring programs and the integration of data analytics for more effective treatment strategies, will further propel market expansion. Competition among key players is expected to intensify, with companies focusing on product innovation, strategic acquisitions, and partnerships to maintain a competitive edge. Regulatory approvals and pricing strategies will also play significant roles in shaping the market's future trajectory. However, potential challenges such as data privacy concerns, cybersecurity threats, and the high cost of connected devices could act as potential restraints on the market's growth.

Connected Drug Delivery Devices Market Company Market Share
Connected Drug Delivery Devices Market: A Comprehensive Report (2019-2033)
This comprehensive report provides an in-depth analysis of the Connected Drug Delivery Devices market, covering market size, growth drivers, challenges, opportunities, and key players. The study period spans from 2019 to 2033, with 2025 as the base and estimated year. The report offers actionable insights for stakeholders across the pharmaceutical, medical device, and healthcare technology sectors. The market is segmented by technology (Bluetooth, Near-field communication (NFC), Other Technologies), end-user (Healthcare Providers, Homecare), and product (Connected Sensors, Connectable Injection Sensors, Integrated Connected Devices). Key players profiled include West Pharmaceutical Services Inc, Adherium Limited, Bio Corp, Ypsomed AG, Aptar Pharma, Findair Sp z o o, Phillips-Medisize, Teva Pharmaceuticals Industries Ltd, and Propeller Health (ResMed Inc).
Connected Drug Delivery Devices Market Concentration & Innovation
The Connected Drug Delivery Devices market exhibits a moderately concentrated landscape, with a few large players holding significant market share. However, the market is also witnessing considerable innovation, driven by the convergence of digital health and pharmaceutical technologies. Market share data for 2024 indicates that the top five players collectively hold approximately xx% of the market. The average M&A deal value in the last five years has been approximately xx Million, reflecting significant interest from both established players and emerging startups. Regulatory frameworks, while promoting innovation, also present challenges in terms of compliance and market entry. The development of alternative drug delivery technologies such as implantable devices and microneedle patches presents potential substitutes for connected devices. End-user trends indicate a growing preference for remote patient monitoring and personalized medicine, boosting demand for connected devices. Furthermore, strategic partnerships and mergers and acquisitions (M&A) are increasingly common, with xx major M&A deals concluded in the last three years.
- Market Concentration: Moderately concentrated, top 5 players hold xx% market share (2024).
- Innovation Drivers: Digital health convergence, personalized medicine, remote patient monitoring.
- Regulatory Frameworks: Balancing innovation with compliance presents challenges.
- Product Substitutes: Implantable devices, microneedle patches.
- End-User Trends: Growing preference for remote monitoring and personalized medicine.
- M&A Activity: High activity in the past three years, average deal value xx Million.
Connected Drug Delivery Devices Market Industry Trends & Insights
The Connected Drug Delivery Devices market is experiencing robust growth, driven by factors such as the increasing prevalence of chronic diseases, rising demand for remote patient monitoring, advancements in sensor technology, and growing adoption of telehealth. The market is projected to exhibit a CAGR of xx% during the forecast period (2025-2033), reaching a market size of xx Million by 2033. Technological disruptions, particularly in areas like artificial intelligence (AI) and machine learning (ML), are further enhancing the capabilities of connected drug delivery devices, improving patient adherence, and enabling real-time data analysis. Consumer preferences are shifting towards convenient, user-friendly, and data-driven healthcare solutions, creating a fertile ground for market expansion. Competitive dynamics are characterized by innovation, strategic partnerships, and M&A activity. Market penetration of connected devices in the overall drug delivery market is currently estimated at xx%, projected to increase to xx% by 2033.
Dominant Markets & Segments in Connected Drug Delivery Devices Market
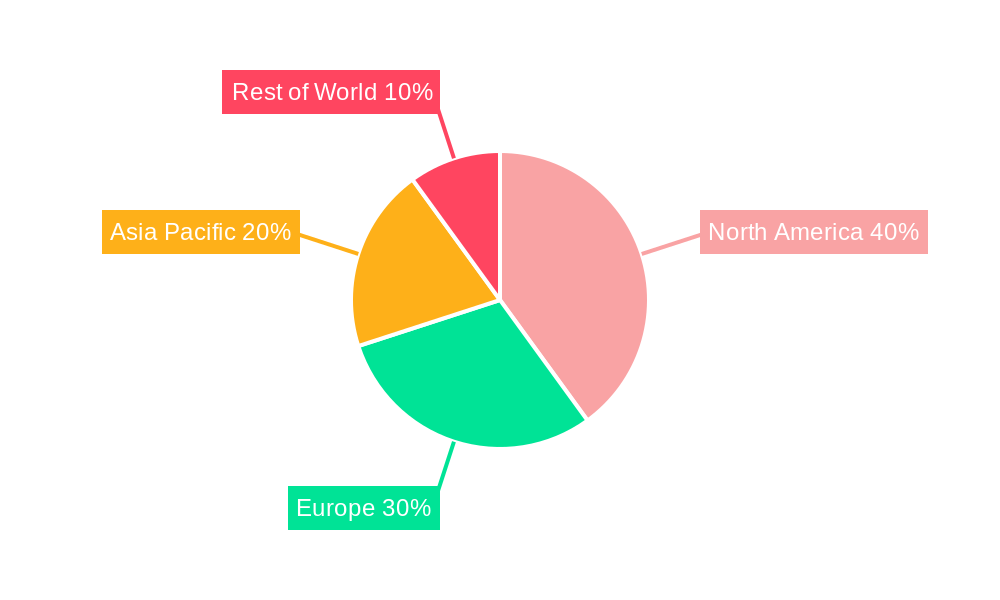
The North American region currently dominates the Connected Drug Delivery Devices market, driven by factors such as well-established healthcare infrastructure, high adoption of digital health technologies, and a favorable regulatory environment. However, the Asia-Pacific region is expected to witness substantial growth in the coming years, fueled by rising healthcare expenditure and increasing prevalence of chronic diseases.
By Technology: Bluetooth technology currently holds the largest market share due to its wide compatibility and affordability. However, NFC technology is gaining traction due to its enhanced security features and improved data transfer capabilities.
By End-User: Healthcare providers are the largest segment, followed by the homecare sector. The homecare segment is showing promising growth driven by the increasing preference for in-home healthcare and remote monitoring.
By Product: Connected sensors and connectable injection sensors are currently the major products in the market. Integrated connected devices are a rapidly growing segment, reflecting the ongoing trend toward more sophisticated and integrated solutions.
Key Drivers (North America): Advanced healthcare infrastructure, high digital health adoption, favorable regulatory environment.
Key Drivers (Asia-Pacific): Rising healthcare expenditure, increasing chronic disease prevalence.
Connected Drug Delivery Devices Market Product Developments
Recent product innovations have focused on improving device usability, data security, and integration with other healthcare technologies. New products are incorporating advanced sensors, improved connectivity options, and enhanced data analytics capabilities. The focus is on developing devices that offer better patient compliance, increased convenience, and valuable clinical insights for healthcare providers. This includes the integration of AI and ML for personalized drug delivery and improved patient outcomes. The market is seeing a trend towards miniaturization and improved biocompatibility of devices.
Report Scope & Segmentation Analysis
This report analyzes the Connected Drug Delivery Devices market across various segments:
By Technology: Bluetooth, Near-field communication (NFC), Other Technologies. Each segment’s market size and growth projections are detailed, along with competitive landscape analysis.
By End-User: Healthcare Providers, Homecare. Analysis covers market size, growth drivers, and key players for each segment.
By Product: Connected Sensors, Connectable Injection Sensors, Integrated Connected Devices. Individual segment analysis includes market size, growth projections, and competitive dynamics.
Key Drivers of Connected Drug Delivery Devices Market Growth
Several key factors drive the market's growth, including:
- Technological advancements: Miniaturization of sensors, improved connectivity, and AI integration.
- Rising prevalence of chronic diseases: Increasing demand for effective drug delivery and patient monitoring.
- Government initiatives: Support for telehealth and digital health technologies in many countries.
- Growing adoption of telehealth: Demand for remote patient monitoring and virtual care solutions.
Challenges in the Connected Drug Delivery Devices Market Sector
Significant challenges hinder market growth, including:
- High initial investment costs: Developing and implementing connected drug delivery solutions requires substantial capital investment.
- Data security and privacy concerns: Protecting sensitive patient data is paramount.
- Regulatory complexities: Navigating varied and evolving regulatory landscapes can be challenging.
- Integration with existing healthcare systems: Seamless integration with electronic health records (EHR) is crucial but often complex.
Emerging Opportunities in Connected Drug Delivery Devices Market
Several emerging opportunities exist for market expansion, including:
- Expansion into emerging markets: Significant growth potential in developing countries.
- Development of new therapeutic applications: Expanding the range of drugs that can be delivered using connected devices.
- Integration with wearables and other digital health tools: Enhanced data collection and patient engagement.
- Focus on personalized medicine: Tailored drug delivery based on individual patient needs and responses.
Leading Players in the Connected Drug Delivery Devices Market Market
Key Developments in Connected Drug Delivery Devices Market Industry
- May 2022: Jabil Healthcare launched the Qfinity autoinjector platform, a reusable connected drug delivery device for subcutaneous administration.
- February 2022: Aptar Pharma launched HeroTracker Sense, a digital respiratory health solution that transforms a standard pMDI into a smart connected device.
Strategic Outlook for Connected Drug Delivery Devices Market Market
The Connected Drug Delivery Devices market presents significant growth opportunities driven by technological advancements, rising demand for personalized medicine, and an increasing focus on improving patient outcomes. Future market expansion will depend on addressing challenges related to data security, regulatory compliance, and seamless integration with existing healthcare systems. Strategic partnerships and innovations in areas like AI and ML will be critical to driving future market growth and shaping the landscape of drug delivery.
Connected Drug Delivery Devices Market Segmentation
-
1. Product
-
1.1. Connected Sensors
- 1.1.1. Connected Inhaler Sensors
- 1.1.2. Connectable Injection Sensors
-
1.2. Integrated Connected Devices
- 1.2.1. Connected Inhaler Devices
- 1.2.2. Connected Injection Devices
-
1.1. Connected Sensors
-
2. Technology
- 2.1. Bluetooth
- 2.2. Near-field communication (NFC)
- 2.3. Other Technologies
-
3. End User
- 3.1. Healthcare Providers
- 3.2. Homecare
Connected Drug Delivery Devices Market Segmentation By Geography
-
1. North America
- 1.1. United States
- 1.2. Canada
- 1.3. Mexico
-
2. Europe
- 2.1. United Kingdom
- 2.2. Germany
- 2.3. France
- 2.4. Italy
- 2.5. Spain
- 2.6. Rest of Europe
-
3. Asia Pacific
- 3.1. China
- 3.2. Japan
- 3.3. India
- 3.4. Australia
- 3.5. South Korea
- 3.6. Rest of Asia Pacific
- 4. Middle East
-
5. GCC
- 5.1. South Africa
- 5.2. Rest of Middle East
-
6. South America
- 6.1. Brazil
- 6.2. Argentina
- 6.3. Rest of South America
Connected Drug Delivery Devices Market Regional Market Share
Geographic Coverage of Connected Drug Delivery Devices Market
Connected Drug Delivery Devices Market REPORT HIGHLIGHTS
| Aspects | Details |
|---|---|
| Study Period | 2020-2034 |
| Base Year | 2025 |
| Estimated Year | 2026 |
| Forecast Period | 2026-2034 |
| Historical Period | 2020-2025 |
| Growth Rate | CAGR of 35.13% from 2020-2034 |
| Segmentation |
|
Table of Contents
- 1. Introduction
- 1.1. Research Scope
- 1.2. Market Segmentation
- 1.3. Research Methodology
- 1.4. Definitions and Assumptions
- 2. Executive Summary
- 2.1. Introduction
- 3. Market Dynamics
- 3.1. Introduction
- 3.2. Market Drivers
- 3.2.1 Increasing Prevalence of Chronic Diseases Such as Asthma
- 3.2.2 COPD
- 3.2.3 and Diabetes; Increased Patient Connectivity and Engagement; Rising Patient Awareness About Adherence to Prescribed Therapies
- 3.3. Market Restrains
- 3.3.1. Increased Cost Of Devices; Increasing Concerns About Data Privacy And Transfer
- 3.4. Market Trends
- 3.4.1. Homecare Segment is Estimated to Register a Significant Growth Rate Over the Forecast Period
- 4. Market Factor Analysis
- 4.1. Porters Five Forces
- 4.2. Supply/Value Chain
- 4.3. PESTEL analysis
- 4.4. Market Entropy
- 4.5. Patent/Trademark Analysis
- 5. Global Connected Drug Delivery Devices Market Analysis, Insights and Forecast, 2020-2032
- 5.1. Market Analysis, Insights and Forecast - by Product
- 5.1.1. Connected Sensors
- 5.1.1.1. Connected Inhaler Sensors
- 5.1.1.2. Connectable Injection Sensors
- 5.1.2. Integrated Connected Devices
- 5.1.2.1. Connected Inhaler Devices
- 5.1.2.2. Connected Injection Devices
- 5.1.1. Connected Sensors
- 5.2. Market Analysis, Insights and Forecast - by Technology
- 5.2.1. Bluetooth
- 5.2.2. Near-field communication (NFC)
- 5.2.3. Other Technologies
- 5.3. Market Analysis, Insights and Forecast - by End User
- 5.3.1. Healthcare Providers
- 5.3.2. Homecare
- 5.4. Market Analysis, Insights and Forecast - by Region
- 5.4.1. North America
- 5.4.2. Europe
- 5.4.3. Asia Pacific
- 5.4.4. Middle East
- 5.4.5. GCC
- 5.4.6. South America
- 5.1. Market Analysis, Insights and Forecast - by Product
- 6. North America Connected Drug Delivery Devices Market Analysis, Insights and Forecast, 2020-2032
- 6.1. Market Analysis, Insights and Forecast - by Product
- 6.1.1. Connected Sensors
- 6.1.1.1. Connected Inhaler Sensors
- 6.1.1.2. Connectable Injection Sensors
- 6.1.2. Integrated Connected Devices
- 6.1.2.1. Connected Inhaler Devices
- 6.1.2.2. Connected Injection Devices
- 6.1.1. Connected Sensors
- 6.2. Market Analysis, Insights and Forecast - by Technology
- 6.2.1. Bluetooth
- 6.2.2. Near-field communication (NFC)
- 6.2.3. Other Technologies
- 6.3. Market Analysis, Insights and Forecast - by End User
- 6.3.1. Healthcare Providers
- 6.3.2. Homecare
- 6.1. Market Analysis, Insights and Forecast - by Product
- 7. Europe Connected Drug Delivery Devices Market Analysis, Insights and Forecast, 2020-2032
- 7.1. Market Analysis, Insights and Forecast - by Product
- 7.1.1. Connected Sensors
- 7.1.1.1. Connected Inhaler Sensors
- 7.1.1.2. Connectable Injection Sensors
- 7.1.2. Integrated Connected Devices
- 7.1.2.1. Connected Inhaler Devices
- 7.1.2.2. Connected Injection Devices
- 7.1.1. Connected Sensors
- 7.2. Market Analysis, Insights and Forecast - by Technology
- 7.2.1. Bluetooth
- 7.2.2. Near-field communication (NFC)
- 7.2.3. Other Technologies
- 7.3. Market Analysis, Insights and Forecast - by End User
- 7.3.1. Healthcare Providers
- 7.3.2. Homecare
- 7.1. Market Analysis, Insights and Forecast - by Product
- 8. Asia Pacific Connected Drug Delivery Devices Market Analysis, Insights and Forecast, 2020-2032
- 8.1. Market Analysis, Insights and Forecast - by Product
- 8.1.1. Connected Sensors
- 8.1.1.1. Connected Inhaler Sensors
- 8.1.1.2. Connectable Injection Sensors
- 8.1.2. Integrated Connected Devices
- 8.1.2.1. Connected Inhaler Devices
- 8.1.2.2. Connected Injection Devices
- 8.1.1. Connected Sensors
- 8.2. Market Analysis, Insights and Forecast - by Technology
- 8.2.1. Bluetooth
- 8.2.2. Near-field communication (NFC)
- 8.2.3. Other Technologies
- 8.3. Market Analysis, Insights and Forecast - by End User
- 8.3.1. Healthcare Providers
- 8.3.2. Homecare
- 8.1. Market Analysis, Insights and Forecast - by Product
- 9. Middle East Connected Drug Delivery Devices Market Analysis, Insights and Forecast, 2020-2032
- 9.1. Market Analysis, Insights and Forecast - by Product
- 9.1.1. Connected Sensors
- 9.1.1.1. Connected Inhaler Sensors
- 9.1.1.2. Connectable Injection Sensors
- 9.1.2. Integrated Connected Devices
- 9.1.2.1. Connected Inhaler Devices
- 9.1.2.2. Connected Injection Devices
- 9.1.1. Connected Sensors
- 9.2. Market Analysis, Insights and Forecast - by Technology
- 9.2.1. Bluetooth
- 9.2.2. Near-field communication (NFC)
- 9.2.3. Other Technologies
- 9.3. Market Analysis, Insights and Forecast - by End User
- 9.3.1. Healthcare Providers
- 9.3.2. Homecare
- 9.1. Market Analysis, Insights and Forecast - by Product
- 10. GCC Connected Drug Delivery Devices Market Analysis, Insights and Forecast, 2020-2032
- 10.1. Market Analysis, Insights and Forecast - by Product
- 10.1.1. Connected Sensors
- 10.1.1.1. Connected Inhaler Sensors
- 10.1.1.2. Connectable Injection Sensors
- 10.1.2. Integrated Connected Devices
- 10.1.2.1. Connected Inhaler Devices
- 10.1.2.2. Connected Injection Devices
- 10.1.1. Connected Sensors
- 10.2. Market Analysis, Insights and Forecast - by Technology
- 10.2.1. Bluetooth
- 10.2.2. Near-field communication (NFC)
- 10.2.3. Other Technologies
- 10.3. Market Analysis, Insights and Forecast - by End User
- 10.3.1. Healthcare Providers
- 10.3.2. Homecare
- 10.1. Market Analysis, Insights and Forecast - by Product
- 11. South America Connected Drug Delivery Devices Market Analysis, Insights and Forecast, 2020-2032
- 11.1. Market Analysis, Insights and Forecast - by Product
- 11.1.1. Connected Sensors
- 11.1.1.1. Connected Inhaler Sensors
- 11.1.1.2. Connectable Injection Sensors
- 11.1.2. Integrated Connected Devices
- 11.1.2.1. Connected Inhaler Devices
- 11.1.2.2. Connected Injection Devices
- 11.1.1. Connected Sensors
- 11.2. Market Analysis, Insights and Forecast - by Technology
- 11.2.1. Bluetooth
- 11.2.2. Near-field communication (NFC)
- 11.2.3. Other Technologies
- 11.3. Market Analysis, Insights and Forecast - by End User
- 11.3.1. Healthcare Providers
- 11.3.2. Homecare
- 11.1. Market Analysis, Insights and Forecast - by Product
- 12. Competitive Analysis
- 12.1. Global Market Share Analysis 2025
- 12.2. Company Profiles
- 12.2.1 West Pharmaceutical Services Inc
- 12.2.1.1. Overview
- 12.2.1.2. Products
- 12.2.1.3. SWOT Analysis
- 12.2.1.4. Recent Developments
- 12.2.1.5. Financials (Based on Availability)
- 12.2.2 Adherium Limited
- 12.2.2.1. Overview
- 12.2.2.2. Products
- 12.2.2.3. SWOT Analysis
- 12.2.2.4. Recent Developments
- 12.2.2.5. Financials (Based on Availability)
- 12.2.3 Bio Corp
- 12.2.3.1. Overview
- 12.2.3.2. Products
- 12.2.3.3. SWOT Analysis
- 12.2.3.4. Recent Developments
- 12.2.3.5. Financials (Based on Availability)
- 12.2.4 Ypsomed AG
- 12.2.4.1. Overview
- 12.2.4.2. Products
- 12.2.4.3. SWOT Analysis
- 12.2.4.4. Recent Developments
- 12.2.4.5. Financials (Based on Availability)
- 12.2.5 Aptar Pharma
- 12.2.5.1. Overview
- 12.2.5.2. Products
- 12.2.5.3. SWOT Analysis
- 12.2.5.4. Recent Developments
- 12.2.5.5. Financials (Based on Availability)
- 12.2.6 Findair Sp z o o
- 12.2.6.1. Overview
- 12.2.6.2. Products
- 12.2.6.3. SWOT Analysis
- 12.2.6.4. Recent Developments
- 12.2.6.5. Financials (Based on Availability)
- 12.2.7 Phillips-Medisize
- 12.2.7.1. Overview
- 12.2.7.2. Products
- 12.2.7.3. SWOT Analysis
- 12.2.7.4. Recent Developments
- 12.2.7.5. Financials (Based on Availability)
- 12.2.8 Teva Pharmaceuticals Industries Ltd
- 12.2.8.1. Overview
- 12.2.8.2. Products
- 12.2.8.3. SWOT Analysis
- 12.2.8.4. Recent Developments
- 12.2.8.5. Financials (Based on Availability)
- 12.2.9 Propeller Health (ResMed Inc )
- 12.2.9.1. Overview
- 12.2.9.2. Products
- 12.2.9.3. SWOT Analysis
- 12.2.9.4. Recent Developments
- 12.2.9.5. Financials (Based on Availability)
- 12.2.1 West Pharmaceutical Services Inc
List of Figures
- Figure 1: Global Connected Drug Delivery Devices Market Revenue Breakdown (Million, %) by Region 2025 & 2033
- Figure 2: Global Connected Drug Delivery Devices Market Volume Breakdown (K Unit, %) by Region 2025 & 2033
- Figure 3: North America Connected Drug Delivery Devices Market Revenue (Million), by Product 2025 & 2033
- Figure 4: North America Connected Drug Delivery Devices Market Volume (K Unit), by Product 2025 & 2033
- Figure 5: North America Connected Drug Delivery Devices Market Revenue Share (%), by Product 2025 & 2033
- Figure 6: North America Connected Drug Delivery Devices Market Volume Share (%), by Product 2025 & 2033
- Figure 7: North America Connected Drug Delivery Devices Market Revenue (Million), by Technology 2025 & 2033
- Figure 8: North America Connected Drug Delivery Devices Market Volume (K Unit), by Technology 2025 & 2033
- Figure 9: North America Connected Drug Delivery Devices Market Revenue Share (%), by Technology 2025 & 2033
- Figure 10: North America Connected Drug Delivery Devices Market Volume Share (%), by Technology 2025 & 2033
- Figure 11: North America Connected Drug Delivery Devices Market Revenue (Million), by End User 2025 & 2033
- Figure 12: North America Connected Drug Delivery Devices Market Volume (K Unit), by End User 2025 & 2033
- Figure 13: North America Connected Drug Delivery Devices Market Revenue Share (%), by End User 2025 & 2033
- Figure 14: North America Connected Drug Delivery Devices Market Volume Share (%), by End User 2025 & 2033
- Figure 15: North America Connected Drug Delivery Devices Market Revenue (Million), by Country 2025 & 2033
- Figure 16: North America Connected Drug Delivery Devices Market Volume (K Unit), by Country 2025 & 2033
- Figure 17: North America Connected Drug Delivery Devices Market Revenue Share (%), by Country 2025 & 2033
- Figure 18: North America Connected Drug Delivery Devices Market Volume Share (%), by Country 2025 & 2033
- Figure 19: Europe Connected Drug Delivery Devices Market Revenue (Million), by Product 2025 & 2033
- Figure 20: Europe Connected Drug Delivery Devices Market Volume (K Unit), by Product 2025 & 2033
- Figure 21: Europe Connected Drug Delivery Devices Market Revenue Share (%), by Product 2025 & 2033
- Figure 22: Europe Connected Drug Delivery Devices Market Volume Share (%), by Product 2025 & 2033
- Figure 23: Europe Connected Drug Delivery Devices Market Revenue (Million), by Technology 2025 & 2033
- Figure 24: Europe Connected Drug Delivery Devices Market Volume (K Unit), by Technology 2025 & 2033
- Figure 25: Europe Connected Drug Delivery Devices Market Revenue Share (%), by Technology 2025 & 2033
- Figure 26: Europe Connected Drug Delivery Devices Market Volume Share (%), by Technology 2025 & 2033
- Figure 27: Europe Connected Drug Delivery Devices Market Revenue (Million), by End User 2025 & 2033
- Figure 28: Europe Connected Drug Delivery Devices Market Volume (K Unit), by End User 2025 & 2033
- Figure 29: Europe Connected Drug Delivery Devices Market Revenue Share (%), by End User 2025 & 2033
- Figure 30: Europe Connected Drug Delivery Devices Market Volume Share (%), by End User 2025 & 2033
- Figure 31: Europe Connected Drug Delivery Devices Market Revenue (Million), by Country 2025 & 2033
- Figure 32: Europe Connected Drug Delivery Devices Market Volume (K Unit), by Country 2025 & 2033
- Figure 33: Europe Connected Drug Delivery Devices Market Revenue Share (%), by Country 2025 & 2033
- Figure 34: Europe Connected Drug Delivery Devices Market Volume Share (%), by Country 2025 & 2033
- Figure 35: Asia Pacific Connected Drug Delivery Devices Market Revenue (Million), by Product 2025 & 2033
- Figure 36: Asia Pacific Connected Drug Delivery Devices Market Volume (K Unit), by Product 2025 & 2033
- Figure 37: Asia Pacific Connected Drug Delivery Devices Market Revenue Share (%), by Product 2025 & 2033
- Figure 38: Asia Pacific Connected Drug Delivery Devices Market Volume Share (%), by Product 2025 & 2033
- Figure 39: Asia Pacific Connected Drug Delivery Devices Market Revenue (Million), by Technology 2025 & 2033
- Figure 40: Asia Pacific Connected Drug Delivery Devices Market Volume (K Unit), by Technology 2025 & 2033
- Figure 41: Asia Pacific Connected Drug Delivery Devices Market Revenue Share (%), by Technology 2025 & 2033
- Figure 42: Asia Pacific Connected Drug Delivery Devices Market Volume Share (%), by Technology 2025 & 2033
- Figure 43: Asia Pacific Connected Drug Delivery Devices Market Revenue (Million), by End User 2025 & 2033
- Figure 44: Asia Pacific Connected Drug Delivery Devices Market Volume (K Unit), by End User 2025 & 2033
- Figure 45: Asia Pacific Connected Drug Delivery Devices Market Revenue Share (%), by End User 2025 & 2033
- Figure 46: Asia Pacific Connected Drug Delivery Devices Market Volume Share (%), by End User 2025 & 2033
- Figure 47: Asia Pacific Connected Drug Delivery Devices Market Revenue (Million), by Country 2025 & 2033
- Figure 48: Asia Pacific Connected Drug Delivery Devices Market Volume (K Unit), by Country 2025 & 2033
- Figure 49: Asia Pacific Connected Drug Delivery Devices Market Revenue Share (%), by Country 2025 & 2033
- Figure 50: Asia Pacific Connected Drug Delivery Devices Market Volume Share (%), by Country 2025 & 2033
- Figure 51: Middle East Connected Drug Delivery Devices Market Revenue (Million), by Product 2025 & 2033
- Figure 52: Middle East Connected Drug Delivery Devices Market Volume (K Unit), by Product 2025 & 2033
- Figure 53: Middle East Connected Drug Delivery Devices Market Revenue Share (%), by Product 2025 & 2033
- Figure 54: Middle East Connected Drug Delivery Devices Market Volume Share (%), by Product 2025 & 2033
- Figure 55: Middle East Connected Drug Delivery Devices Market Revenue (Million), by Technology 2025 & 2033
- Figure 56: Middle East Connected Drug Delivery Devices Market Volume (K Unit), by Technology 2025 & 2033
- Figure 57: Middle East Connected Drug Delivery Devices Market Revenue Share (%), by Technology 2025 & 2033
- Figure 58: Middle East Connected Drug Delivery Devices Market Volume Share (%), by Technology 2025 & 2033
- Figure 59: Middle East Connected Drug Delivery Devices Market Revenue (Million), by End User 2025 & 2033
- Figure 60: Middle East Connected Drug Delivery Devices Market Volume (K Unit), by End User 2025 & 2033
- Figure 61: Middle East Connected Drug Delivery Devices Market Revenue Share (%), by End User 2025 & 2033
- Figure 62: Middle East Connected Drug Delivery Devices Market Volume Share (%), by End User 2025 & 2033
- Figure 63: Middle East Connected Drug Delivery Devices Market Revenue (Million), by Country 2025 & 2033
- Figure 64: Middle East Connected Drug Delivery Devices Market Volume (K Unit), by Country 2025 & 2033
- Figure 65: Middle East Connected Drug Delivery Devices Market Revenue Share (%), by Country 2025 & 2033
- Figure 66: Middle East Connected Drug Delivery Devices Market Volume Share (%), by Country 2025 & 2033
- Figure 67: GCC Connected Drug Delivery Devices Market Revenue (Million), by Product 2025 & 2033
- Figure 68: GCC Connected Drug Delivery Devices Market Volume (K Unit), by Product 2025 & 2033
- Figure 69: GCC Connected Drug Delivery Devices Market Revenue Share (%), by Product 2025 & 2033
- Figure 70: GCC Connected Drug Delivery Devices Market Volume Share (%), by Product 2025 & 2033
- Figure 71: GCC Connected Drug Delivery Devices Market Revenue (Million), by Technology 2025 & 2033
- Figure 72: GCC Connected Drug Delivery Devices Market Volume (K Unit), by Technology 2025 & 2033
- Figure 73: GCC Connected Drug Delivery Devices Market Revenue Share (%), by Technology 2025 & 2033
- Figure 74: GCC Connected Drug Delivery Devices Market Volume Share (%), by Technology 2025 & 2033
- Figure 75: GCC Connected Drug Delivery Devices Market Revenue (Million), by End User 2025 & 2033
- Figure 76: GCC Connected Drug Delivery Devices Market Volume (K Unit), by End User 2025 & 2033
- Figure 77: GCC Connected Drug Delivery Devices Market Revenue Share (%), by End User 2025 & 2033
- Figure 78: GCC Connected Drug Delivery Devices Market Volume Share (%), by End User 2025 & 2033
- Figure 79: GCC Connected Drug Delivery Devices Market Revenue (Million), by Country 2025 & 2033
- Figure 80: GCC Connected Drug Delivery Devices Market Volume (K Unit), by Country 2025 & 2033
- Figure 81: GCC Connected Drug Delivery Devices Market Revenue Share (%), by Country 2025 & 2033
- Figure 82: GCC Connected Drug Delivery Devices Market Volume Share (%), by Country 2025 & 2033
- Figure 83: South America Connected Drug Delivery Devices Market Revenue (Million), by Product 2025 & 2033
- Figure 84: South America Connected Drug Delivery Devices Market Volume (K Unit), by Product 2025 & 2033
- Figure 85: South America Connected Drug Delivery Devices Market Revenue Share (%), by Product 2025 & 2033
- Figure 86: South America Connected Drug Delivery Devices Market Volume Share (%), by Product 2025 & 2033
- Figure 87: South America Connected Drug Delivery Devices Market Revenue (Million), by Technology 2025 & 2033
- Figure 88: South America Connected Drug Delivery Devices Market Volume (K Unit), by Technology 2025 & 2033
- Figure 89: South America Connected Drug Delivery Devices Market Revenue Share (%), by Technology 2025 & 2033
- Figure 90: South America Connected Drug Delivery Devices Market Volume Share (%), by Technology 2025 & 2033
- Figure 91: South America Connected Drug Delivery Devices Market Revenue (Million), by End User 2025 & 2033
- Figure 92: South America Connected Drug Delivery Devices Market Volume (K Unit), by End User 2025 & 2033
- Figure 93: South America Connected Drug Delivery Devices Market Revenue Share (%), by End User 2025 & 2033
- Figure 94: South America Connected Drug Delivery Devices Market Volume Share (%), by End User 2025 & 2033
- Figure 95: South America Connected Drug Delivery Devices Market Revenue (Million), by Country 2025 & 2033
- Figure 96: South America Connected Drug Delivery Devices Market Volume (K Unit), by Country 2025 & 2033
- Figure 97: South America Connected Drug Delivery Devices Market Revenue Share (%), by Country 2025 & 2033
- Figure 98: South America Connected Drug Delivery Devices Market Volume Share (%), by Country 2025 & 2033
List of Tables
- Table 1: Global Connected Drug Delivery Devices Market Revenue Million Forecast, by Product 2020 & 2033
- Table 2: Global Connected Drug Delivery Devices Market Volume K Unit Forecast, by Product 2020 & 2033
- Table 3: Global Connected Drug Delivery Devices Market Revenue Million Forecast, by Technology 2020 & 2033
- Table 4: Global Connected Drug Delivery Devices Market Volume K Unit Forecast, by Technology 2020 & 2033
- Table 5: Global Connected Drug Delivery Devices Market Revenue Million Forecast, by End User 2020 & 2033
- Table 6: Global Connected Drug Delivery Devices Market Volume K Unit Forecast, by End User 2020 & 2033
- Table 7: Global Connected Drug Delivery Devices Market Revenue Million Forecast, by Region 2020 & 2033
- Table 8: Global Connected Drug Delivery Devices Market Volume K Unit Forecast, by Region 2020 & 2033
- Table 9: Global Connected Drug Delivery Devices Market Revenue Million Forecast, by Product 2020 & 2033
- Table 10: Global Connected Drug Delivery Devices Market Volume K Unit Forecast, by Product 2020 & 2033
- Table 11: Global Connected Drug Delivery Devices Market Revenue Million Forecast, by Technology 2020 & 2033
- Table 12: Global Connected Drug Delivery Devices Market Volume K Unit Forecast, by Technology 2020 & 2033
- Table 13: Global Connected Drug Delivery Devices Market Revenue Million Forecast, by End User 2020 & 2033
- Table 14: Global Connected Drug Delivery Devices Market Volume K Unit Forecast, by End User 2020 & 2033
- Table 15: Global Connected Drug Delivery Devices Market Revenue Million Forecast, by Country 2020 & 2033
- Table 16: Global Connected Drug Delivery Devices Market Volume K Unit Forecast, by Country 2020 & 2033
- Table 17: United States Connected Drug Delivery Devices Market Revenue (Million) Forecast, by Application 2020 & 2033
- Table 18: United States Connected Drug Delivery Devices Market Volume (K Unit) Forecast, by Application 2020 & 2033
- Table 19: Canada Connected Drug Delivery Devices Market Revenue (Million) Forecast, by Application 2020 & 2033
- Table 20: Canada Connected Drug Delivery Devices Market Volume (K Unit) Forecast, by Application 2020 & 2033
- Table 21: Mexico Connected Drug Delivery Devices Market Revenue (Million) Forecast, by Application 2020 & 2033
- Table 22: Mexico Connected Drug Delivery Devices Market Volume (K Unit) Forecast, by Application 2020 & 2033
- Table 23: Global Connected Drug Delivery Devices Market Revenue Million Forecast, by Product 2020 & 2033
- Table 24: Global Connected Drug Delivery Devices Market Volume K Unit Forecast, by Product 2020 & 2033
- Table 25: Global Connected Drug Delivery Devices Market Revenue Million Forecast, by Technology 2020 & 2033
- Table 26: Global Connected Drug Delivery Devices Market Volume K Unit Forecast, by Technology 2020 & 2033
- Table 27: Global Connected Drug Delivery Devices Market Revenue Million Forecast, by End User 2020 & 2033
- Table 28: Global Connected Drug Delivery Devices Market Volume K Unit Forecast, by End User 2020 & 2033
- Table 29: Global Connected Drug Delivery Devices Market Revenue Million Forecast, by Country 2020 & 2033
- Table 30: Global Connected Drug Delivery Devices Market Volume K Unit Forecast, by Country 2020 & 2033
- Table 31: United Kingdom Connected Drug Delivery Devices Market Revenue (Million) Forecast, by Application 2020 & 2033
- Table 32: United Kingdom Connected Drug Delivery Devices Market Volume (K Unit) Forecast, by Application 2020 & 2033
- Table 33: Germany Connected Drug Delivery Devices Market Revenue (Million) Forecast, by Application 2020 & 2033
- Table 34: Germany Connected Drug Delivery Devices Market Volume (K Unit) Forecast, by Application 2020 & 2033
- Table 35: France Connected Drug Delivery Devices Market Revenue (Million) Forecast, by Application 2020 & 2033
- Table 36: France Connected Drug Delivery Devices Market Volume (K Unit) Forecast, by Application 2020 & 2033
- Table 37: Italy Connected Drug Delivery Devices Market Revenue (Million) Forecast, by Application 2020 & 2033
- Table 38: Italy Connected Drug Delivery Devices Market Volume (K Unit) Forecast, by Application 2020 & 2033
- Table 39: Spain Connected Drug Delivery Devices Market Revenue (Million) Forecast, by Application 2020 & 2033
- Table 40: Spain Connected Drug Delivery Devices Market Volume (K Unit) Forecast, by Application 2020 & 2033
- Table 41: Rest of Europe Connected Drug Delivery Devices Market Revenue (Million) Forecast, by Application 2020 & 2033
- Table 42: Rest of Europe Connected Drug Delivery Devices Market Volume (K Unit) Forecast, by Application 2020 & 2033
- Table 43: Global Connected Drug Delivery Devices Market Revenue Million Forecast, by Product 2020 & 2033
- Table 44: Global Connected Drug Delivery Devices Market Volume K Unit Forecast, by Product 2020 & 2033
- Table 45: Global Connected Drug Delivery Devices Market Revenue Million Forecast, by Technology 2020 & 2033
- Table 46: Global Connected Drug Delivery Devices Market Volume K Unit Forecast, by Technology 2020 & 2033
- Table 47: Global Connected Drug Delivery Devices Market Revenue Million Forecast, by End User 2020 & 2033
- Table 48: Global Connected Drug Delivery Devices Market Volume K Unit Forecast, by End User 2020 & 2033
- Table 49: Global Connected Drug Delivery Devices Market Revenue Million Forecast, by Country 2020 & 2033
- Table 50: Global Connected Drug Delivery Devices Market Volume K Unit Forecast, by Country 2020 & 2033
- Table 51: China Connected Drug Delivery Devices Market Revenue (Million) Forecast, by Application 2020 & 2033
- Table 52: China Connected Drug Delivery Devices Market Volume (K Unit) Forecast, by Application 2020 & 2033
- Table 53: Japan Connected Drug Delivery Devices Market Revenue (Million) Forecast, by Application 2020 & 2033
- Table 54: Japan Connected Drug Delivery Devices Market Volume (K Unit) Forecast, by Application 2020 & 2033
- Table 55: India Connected Drug Delivery Devices Market Revenue (Million) Forecast, by Application 2020 & 2033
- Table 56: India Connected Drug Delivery Devices Market Volume (K Unit) Forecast, by Application 2020 & 2033
- Table 57: Australia Connected Drug Delivery Devices Market Revenue (Million) Forecast, by Application 2020 & 2033
- Table 58: Australia Connected Drug Delivery Devices Market Volume (K Unit) Forecast, by Application 2020 & 2033
- Table 59: South Korea Connected Drug Delivery Devices Market Revenue (Million) Forecast, by Application 2020 & 2033
- Table 60: South Korea Connected Drug Delivery Devices Market Volume (K Unit) Forecast, by Application 2020 & 2033
- Table 61: Rest of Asia Pacific Connected Drug Delivery Devices Market Revenue (Million) Forecast, by Application 2020 & 2033
- Table 62: Rest of Asia Pacific Connected Drug Delivery Devices Market Volume (K Unit) Forecast, by Application 2020 & 2033
- Table 63: Global Connected Drug Delivery Devices Market Revenue Million Forecast, by Product 2020 & 2033
- Table 64: Global Connected Drug Delivery Devices Market Volume K Unit Forecast, by Product 2020 & 2033
- Table 65: Global Connected Drug Delivery Devices Market Revenue Million Forecast, by Technology 2020 & 2033
- Table 66: Global Connected Drug Delivery Devices Market Volume K Unit Forecast, by Technology 2020 & 2033
- Table 67: Global Connected Drug Delivery Devices Market Revenue Million Forecast, by End User 2020 & 2033
- Table 68: Global Connected Drug Delivery Devices Market Volume K Unit Forecast, by End User 2020 & 2033
- Table 69: Global Connected Drug Delivery Devices Market Revenue Million Forecast, by Country 2020 & 2033
- Table 70: Global Connected Drug Delivery Devices Market Volume K Unit Forecast, by Country 2020 & 2033
- Table 71: Global Connected Drug Delivery Devices Market Revenue Million Forecast, by Product 2020 & 2033
- Table 72: Global Connected Drug Delivery Devices Market Volume K Unit Forecast, by Product 2020 & 2033
- Table 73: Global Connected Drug Delivery Devices Market Revenue Million Forecast, by Technology 2020 & 2033
- Table 74: Global Connected Drug Delivery Devices Market Volume K Unit Forecast, by Technology 2020 & 2033
- Table 75: Global Connected Drug Delivery Devices Market Revenue Million Forecast, by End User 2020 & 2033
- Table 76: Global Connected Drug Delivery Devices Market Volume K Unit Forecast, by End User 2020 & 2033
- Table 77: Global Connected Drug Delivery Devices Market Revenue Million Forecast, by Country 2020 & 2033
- Table 78: Global Connected Drug Delivery Devices Market Volume K Unit Forecast, by Country 2020 & 2033
- Table 79: South Africa Connected Drug Delivery Devices Market Revenue (Million) Forecast, by Application 2020 & 2033
- Table 80: South Africa Connected Drug Delivery Devices Market Volume (K Unit) Forecast, by Application 2020 & 2033
- Table 81: Rest of Middle East Connected Drug Delivery Devices Market Revenue (Million) Forecast, by Application 2020 & 2033
- Table 82: Rest of Middle East Connected Drug Delivery Devices Market Volume (K Unit) Forecast, by Application 2020 & 2033
- Table 83: Global Connected Drug Delivery Devices Market Revenue Million Forecast, by Product 2020 & 2033
- Table 84: Global Connected Drug Delivery Devices Market Volume K Unit Forecast, by Product 2020 & 2033
- Table 85: Global Connected Drug Delivery Devices Market Revenue Million Forecast, by Technology 2020 & 2033
- Table 86: Global Connected Drug Delivery Devices Market Volume K Unit Forecast, by Technology 2020 & 2033
- Table 87: Global Connected Drug Delivery Devices Market Revenue Million Forecast, by End User 2020 & 2033
- Table 88: Global Connected Drug Delivery Devices Market Volume K Unit Forecast, by End User 2020 & 2033
- Table 89: Global Connected Drug Delivery Devices Market Revenue Million Forecast, by Country 2020 & 2033
- Table 90: Global Connected Drug Delivery Devices Market Volume K Unit Forecast, by Country 2020 & 2033
- Table 91: Brazil Connected Drug Delivery Devices Market Revenue (Million) Forecast, by Application 2020 & 2033
- Table 92: Brazil Connected Drug Delivery Devices Market Volume (K Unit) Forecast, by Application 2020 & 2033
- Table 93: Argentina Connected Drug Delivery Devices Market Revenue (Million) Forecast, by Application 2020 & 2033
- Table 94: Argentina Connected Drug Delivery Devices Market Volume (K Unit) Forecast, by Application 2020 & 2033
- Table 95: Rest of South America Connected Drug Delivery Devices Market Revenue (Million) Forecast, by Application 2020 & 2033
- Table 96: Rest of South America Connected Drug Delivery Devices Market Volume (K Unit) Forecast, by Application 2020 & 2033
Frequently Asked Questions
1. What is the projected Compound Annual Growth Rate (CAGR) of the Connected Drug Delivery Devices Market?
The projected CAGR is approximately 35.13%.
2. Which companies are prominent players in the Connected Drug Delivery Devices Market?
Key companies in the market include West Pharmaceutical Services Inc, Adherium Limited, Bio Corp, Ypsomed AG, Aptar Pharma, Findair Sp z o o, Phillips-Medisize, Teva Pharmaceuticals Industries Ltd, Propeller Health (ResMed Inc ).
3. What are the main segments of the Connected Drug Delivery Devices Market?
The market segments include Product, Technology, End User.
4. Can you provide details about the market size?
The market size is estimated to be USD 1.18 Million as of 2022.
5. What are some drivers contributing to market growth?
Increasing Prevalence of Chronic Diseases Such as Asthma. COPD. and Diabetes; Increased Patient Connectivity and Engagement; Rising Patient Awareness About Adherence to Prescribed Therapies.
6. What are the notable trends driving market growth?
Homecare Segment is Estimated to Register a Significant Growth Rate Over the Forecast Period.
7. Are there any restraints impacting market growth?
Increased Cost Of Devices; Increasing Concerns About Data Privacy And Transfer.
8. Can you provide examples of recent developments in the market?
In May 2022, Jabil Healthcare, a division of Jabil Inc. launched the Qfinity autoinjector platform in the United States, a reusable drug delivery device for subcutaneous (SC) drug self-administration. The product also comes in a connected option.
9. What pricing options are available for accessing the report?
Pricing options include single-user, multi-user, and enterprise licenses priced at USD 4750, USD 5250, and USD 8750 respectively.
10. Is the market size provided in terms of value or volume?
The market size is provided in terms of value, measured in Million and volume, measured in K Unit.
11. Are there any specific market keywords associated with the report?
Yes, the market keyword associated with the report is "Connected Drug Delivery Devices Market," which aids in identifying and referencing the specific market segment covered.
12. How do I determine which pricing option suits my needs best?
The pricing options vary based on user requirements and access needs. Individual users may opt for single-user licenses, while businesses requiring broader access may choose multi-user or enterprise licenses for cost-effective access to the report.
13. Are there any additional resources or data provided in the Connected Drug Delivery Devices Market report?
While the report offers comprehensive insights, it's advisable to review the specific contents or supplementary materials provided to ascertain if additional resources or data are available.
14. How can I stay updated on further developments or reports in the Connected Drug Delivery Devices Market?
To stay informed about further developments, trends, and reports in the Connected Drug Delivery Devices Market, consider subscribing to industry newsletters, following relevant companies and organizations, or regularly checking reputable industry news sources and publications.
Methodology
Step 1 - Identification of Relevant Samples Size from Population Database


Step 2 - Approaches for Defining Global Market Size (Value, Volume* & Price*)

Note*: In applicable scenarios
Step 3 - Data Sources
Primary Research
- Web Analytics
- Survey Reports
- Research Institute
- Latest Research Reports
- Opinion Leaders
Secondary Research
- Annual Reports
- White Paper
- Latest Press Release
- Industry Association
- Paid Database
- Investor Presentations

Step 4 - Data Triangulation
Involves using different sources of information in order to increase the validity of a study
These sources are likely to be stakeholders in a program - participants, other researchers, program staff, other community members, and so on.
Then we put all data in single framework & apply various statistical tools to find out the dynamic on the market.
During the analysis stage, feedback from the stakeholder groups would be compared to determine areas of agreement as well as areas of divergence