

Key Insights
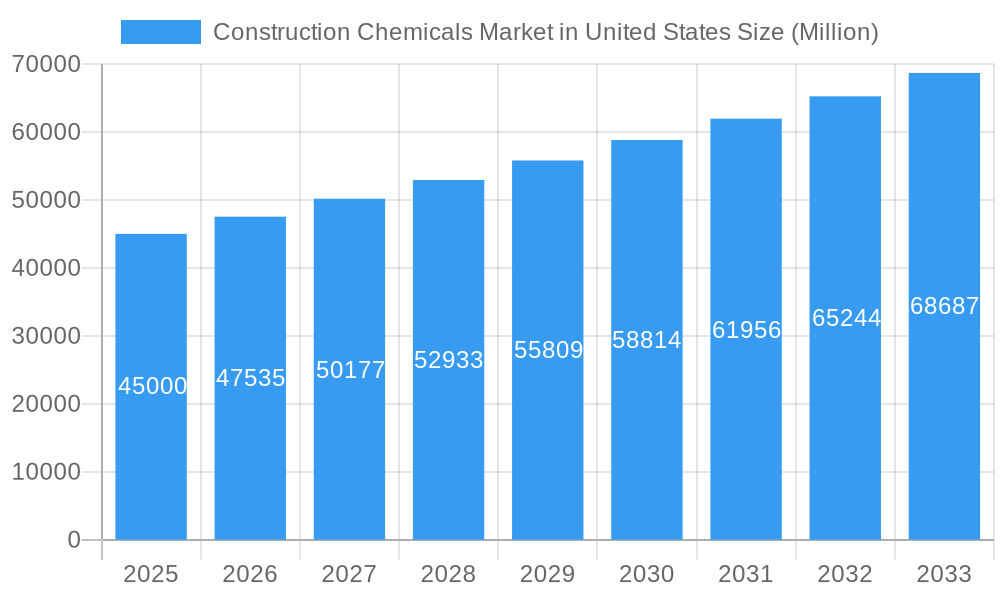
The United States construction chemicals market is projected for substantial growth, with an estimated market size of $11411.4 million by 2033, and a Compound Annual Growth Rate (CAGR) of 5.27% from the base year 2025. This expansion is driven by significant investments in infrastructure development, including new projects and upgrades to existing facilities, supported by government funding for transportation, utilities, and public buildings. The residential construction sector also shows resilience, fueled by population growth, urbanization, and a preference for durable, energy-efficient homes. Industrial and commercial segments contribute to demand through ongoing expansions and modernizations.
Construction Chemicals Market in United States Market Size (In Billion)
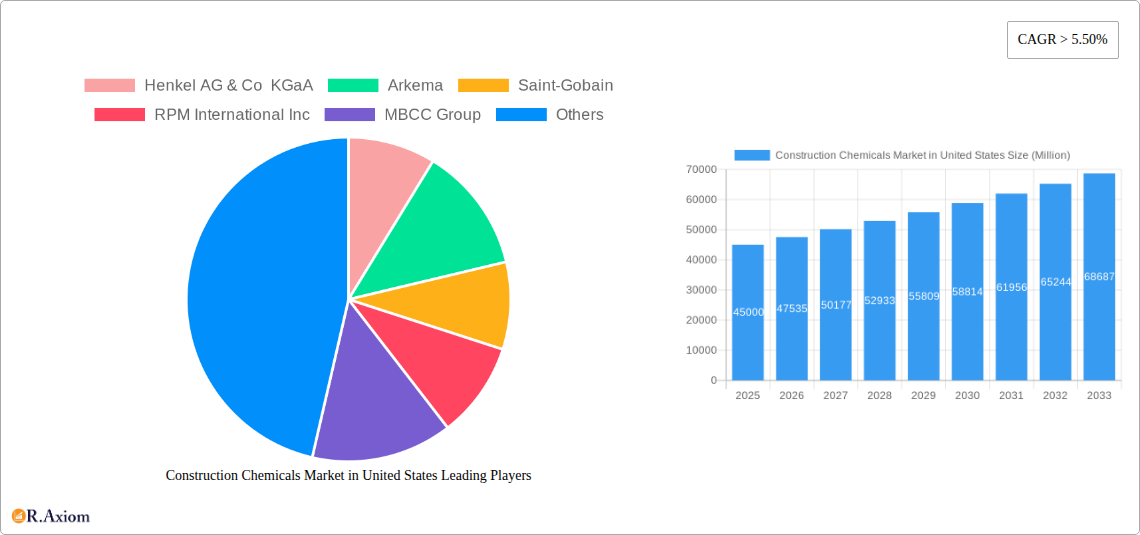
Key market trends include a growing emphasis on sustainable construction, leading to the adoption of low-VOC and bio-based chemicals. Innovations in high-performance concrete admixtures, advanced waterproofing, and specialized repair solutions are enhancing structural longevity. The market is segmented by product categories such as adhesives, anchors, grouts, concrete admixtures, coatings, flooring resins, repair chemicals, sealants, surface treatments, and waterproofing. Prominent players like Henkel AG & Co KGaA, Arkema, Saint-Gobain, RPM International Inc., and Sika AG are actively pursuing R&D, strategic acquisitions, and portfolio expansion.
Construction Chemicals Market in United States Company Market Share
This report offers an in-depth analysis of the US construction chemicals market from 2019 to 2033. It covers market size, growth trends, key segments, and the competitive landscape, providing actionable insights for stakeholders. The detailed overview includes market drivers, challenges, and future opportunities within the United States construction chemicals industry.
The United States construction chemicals market is projected to reach $11411.4 million by 2033, exhibiting a CAGR of 5.27% from a base year of 2025. This growth is driven by robust infrastructure development, increasing demand for sustainable building materials, and advancements in chemical formulations. Our analysis provides detailed segmentation by end-use sector and product type, offering a granular understanding of market dynamics.
Construction Chemicals Market in United States Market Concentration & Innovation
The US construction chemicals market exhibits a moderate to high degree of market concentration, with several global players holding significant market share. Key companies like Henkel AG & Co KGaA, Arkema, Saint-Gobain, RPM International Inc., MBCC Group, Dow, H B Fuller Company, Ardex Group, Sika AG, and Mapei S.p.A. are actively shaping the competitive landscape through strategic initiatives. Innovation remains a critical driver, with companies investing heavily in R&D to develop advanced, eco-friendly, and high-performance construction chemicals. This includes the development of novel concrete admixtures, durable flooring resins, and efficient waterproofing solutions. Regulatory frameworks, such as those governing VOC emissions and material safety, also influence product development and market entry. The threat of product substitutes, while present in some basic categories, is mitigated by the specialized performance characteristics of advanced construction chemicals. End-user trends towards sustainable construction, energy efficiency, and faster project completion times are directly fueling demand for innovative chemical solutions. Mergers and acquisitions are significant, as demonstrated by Sika's acquisition of MBCC Group, indicating consolidation and strategic expansion within the sector. The M&A deal value for this acquisition was approximately $5 Billion, significantly impacting market share and product portfolios.
Construction Chemicals Market in United States Industry Trends & Insights
The construction chemicals market in the United States is experiencing robust growth, driven by a confluence of economic, technological, and regulatory factors. A key growth driver is the sustained investment in infrastructure development and the revitalization of existing infrastructure across the nation. Government initiatives aimed at modernizing roads, bridges, and public facilities directly translate into increased demand for concrete admixtures, repair and rehabilitation chemicals, and protective coatings. Furthermore, the burgeoning residential and commercial construction sectors, fueled by population growth and urbanization, contribute significantly to market expansion. The increasing adoption of green building practices and a growing awareness of environmental sustainability are compelling manufacturers to develop and promote eco-friendly construction chemicals. This includes low-VOC sealants, water-based adhesives, and bio-based concrete admixtures. Technological disruptions are also playing a pivotal role. Advancements in material science have led to the development of high-performance polymers, nano-materials, and self-healing concrete additives, offering enhanced durability, strength, and longevity to construction projects. These innovations not only improve the performance of buildings and infrastructure but also contribute to reduced maintenance costs and a smaller environmental footprint. Consumer preferences are shifting towards solutions that offer faster application times, improved aesthetics, and long-term performance. This is evident in the rising demand for advanced flooring resins, such as polyaspartics, and high-strength, rapid-setting repair mortars. The competitive dynamics within the US construction chemicals industry are characterized by intense competition among established global players and emerging regional manufacturers. Strategic partnerships, product differentiation, and a focus on customer-centric solutions are key strategies employed by companies to gain a competitive edge. The market penetration of specialized construction chemicals is steadily increasing as specifiers and contractors recognize their value in addressing complex construction challenges. The projected market size for the US construction chemicals market is estimated to reach $XX Billion by 2033, with a CAGR of X.X% during the forecast period.
Dominant Markets & Segments in Construction Chemicals Market in United States
The Construction Chemicals Market in the United States is characterized by significant dominance within specific end-use sectors and product categories, driven by distinct market forces and application requirements.
End Use Sector Dominance:
- Infrastructure: This segment holds substantial dominance due to ongoing and planned large-scale public and private investments in transportation networks (roads, bridges, airports), utilities (water and wastewater systems), and energy projects. The need for durable, long-lasting, and resilient materials to withstand extreme weather conditions and heavy usage makes construction chemicals indispensable.
- Key Drivers: Government infrastructure spending, repair and maintenance of aging infrastructure, increasing demand for sustainable and resilient construction materials, and the expansion of renewable energy projects.
- Commercial: The growth of the commercial sector, encompassing office buildings, retail spaces, and hospitality establishments, is a significant contributor. Architects and developers are increasingly opting for advanced construction chemicals to enhance aesthetics, functionality, and energy efficiency.
- Key Drivers: Urbanization, economic growth, increasing demand for modern and aesthetically pleasing commercial spaces, and the trend towards sustainable building certifications like LEED.
- Residential: While perhaps not as dominant as infrastructure in terms of sheer volume for certain products, the residential sector remains a critical market. Demand for improved insulation, water resistance, and aesthetic finishes drives the adoption of various construction chemicals.
- Key Drivers: Growing population, increasing disposable incomes, housing demand, and a focus on energy-efficient and durable homes.
- Industrial and Institutional: This segment includes manufacturing facilities, healthcare centers, and educational institutions. The demand here is driven by the need for specialized chemicals that offer resistance to harsh environments, high traffic, and specific performance requirements.
- Key Drivers: Industrial expansion, development of advanced manufacturing facilities, increasing demand for sterile and high-performance environments in healthcare and educational institutions.
Product Segment Dominance:
- Concrete Admixtures: This is a dominant product category due to its widespread use in virtually all construction projects involving concrete. The ability to modify concrete properties like workability, strength, and durability makes them essential.
- Sub-Product Dominance:
- High Range Water Reducer (Super Plasticizer): Crucial for producing high-strength and self-compacting concrete, widely used in infrastructure and high-rise buildings.
- Accelerator: Essential for cold weather concreting and rapid construction timelines.
- Water Reducer (Plasticizer): A staple for improving workability and reducing water content in standard concrete applications.
- Sub-Product Dominance:
- Waterproofing Solutions: Essential for protecting structures from water damage, which can lead to costly repairs and structural degradation.
- Sub-Product Dominance:
- Membranes: Both liquid-applied and sheet membranes are widely adopted for roofing, basements, and foundation waterproofing.
- Sub-Product Dominance:
- Adhesives: Crucial for bonding various construction materials, from flooring and tiling to structural elements.
- Sub-Product Dominance:
- Water-borne Adhesives: Increasingly favored for their low VOC content and ease of use, particularly in residential and commercial interior applications.
- Reactive Adhesives: Offer high bond strength and durability for structural applications.
- Sub-Product Dominance:
- Repair and Rehabilitation Chemicals: Vital for extending the lifespan of existing structures and addressing damage caused by environmental factors or wear and tear.
- Sub-Product Dominance:
- Micro-concrete Mortars & Modified Mortars: Widely used for patching and repairing concrete surfaces.
- Fiber Wrapping Systems: Gaining traction for their ability to strengthen and restore distressed structural elements.
- Sub-Product Dominance:
The dominance of these segments is further amplified by ongoing technological advancements, a strong regulatory push for durable and sustainable construction, and substantial investments in the US construction sector.
Construction Chemicals Market in United States Product Developments
Product development in the US construction chemicals market is heavily focused on enhancing performance, sustainability, and application efficiency. Innovations are emerging in the development of advanced concrete admixtures that offer superior strength and reduced environmental impact, such as self-healing concrete additives. The demand for eco-friendly solutions is driving the development of low-VOC adhesives and sealants, as well as bio-based flooring resins. Companies are also introducing high-performance repair and rehabilitation chemicals that extend the lifespan of existing infrastructure and buildings. For instance, advancements in fiber wrapping systems and advanced injection grouting materials are providing stronger and more durable repair solutions. The trend towards faster construction times is leading to the development of rapid-setting mortars and quick-cure protective coatings. These product developments are crucial for maintaining a competitive edge and meeting the evolving demands of the US construction industry.
Report Scope & Segmentation Analysis
This report meticulously analyzes the Construction Chemicals Market in the United States across a comprehensive range of segments.
End Use Sector Segmentation:
- Commercial: This segment encompasses office buildings, retail spaces, hotels, and entertainment venues. It is characterized by a demand for aesthetic appeal, durability, and specific performance attributes, projected for significant growth.
- Industrial and Institutional: This includes manufacturing facilities, power plants, hospitals, and educational institutions. The segment's growth is driven by the need for chemicals offering high resistance to extreme conditions, heavy traffic, and specialized functional requirements.
- Infrastructure: This vital segment covers roads, bridges, tunnels, airports, and utilities. Growth is fueled by substantial government investment in modernization and expansion, requiring robust and long-lasting chemical solutions.
- Residential: This segment includes single-family homes, multi-family apartments, and condominiums. Demand here is driven by new construction and renovation projects, with a focus on energy efficiency and improved living comfort.
Product Segmentation:
- Adhesives: Sub-segmented into Hot Melt, Reactive, Solvent-borne, and Water-borne types, with water-borne and reactive adhesives showing strong growth due to environmental and performance benefits.
- Anchors and Grouts: Includes Cementitious Fixing, Resin Fixing, and Other Types, with resin-based solutions offering superior strength and durability.
- Concrete Admixtures: Categorized into Accelerator, Air Entraining Admixture, High Range Water Reducer (Super Plasticizer), Retarder, Shrinkage Reducing Admixture, Viscosity Modifier, and Water Reducer (Plasticizer). Super plasticizers and accelerators are key growth drivers.
- Concrete Protective Coatings: Comprises Acrylic, Alkyd, Epoxy, Polyurethane, and Other Resin Types. Epoxy and polyurethane coatings dominate due to their superior protection.
- Flooring Resins: Primarily Polyaspartic, this segment is experiencing rapid growth due to its fast curing times and high durability.
- Repair and Rehabilitation Chemicals: Includes Fiber Wrapping Systems, Injection Grouting Materials, Micro-concrete Mortars, Modified Mortars, and Rebar Protectors, all crucial for extending the life of existing structures.
- Sealants: Dominated by Silicone, these are essential for weatherproofing and joint sealing applications.
- Surface Treatment Chemicals: Comprising Curing Compounds, Mold Release Agents, and Other Product Types, these are vital for optimizing concrete performance.
- Waterproofing Solutions: Primarily Membranes, this segment is critical for protecting structures from water ingress.
Key Drivers of Construction Chemicals Market in United States Growth
The US construction chemicals market is propelled by several key drivers. Sustained government investment in infrastructure projects, including roads, bridges, and public utilities, is a primary growth catalyst. The increasing adoption of sustainable building practices and a growing demand for eco-friendly construction materials, such as low-VOC products, are significantly influencing market trends. Technological advancements leading to the development of high-performance, durable, and energy-efficient construction chemicals further stimulate growth. The robust activity in residential and commercial construction, driven by population growth and urbanization, also contributes significantly to market expansion. Furthermore, the rising need for the repair and rehabilitation of aging infrastructure and buildings to extend their lifespan is creating substantial demand for specialized chemical solutions.
Challenges in the Construction Chemicals Market in United States Sector
Despite robust growth, the US construction chemicals market faces several challenges. Fluctuations in raw material prices, particularly for petrochemical derivatives, can impact profitability and pricing strategies. Stringent environmental regulations, while driving innovation, also increase compliance costs for manufacturers. The skilled labor shortage within the construction industry can affect the timely adoption and proper application of advanced chemical products. Supply chain disruptions, as experienced in recent years, can lead to delays and increased logistics costs. Moreover, the competitive pressure from both domestic and international players necessitates continuous innovation and cost optimization. The potential for product substitution in less demanding applications also poses a challenge.
Emerging Opportunities in Construction Chemicals Market in United States
Emerging opportunities in the US construction chemicals market are multifaceted. The increasing demand for high-performance and sustainable building materials presents a significant avenue for growth. Advancements in nanotechnology and self-healing materials are paving the way for next-generation construction chemicals with enhanced durability and longevity. The growing trend towards modular construction and prefabrication requires specialized adhesives and sealants with faster curing times and improved performance. Furthermore, the focus on retrofitting and upgrading existing buildings for energy efficiency and resilience opens up a substantial market for repair and rehabilitation chemicals. The development of smart construction chemicals that can monitor structural health or adapt to environmental conditions also represents a promising future opportunity.
Leading Players in the Construction Chemicals Market in United States Market
- Henkel AG & Co KGaA
- Arkema
- Saint-Gobain
- RPM International Inc.
- MBCC Group
- Dow
- H B Fuller Company
- Ardex Group
- Sika AG
- Mapei S.p.A.
Key Developments in Construction Chemicals Market in United States Industry
- May 2023: Sika, a global leader in construction chemicals, acquired the MBCC Group, including its waterproofing solutions, anchors & grouts, flooring resins, repair & rehabilitation chemicals, and other businesses, with the exception of its concrete admixture operations in Europe, North America, Australia, and New Zealand. This strategic acquisition significantly reshapes the market landscape and expands Sika's product portfolio and geographical reach.
- April 2023: Flowcrete, a subsidiary of RPM International Inc., announced that it has extended the shelf life of its epoxy flooring resin products, which can now be stored for an extra 12 months from the previously specified dates without compromising their quality or performance. This development enhances product usability and reduces waste for end-users.
- March 2023: Sika AG announced its plan to divest its MBCC admixture assets to Cinven, a global private equity firm, as part of its strategy to secure full ownership of MBCC Group. This move streamlines Sika's operations and focuses its strategy on core areas of the construction chemicals business.
Strategic Outlook for Construction Chemicals Market in United States Market
The strategic outlook for the US construction chemicals market is highly positive, driven by ongoing infrastructure investments and a growing emphasis on sustainable and high-performance building solutions. Companies that focus on innovation in eco-friendly product development, such as low-VOC adhesives and bio-based materials, will be well-positioned for growth. The increasing demand for durable and long-lasting structures will continue to fuel the market for advanced concrete admixtures, protective coatings, and repair chemicals. Strategic partnerships and potential further consolidation through mergers and acquisitions are likely to shape the competitive landscape. Embracing digital technologies for product development, supply chain management, and customer engagement will also be crucial for long-term success in this dynamic market. The market is poised for sustained expansion as the US construction sector continues to evolve towards greater efficiency, sustainability, and resilience.
Construction Chemicals Market in United States Segmentation
-
1. End Use Sector
- 1.1. Commercial
- 1.2. Industrial and Institutional
- 1.3. Infrastructure
- 1.4. Residential
-
2. Product
-
2.1. Adhesives
-
2.1.1. By Sub Product
- 2.1.1.1. Hot Melt
- 2.1.1.2. Reactive
- 2.1.1.3. Solvent-borne
- 2.1.1.4. Water-borne
-
2.1.1. By Sub Product
-
2.2. Anchors and Grouts
- 2.2.1. Cementitious Fixing
- 2.2.2. Resin Fixing
- 2.2.3. Other Types
-
2.3. Concrete Admixtures
- 2.3.1. Accelerator
- 2.3.2. Air Entraining Admixture
- 2.3.3. High Range Water Reducer (Super Plasticizer)
- 2.3.4. Retarder
- 2.3.5. Shrinkage Reducing Admixture
- 2.3.6. Viscosity Modifier
- 2.3.7. Water Reducer (Plasticizer)
-
2.4. Concrete Protective Coatings
- 2.4.1. Acrylic
- 2.4.2. Alkyd
- 2.4.3. Epoxy
- 2.4.4. Polyurethane
- 2.4.5. Other Resin Types
-
2.5. Flooring Resins
- 2.5.1. Polyaspartic
-
2.6. Repair and Rehabilitation Chemicals
- 2.6.1. Fiber Wrapping Systems
- 2.6.2. Injection Grouting Materials
- 2.6.3. Micro-concrete Mortars
- 2.6.4. Modified Mortars
- 2.6.5. Rebar Protectors
-
2.7. Sealants
- 2.7.1. Silicone
-
2.8. Surface Treatment Chemicals
- 2.8.1. Curing Compounds
- 2.8.2. Mold Release Agents
- 2.8.3. Other Product Types
-
2.9. Waterproofing Solutions
- 2.9.1. Membranes
-
2.1. Adhesives
Construction Chemicals Market in United States Segmentation By Geography
-
1. North America
- 1.1. United States
- 1.2. Canada
- 1.3. Mexico
-
2. South America
- 2.1. Brazil
- 2.2. Argentina
- 2.3. Rest of South America
-
3. Europe
- 3.1. United Kingdom
- 3.2. Germany
- 3.3. France
- 3.4. Italy
- 3.5. Spain
- 3.6. Russia
- 3.7. Benelux
- 3.8. Nordics
- 3.9. Rest of Europe
-
4. Middle East & Africa
- 4.1. Turkey
- 4.2. Israel
- 4.3. GCC
- 4.4. North Africa
- 4.5. South Africa
- 4.6. Rest of Middle East & Africa
-
5. Asia Pacific
- 5.1. China
- 5.2. India
- 5.3. Japan
- 5.4. South Korea
- 5.5. ASEAN
- 5.6. Oceania
- 5.7. Rest of Asia Pacific
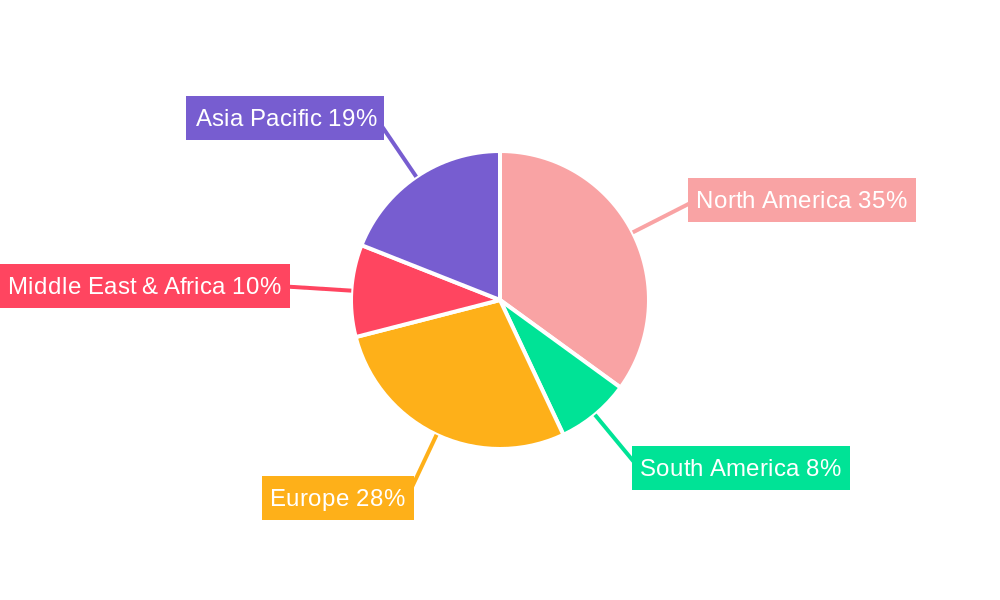
Construction Chemicals Market in United States Regional Market Share
Geographic Coverage of Construction Chemicals Market in United States
Construction Chemicals Market in United States REPORT HIGHLIGHTS
| Aspects | Details |
|---|---|
| Study Period | 2020-2034 |
| Base Year | 2025 |
| Estimated Year | 2026 |
| Forecast Period | 2026-2034 |
| Historical Period | 2020-2025 |
| Growth Rate | CAGR of 5.27% from 2020-2034 |
| Segmentation |
|
Table of Contents
- 1. Introduction
- 1.1. Research Scope
- 1.2. Market Segmentation
- 1.3. Research Objective
- 1.4. Definitions and Assumptions
- 2. Executive Summary
- 2.1. Market Snapshot
- 3. Market Dynamics
- 3.1. Market Drivers
- 3.2. Market Restrains
- 3.3. Market Trends
- 3.4. Market Opportunities
- 4. Market Factor Analysis
- 4.1. Porters Five Forces
- 4.1.1. Bargaining Power of Suppliers
- 4.1.2. Bargaining Power of Buyers
- 4.1.3. Threat of New Entrants
- 4.1.4. Threat of Substitutes
- 4.1.5. Competitive Rivalry
- 4.2. PESTEL analysis
- 4.3. BCG Analysis
- 4.3.1. Stars (High Growth, High Market Share)
- 4.3.2. Cash Cows (Low Growth, High Market Share)
- 4.3.3. Question Mark (High Growth, Low Market Share)
- 4.3.4. Dogs (Low Growth, Low Market Share)
- 4.4. Ansoff Matrix Analysis
- 4.5. Supply Chain Analysis
- 4.6. Regulatory Landscape
- 4.7. Current Market Potential and Opportunity Assessment (TAM–SAM–SOM Framework)
- 4.8. RAX Analyst Note
- 4.1. Porters Five Forces
- 5. Market Analysis, Insights and Forecast 2021-2033
- 5.1. Market Analysis, Insights and Forecast - by End Use Sector
- 5.1.1. Commercial
- 5.1.2. Industrial and Institutional
- 5.1.3. Infrastructure
- 5.1.4. Residential
- 5.2. Market Analysis, Insights and Forecast - by Product
- 5.2.1. Adhesives
- 5.2.1.1. By Sub Product
- 5.2.1.1.1. Hot Melt
- 5.2.1.1.2. Reactive
- 5.2.1.1.3. Solvent-borne
- 5.2.1.1.4. Water-borne
- 5.2.1.1. By Sub Product
- 5.2.2. Anchors and Grouts
- 5.2.2.1. Cementitious Fixing
- 5.2.2.2. Resin Fixing
- 5.2.2.3. Other Types
- 5.2.3. Concrete Admixtures
- 5.2.3.1. Accelerator
- 5.2.3.2. Air Entraining Admixture
- 5.2.3.3. High Range Water Reducer (Super Plasticizer)
- 5.2.3.4. Retarder
- 5.2.3.5. Shrinkage Reducing Admixture
- 5.2.3.6. Viscosity Modifier
- 5.2.3.7. Water Reducer (Plasticizer)
- 5.2.4. Concrete Protective Coatings
- 5.2.4.1. Acrylic
- 5.2.4.2. Alkyd
- 5.2.4.3. Epoxy
- 5.2.4.4. Polyurethane
- 5.2.4.5. Other Resin Types
- 5.2.5. Flooring Resins
- 5.2.5.1. Polyaspartic
- 5.2.6. Repair and Rehabilitation Chemicals
- 5.2.6.1. Fiber Wrapping Systems
- 5.2.6.2. Injection Grouting Materials
- 5.2.6.3. Micro-concrete Mortars
- 5.2.6.4. Modified Mortars
- 5.2.6.5. Rebar Protectors
- 5.2.7. Sealants
- 5.2.7.1. Silicone
- 5.2.8. Surface Treatment Chemicals
- 5.2.8.1. Curing Compounds
- 5.2.8.2. Mold Release Agents
- 5.2.8.3. Other Product Types
- 5.2.9. Waterproofing Solutions
- 5.2.9.1. Membranes
- 5.2.1. Adhesives
- 5.3. Market Analysis, Insights and Forecast - by Region
- 5.3.1. North America
- 5.3.2. South America
- 5.3.3. Europe
- 5.3.4. Middle East & Africa
- 5.3.5. Asia Pacific
- 5.1. Market Analysis, Insights and Forecast - by End Use Sector
- 6. Global Construction Chemicals Market in United States Analysis, Insights and Forecast, 2021-2033
- 6.1. Market Analysis, Insights and Forecast - by End Use Sector
- 6.1.1. Commercial
- 6.1.2. Industrial and Institutional
- 6.1.3. Infrastructure
- 6.1.4. Residential
- 6.2. Market Analysis, Insights and Forecast - by Product
- 6.2.1. Adhesives
- 6.2.1.1. By Sub Product
- 6.2.1.1.1. Hot Melt
- 6.2.1.1.2. Reactive
- 6.2.1.1.3. Solvent-borne
- 6.2.1.1.4. Water-borne
- 6.2.1.1. By Sub Product
- 6.2.2. Anchors and Grouts
- 6.2.2.1. Cementitious Fixing
- 6.2.2.2. Resin Fixing
- 6.2.2.3. Other Types
- 6.2.3. Concrete Admixtures
- 6.2.3.1. Accelerator
- 6.2.3.2. Air Entraining Admixture
- 6.2.3.3. High Range Water Reducer (Super Plasticizer)
- 6.2.3.4. Retarder
- 6.2.3.5. Shrinkage Reducing Admixture
- 6.2.3.6. Viscosity Modifier
- 6.2.3.7. Water Reducer (Plasticizer)
- 6.2.4. Concrete Protective Coatings
- 6.2.4.1. Acrylic
- 6.2.4.2. Alkyd
- 6.2.4.3. Epoxy
- 6.2.4.4. Polyurethane
- 6.2.4.5. Other Resin Types
- 6.2.5. Flooring Resins
- 6.2.5.1. Polyaspartic
- 6.2.6. Repair and Rehabilitation Chemicals
- 6.2.6.1. Fiber Wrapping Systems
- 6.2.6.2. Injection Grouting Materials
- 6.2.6.3. Micro-concrete Mortars
- 6.2.6.4. Modified Mortars
- 6.2.6.5. Rebar Protectors
- 6.2.7. Sealants
- 6.2.7.1. Silicone
- 6.2.8. Surface Treatment Chemicals
- 6.2.8.1. Curing Compounds
- 6.2.8.2. Mold Release Agents
- 6.2.8.3. Other Product Types
- 6.2.9. Waterproofing Solutions
- 6.2.9.1. Membranes
- 6.2.1. Adhesives
- 6.1. Market Analysis, Insights and Forecast - by End Use Sector
- 7. North America Construction Chemicals Market in United States Analysis, Insights and Forecast, 2020-2032
- 7.1. Market Analysis, Insights and Forecast - by End Use Sector
- 7.1.1. Commercial
- 7.1.2. Industrial and Institutional
- 7.1.3. Infrastructure
- 7.1.4. Residential
- 7.2. Market Analysis, Insights and Forecast - by Product
- 7.2.1. Adhesives
- 7.2.1.1. By Sub Product
- 7.2.1.1.1. Hot Melt
- 7.2.1.1.2. Reactive
- 7.2.1.1.3. Solvent-borne
- 7.2.1.1.4. Water-borne
- 7.2.1.1. By Sub Product
- 7.2.2. Anchors and Grouts
- 7.2.2.1. Cementitious Fixing
- 7.2.2.2. Resin Fixing
- 7.2.2.3. Other Types
- 7.2.3. Concrete Admixtures
- 7.2.3.1. Accelerator
- 7.2.3.2. Air Entraining Admixture
- 7.2.3.3. High Range Water Reducer (Super Plasticizer)
- 7.2.3.4. Retarder
- 7.2.3.5. Shrinkage Reducing Admixture
- 7.2.3.6. Viscosity Modifier
- 7.2.3.7. Water Reducer (Plasticizer)
- 7.2.4. Concrete Protective Coatings
- 7.2.4.1. Acrylic
- 7.2.4.2. Alkyd
- 7.2.4.3. Epoxy
- 7.2.4.4. Polyurethane
- 7.2.4.5. Other Resin Types
- 7.2.5. Flooring Resins
- 7.2.5.1. Polyaspartic
- 7.2.6. Repair and Rehabilitation Chemicals
- 7.2.6.1. Fiber Wrapping Systems
- 7.2.6.2. Injection Grouting Materials
- 7.2.6.3. Micro-concrete Mortars
- 7.2.6.4. Modified Mortars
- 7.2.6.5. Rebar Protectors
- 7.2.7. Sealants
- 7.2.7.1. Silicone
- 7.2.8. Surface Treatment Chemicals
- 7.2.8.1. Curing Compounds
- 7.2.8.2. Mold Release Agents
- 7.2.8.3. Other Product Types
- 7.2.9. Waterproofing Solutions
- 7.2.9.1. Membranes
- 7.2.1. Adhesives
- 7.1. Market Analysis, Insights and Forecast - by End Use Sector
- 8. South America Construction Chemicals Market in United States Analysis, Insights and Forecast, 2020-2032
- 8.1. Market Analysis, Insights and Forecast - by End Use Sector
- 8.1.1. Commercial
- 8.1.2. Industrial and Institutional
- 8.1.3. Infrastructure
- 8.1.4. Residential
- 8.2. Market Analysis, Insights and Forecast - by Product
- 8.2.1. Adhesives
- 8.2.1.1. By Sub Product
- 8.2.1.1.1. Hot Melt
- 8.2.1.1.2. Reactive
- 8.2.1.1.3. Solvent-borne
- 8.2.1.1.4. Water-borne
- 8.2.1.1. By Sub Product
- 8.2.2. Anchors and Grouts
- 8.2.2.1. Cementitious Fixing
- 8.2.2.2. Resin Fixing
- 8.2.2.3. Other Types
- 8.2.3. Concrete Admixtures
- 8.2.3.1. Accelerator
- 8.2.3.2. Air Entraining Admixture
- 8.2.3.3. High Range Water Reducer (Super Plasticizer)
- 8.2.3.4. Retarder
- 8.2.3.5. Shrinkage Reducing Admixture
- 8.2.3.6. Viscosity Modifier
- 8.2.3.7. Water Reducer (Plasticizer)
- 8.2.4. Concrete Protective Coatings
- 8.2.4.1. Acrylic
- 8.2.4.2. Alkyd
- 8.2.4.3. Epoxy
- 8.2.4.4. Polyurethane
- 8.2.4.5. Other Resin Types
- 8.2.5. Flooring Resins
- 8.2.5.1. Polyaspartic
- 8.2.6. Repair and Rehabilitation Chemicals
- 8.2.6.1. Fiber Wrapping Systems
- 8.2.6.2. Injection Grouting Materials
- 8.2.6.3. Micro-concrete Mortars
- 8.2.6.4. Modified Mortars
- 8.2.6.5. Rebar Protectors
- 8.2.7. Sealants
- 8.2.7.1. Silicone
- 8.2.8. Surface Treatment Chemicals
- 8.2.8.1. Curing Compounds
- 8.2.8.2. Mold Release Agents
- 8.2.8.3. Other Product Types
- 8.2.9. Waterproofing Solutions
- 8.2.9.1. Membranes
- 8.2.1. Adhesives
- 8.1. Market Analysis, Insights and Forecast - by End Use Sector
- 9. Europe Construction Chemicals Market in United States Analysis, Insights and Forecast, 2020-2032
- 9.1. Market Analysis, Insights and Forecast - by End Use Sector
- 9.1.1. Commercial
- 9.1.2. Industrial and Institutional
- 9.1.3. Infrastructure
- 9.1.4. Residential
- 9.2. Market Analysis, Insights and Forecast - by Product
- 9.2.1. Adhesives
- 9.2.1.1. By Sub Product
- 9.2.1.1.1. Hot Melt
- 9.2.1.1.2. Reactive
- 9.2.1.1.3. Solvent-borne
- 9.2.1.1.4. Water-borne
- 9.2.1.1. By Sub Product
- 9.2.2. Anchors and Grouts
- 9.2.2.1. Cementitious Fixing
- 9.2.2.2. Resin Fixing
- 9.2.2.3. Other Types
- 9.2.3. Concrete Admixtures
- 9.2.3.1. Accelerator
- 9.2.3.2. Air Entraining Admixture
- 9.2.3.3. High Range Water Reducer (Super Plasticizer)
- 9.2.3.4. Retarder
- 9.2.3.5. Shrinkage Reducing Admixture
- 9.2.3.6. Viscosity Modifier
- 9.2.3.7. Water Reducer (Plasticizer)
- 9.2.4. Concrete Protective Coatings
- 9.2.4.1. Acrylic
- 9.2.4.2. Alkyd
- 9.2.4.3. Epoxy
- 9.2.4.4. Polyurethane
- 9.2.4.5. Other Resin Types
- 9.2.5. Flooring Resins
- 9.2.5.1. Polyaspartic
- 9.2.6. Repair and Rehabilitation Chemicals
- 9.2.6.1. Fiber Wrapping Systems
- 9.2.6.2. Injection Grouting Materials
- 9.2.6.3. Micro-concrete Mortars
- 9.2.6.4. Modified Mortars
- 9.2.6.5. Rebar Protectors
- 9.2.7. Sealants
- 9.2.7.1. Silicone
- 9.2.8. Surface Treatment Chemicals
- 9.2.8.1. Curing Compounds
- 9.2.8.2. Mold Release Agents
- 9.2.8.3. Other Product Types
- 9.2.9. Waterproofing Solutions
- 9.2.9.1. Membranes
- 9.2.1. Adhesives
- 9.1. Market Analysis, Insights and Forecast - by End Use Sector
- 10. Middle East & Africa Construction Chemicals Market in United States Analysis, Insights and Forecast, 2020-2032
- 10.1. Market Analysis, Insights and Forecast - by End Use Sector
- 10.1.1. Commercial
- 10.1.2. Industrial and Institutional
- 10.1.3. Infrastructure
- 10.1.4. Residential
- 10.2. Market Analysis, Insights and Forecast - by Product
- 10.2.1. Adhesives
- 10.2.1.1. By Sub Product
- 10.2.1.1.1. Hot Melt
- 10.2.1.1.2. Reactive
- 10.2.1.1.3. Solvent-borne
- 10.2.1.1.4. Water-borne
- 10.2.1.1. By Sub Product
- 10.2.2. Anchors and Grouts
- 10.2.2.1. Cementitious Fixing
- 10.2.2.2. Resin Fixing
- 10.2.2.3. Other Types
- 10.2.3. Concrete Admixtures
- 10.2.3.1. Accelerator
- 10.2.3.2. Air Entraining Admixture
- 10.2.3.3. High Range Water Reducer (Super Plasticizer)
- 10.2.3.4. Retarder
- 10.2.3.5. Shrinkage Reducing Admixture
- 10.2.3.6. Viscosity Modifier
- 10.2.3.7. Water Reducer (Plasticizer)
- 10.2.4. Concrete Protective Coatings
- 10.2.4.1. Acrylic
- 10.2.4.2. Alkyd
- 10.2.4.3. Epoxy
- 10.2.4.4. Polyurethane
- 10.2.4.5. Other Resin Types
- 10.2.5. Flooring Resins
- 10.2.5.1. Polyaspartic
- 10.2.6. Repair and Rehabilitation Chemicals
- 10.2.6.1. Fiber Wrapping Systems
- 10.2.6.2. Injection Grouting Materials
- 10.2.6.3. Micro-concrete Mortars
- 10.2.6.4. Modified Mortars
- 10.2.6.5. Rebar Protectors
- 10.2.7. Sealants
- 10.2.7.1. Silicone
- 10.2.8. Surface Treatment Chemicals
- 10.2.8.1. Curing Compounds
- 10.2.8.2. Mold Release Agents
- 10.2.8.3. Other Product Types
- 10.2.9. Waterproofing Solutions
- 10.2.9.1. Membranes
- 10.2.1. Adhesives
- 10.1. Market Analysis, Insights and Forecast - by End Use Sector
- 11. Asia Pacific Construction Chemicals Market in United States Analysis, Insights and Forecast, 2020-2032
- 11.1. Market Analysis, Insights and Forecast - by End Use Sector
- 11.1.1. Commercial
- 11.1.2. Industrial and Institutional
- 11.1.3. Infrastructure
- 11.1.4. Residential
- 11.2. Market Analysis, Insights and Forecast - by Product
- 11.2.1. Adhesives
- 11.2.1.1. By Sub Product
- 11.2.1.1.1. Hot Melt
- 11.2.1.1.2. Reactive
- 11.2.1.1.3. Solvent-borne
- 11.2.1.1.4. Water-borne
- 11.2.1.1. By Sub Product
- 11.2.2. Anchors and Grouts
- 11.2.2.1. Cementitious Fixing
- 11.2.2.2. Resin Fixing
- 11.2.2.3. Other Types
- 11.2.3. Concrete Admixtures
- 11.2.3.1. Accelerator
- 11.2.3.2. Air Entraining Admixture
- 11.2.3.3. High Range Water Reducer (Super Plasticizer)
- 11.2.3.4. Retarder
- 11.2.3.5. Shrinkage Reducing Admixture
- 11.2.3.6. Viscosity Modifier
- 11.2.3.7. Water Reducer (Plasticizer)
- 11.2.4. Concrete Protective Coatings
- 11.2.4.1. Acrylic
- 11.2.4.2. Alkyd
- 11.2.4.3. Epoxy
- 11.2.4.4. Polyurethane
- 11.2.4.5. Other Resin Types
- 11.2.5. Flooring Resins
- 11.2.5.1. Polyaspartic
- 11.2.6. Repair and Rehabilitation Chemicals
- 11.2.6.1. Fiber Wrapping Systems
- 11.2.6.2. Injection Grouting Materials
- 11.2.6.3. Micro-concrete Mortars
- 11.2.6.4. Modified Mortars
- 11.2.6.5. Rebar Protectors
- 11.2.7. Sealants
- 11.2.7.1. Silicone
- 11.2.8. Surface Treatment Chemicals
- 11.2.8.1. Curing Compounds
- 11.2.8.2. Mold Release Agents
- 11.2.8.3. Other Product Types
- 11.2.9. Waterproofing Solutions
- 11.2.9.1. Membranes
- 11.2.1. Adhesives
- 11.1. Market Analysis, Insights and Forecast - by End Use Sector
- 12. Competitive Analysis
- 12.1. Company Profiles
- 12.1.1 Henkel AG & Co KGaA
- 12.1.1.1. Company Overview
- 12.1.1.2. Products
- 12.1.1.3. Company Financials
- 12.1.1.4. SWOT Analysis
- 12.1.2 Arkema
- 12.1.2.1. Company Overview
- 12.1.2.2. Products
- 12.1.2.3. Company Financials
- 12.1.2.4. SWOT Analysis
- 12.1.3 Saint-Gobain
- 12.1.3.1. Company Overview
- 12.1.3.2. Products
- 12.1.3.3. Company Financials
- 12.1.3.4. SWOT Analysis
- 12.1.4 RPM International Inc
- 12.1.4.1. Company Overview
- 12.1.4.2. Products
- 12.1.4.3. Company Financials
- 12.1.4.4. SWOT Analysis
- 12.1.5 MBCC Group
- 12.1.5.1. Company Overview
- 12.1.5.2. Products
- 12.1.5.3. Company Financials
- 12.1.5.4. SWOT Analysis
- 12.1.6 Dow
- 12.1.6.1. Company Overview
- 12.1.6.2. Products
- 12.1.6.3. Company Financials
- 12.1.6.4. SWOT Analysis
- 12.1.7 H B Fuller Company
- 12.1.7.1. Company Overview
- 12.1.7.2. Products
- 12.1.7.3. Company Financials
- 12.1.7.4. SWOT Analysis
- 12.1.8 Ardex Group
- 12.1.8.1. Company Overview
- 12.1.8.2. Products
- 12.1.8.3. Company Financials
- 12.1.8.4. SWOT Analysis
- 12.1.9 Sika A
- 12.1.9.1. Company Overview
- 12.1.9.2. Products
- 12.1.9.3. Company Financials
- 12.1.9.4. SWOT Analysis
- 12.1.10 MAPEI S p A
- 12.1.10.1. Company Overview
- 12.1.10.2. Products
- 12.1.10.3. Company Financials
- 12.1.10.4. SWOT Analysis
- 12.1.1 Henkel AG & Co KGaA
- 12.2. Market Entropy
- 12.2.1 Company's Key Areas Served
- 12.2.2 Recent Developments
- 12.3. Company Market Share Analysis 2025
- 12.3.1 Top 5 Companies Market Share Analysis
- 12.3.2 Top 3 Companies Market Share Analysis
- 12.4. List of Potential Customers
- 13. Research Methodology
List of Figures
- Figure 1: Global Construction Chemicals Market in United States Revenue Breakdown (million, %) by Region 2025 & 2033
- Figure 2: Global Construction Chemicals Market in United States Volume Breakdown (K Tons, %) by Region 2025 & 2033
- Figure 3: North America Construction Chemicals Market in United States Revenue (million), by End Use Sector 2025 & 2033
- Figure 4: North America Construction Chemicals Market in United States Volume (K Tons), by End Use Sector 2025 & 2033
- Figure 5: North America Construction Chemicals Market in United States Revenue Share (%), by End Use Sector 2025 & 2033
- Figure 6: North America Construction Chemicals Market in United States Volume Share (%), by End Use Sector 2025 & 2033
- Figure 7: North America Construction Chemicals Market in United States Revenue (million), by Product 2025 & 2033
- Figure 8: North America Construction Chemicals Market in United States Volume (K Tons), by Product 2025 & 2033
- Figure 9: North America Construction Chemicals Market in United States Revenue Share (%), by Product 2025 & 2033
- Figure 10: North America Construction Chemicals Market in United States Volume Share (%), by Product 2025 & 2033
- Figure 11: North America Construction Chemicals Market in United States Revenue (million), by Country 2025 & 2033
- Figure 12: North America Construction Chemicals Market in United States Volume (K Tons), by Country 2025 & 2033
- Figure 13: North America Construction Chemicals Market in United States Revenue Share (%), by Country 2025 & 2033
- Figure 14: North America Construction Chemicals Market in United States Volume Share (%), by Country 2025 & 2033
- Figure 15: South America Construction Chemicals Market in United States Revenue (million), by End Use Sector 2025 & 2033
- Figure 16: South America Construction Chemicals Market in United States Volume (K Tons), by End Use Sector 2025 & 2033
- Figure 17: South America Construction Chemicals Market in United States Revenue Share (%), by End Use Sector 2025 & 2033
- Figure 18: South America Construction Chemicals Market in United States Volume Share (%), by End Use Sector 2025 & 2033
- Figure 19: South America Construction Chemicals Market in United States Revenue (million), by Product 2025 & 2033
- Figure 20: South America Construction Chemicals Market in United States Volume (K Tons), by Product 2025 & 2033
- Figure 21: South America Construction Chemicals Market in United States Revenue Share (%), by Product 2025 & 2033
- Figure 22: South America Construction Chemicals Market in United States Volume Share (%), by Product 2025 & 2033
- Figure 23: South America Construction Chemicals Market in United States Revenue (million), by Country 2025 & 2033
- Figure 24: South America Construction Chemicals Market in United States Volume (K Tons), by Country 2025 & 2033
- Figure 25: South America Construction Chemicals Market in United States Revenue Share (%), by Country 2025 & 2033
- Figure 26: South America Construction Chemicals Market in United States Volume Share (%), by Country 2025 & 2033
- Figure 27: Europe Construction Chemicals Market in United States Revenue (million), by End Use Sector 2025 & 2033
- Figure 28: Europe Construction Chemicals Market in United States Volume (K Tons), by End Use Sector 2025 & 2033
- Figure 29: Europe Construction Chemicals Market in United States Revenue Share (%), by End Use Sector 2025 & 2033
- Figure 30: Europe Construction Chemicals Market in United States Volume Share (%), by End Use Sector 2025 & 2033
- Figure 31: Europe Construction Chemicals Market in United States Revenue (million), by Product 2025 & 2033
- Figure 32: Europe Construction Chemicals Market in United States Volume (K Tons), by Product 2025 & 2033
- Figure 33: Europe Construction Chemicals Market in United States Revenue Share (%), by Product 2025 & 2033
- Figure 34: Europe Construction Chemicals Market in United States Volume Share (%), by Product 2025 & 2033
- Figure 35: Europe Construction Chemicals Market in United States Revenue (million), by Country 2025 & 2033
- Figure 36: Europe Construction Chemicals Market in United States Volume (K Tons), by Country 2025 & 2033
- Figure 37: Europe Construction Chemicals Market in United States Revenue Share (%), by Country 2025 & 2033
- Figure 38: Europe Construction Chemicals Market in United States Volume Share (%), by Country 2025 & 2033
- Figure 39: Middle East & Africa Construction Chemicals Market in United States Revenue (million), by End Use Sector 2025 & 2033
- Figure 40: Middle East & Africa Construction Chemicals Market in United States Volume (K Tons), by End Use Sector 2025 & 2033
- Figure 41: Middle East & Africa Construction Chemicals Market in United States Revenue Share (%), by End Use Sector 2025 & 2033
- Figure 42: Middle East & Africa Construction Chemicals Market in United States Volume Share (%), by End Use Sector 2025 & 2033
- Figure 43: Middle East & Africa Construction Chemicals Market in United States Revenue (million), by Product 2025 & 2033
- Figure 44: Middle East & Africa Construction Chemicals Market in United States Volume (K Tons), by Product 2025 & 2033
- Figure 45: Middle East & Africa Construction Chemicals Market in United States Revenue Share (%), by Product 2025 & 2033
- Figure 46: Middle East & Africa Construction Chemicals Market in United States Volume Share (%), by Product 2025 & 2033
- Figure 47: Middle East & Africa Construction Chemicals Market in United States Revenue (million), by Country 2025 & 2033
- Figure 48: Middle East & Africa Construction Chemicals Market in United States Volume (K Tons), by Country 2025 & 2033
- Figure 49: Middle East & Africa Construction Chemicals Market in United States Revenue Share (%), by Country 2025 & 2033
- Figure 50: Middle East & Africa Construction Chemicals Market in United States Volume Share (%), by Country 2025 & 2033
- Figure 51: Asia Pacific Construction Chemicals Market in United States Revenue (million), by End Use Sector 2025 & 2033
- Figure 52: Asia Pacific Construction Chemicals Market in United States Volume (K Tons), by End Use Sector 2025 & 2033
- Figure 53: Asia Pacific Construction Chemicals Market in United States Revenue Share (%), by End Use Sector 2025 & 2033
- Figure 54: Asia Pacific Construction Chemicals Market in United States Volume Share (%), by End Use Sector 2025 & 2033
- Figure 55: Asia Pacific Construction Chemicals Market in United States Revenue (million), by Product 2025 & 2033
- Figure 56: Asia Pacific Construction Chemicals Market in United States Volume (K Tons), by Product 2025 & 2033
- Figure 57: Asia Pacific Construction Chemicals Market in United States Revenue Share (%), by Product 2025 & 2033
- Figure 58: Asia Pacific Construction Chemicals Market in United States Volume Share (%), by Product 2025 & 2033
- Figure 59: Asia Pacific Construction Chemicals Market in United States Revenue (million), by Country 2025 & 2033
- Figure 60: Asia Pacific Construction Chemicals Market in United States Volume (K Tons), by Country 2025 & 2033
- Figure 61: Asia Pacific Construction Chemicals Market in United States Revenue Share (%), by Country 2025 & 2033
- Figure 62: Asia Pacific Construction Chemicals Market in United States Volume Share (%), by Country 2025 & 2033
List of Tables
- Table 1: Global Construction Chemicals Market in United States Revenue million Forecast, by End Use Sector 2020 & 2033
- Table 2: Global Construction Chemicals Market in United States Volume K Tons Forecast, by End Use Sector 2020 & 2033
- Table 3: Global Construction Chemicals Market in United States Revenue million Forecast, by Product 2020 & 2033
- Table 4: Global Construction Chemicals Market in United States Volume K Tons Forecast, by Product 2020 & 2033
- Table 5: Global Construction Chemicals Market in United States Revenue million Forecast, by Region 2020 & 2033
- Table 6: Global Construction Chemicals Market in United States Volume K Tons Forecast, by Region 2020 & 2033
- Table 7: Global Construction Chemicals Market in United States Revenue million Forecast, by End Use Sector 2020 & 2033
- Table 8: Global Construction Chemicals Market in United States Volume K Tons Forecast, by End Use Sector 2020 & 2033
- Table 9: Global Construction Chemicals Market in United States Revenue million Forecast, by Product 2020 & 2033
- Table 10: Global Construction Chemicals Market in United States Volume K Tons Forecast, by Product 2020 & 2033
- Table 11: Global Construction Chemicals Market in United States Revenue million Forecast, by Country 2020 & 2033
- Table 12: Global Construction Chemicals Market in United States Volume K Tons Forecast, by Country 2020 & 2033
- Table 13: United States Construction Chemicals Market in United States Revenue (million) Forecast, by Application 2020 & 2033
- Table 14: United States Construction Chemicals Market in United States Volume (K Tons) Forecast, by Application 2020 & 2033
- Table 15: Canada Construction Chemicals Market in United States Revenue (million) Forecast, by Application 2020 & 2033
- Table 16: Canada Construction Chemicals Market in United States Volume (K Tons) Forecast, by Application 2020 & 2033
- Table 17: Mexico Construction Chemicals Market in United States Revenue (million) Forecast, by Application 2020 & 2033
- Table 18: Mexico Construction Chemicals Market in United States Volume (K Tons) Forecast, by Application 2020 & 2033
- Table 19: Global Construction Chemicals Market in United States Revenue million Forecast, by End Use Sector 2020 & 2033
- Table 20: Global Construction Chemicals Market in United States Volume K Tons Forecast, by End Use Sector 2020 & 2033
- Table 21: Global Construction Chemicals Market in United States Revenue million Forecast, by Product 2020 & 2033
- Table 22: Global Construction Chemicals Market in United States Volume K Tons Forecast, by Product 2020 & 2033
- Table 23: Global Construction Chemicals Market in United States Revenue million Forecast, by Country 2020 & 2033
- Table 24: Global Construction Chemicals Market in United States Volume K Tons Forecast, by Country 2020 & 2033
- Table 25: Brazil Construction Chemicals Market in United States Revenue (million) Forecast, by Application 2020 & 2033
- Table 26: Brazil Construction Chemicals Market in United States Volume (K Tons) Forecast, by Application 2020 & 2033
- Table 27: Argentina Construction Chemicals Market in United States Revenue (million) Forecast, by Application 2020 & 2033
- Table 28: Argentina Construction Chemicals Market in United States Volume (K Tons) Forecast, by Application 2020 & 2033
- Table 29: Rest of South America Construction Chemicals Market in United States Revenue (million) Forecast, by Application 2020 & 2033
- Table 30: Rest of South America Construction Chemicals Market in United States Volume (K Tons) Forecast, by Application 2020 & 2033
- Table 31: Global Construction Chemicals Market in United States Revenue million Forecast, by End Use Sector 2020 & 2033
- Table 32: Global Construction Chemicals Market in United States Volume K Tons Forecast, by End Use Sector 2020 & 2033
- Table 33: Global Construction Chemicals Market in United States Revenue million Forecast, by Product 2020 & 2033
- Table 34: Global Construction Chemicals Market in United States Volume K Tons Forecast, by Product 2020 & 2033
- Table 35: Global Construction Chemicals Market in United States Revenue million Forecast, by Country 2020 & 2033
- Table 36: Global Construction Chemicals Market in United States Volume K Tons Forecast, by Country 2020 & 2033
- Table 37: United Kingdom Construction Chemicals Market in United States Revenue (million) Forecast, by Application 2020 & 2033
- Table 38: United Kingdom Construction Chemicals Market in United States Volume (K Tons) Forecast, by Application 2020 & 2033
- Table 39: Germany Construction Chemicals Market in United States Revenue (million) Forecast, by Application 2020 & 2033
- Table 40: Germany Construction Chemicals Market in United States Volume (K Tons) Forecast, by Application 2020 & 2033
- Table 41: France Construction Chemicals Market in United States Revenue (million) Forecast, by Application 2020 & 2033
- Table 42: France Construction Chemicals Market in United States Volume (K Tons) Forecast, by Application 2020 & 2033
- Table 43: Italy Construction Chemicals Market in United States Revenue (million) Forecast, by Application 2020 & 2033
- Table 44: Italy Construction Chemicals Market in United States Volume (K Tons) Forecast, by Application 2020 & 2033
- Table 45: Spain Construction Chemicals Market in United States Revenue (million) Forecast, by Application 2020 & 2033
- Table 46: Spain Construction Chemicals Market in United States Volume (K Tons) Forecast, by Application 2020 & 2033
- Table 47: Russia Construction Chemicals Market in United States Revenue (million) Forecast, by Application 2020 & 2033
- Table 48: Russia Construction Chemicals Market in United States Volume (K Tons) Forecast, by Application 2020 & 2033
- Table 49: Benelux Construction Chemicals Market in United States Revenue (million) Forecast, by Application 2020 & 2033
- Table 50: Benelux Construction Chemicals Market in United States Volume (K Tons) Forecast, by Application 2020 & 2033
- Table 51: Nordics Construction Chemicals Market in United States Revenue (million) Forecast, by Application 2020 & 2033
- Table 52: Nordics Construction Chemicals Market in United States Volume (K Tons) Forecast, by Application 2020 & 2033
- Table 53: Rest of Europe Construction Chemicals Market in United States Revenue (million) Forecast, by Application 2020 & 2033
- Table 54: Rest of Europe Construction Chemicals Market in United States Volume (K Tons) Forecast, by Application 2020 & 2033
- Table 55: Global Construction Chemicals Market in United States Revenue million Forecast, by End Use Sector 2020 & 2033
- Table 56: Global Construction Chemicals Market in United States Volume K Tons Forecast, by End Use Sector 2020 & 2033
- Table 57: Global Construction Chemicals Market in United States Revenue million Forecast, by Product 2020 & 2033
- Table 58: Global Construction Chemicals Market in United States Volume K Tons Forecast, by Product 2020 & 2033
- Table 59: Global Construction Chemicals Market in United States Revenue million Forecast, by Country 2020 & 2033
- Table 60: Global Construction Chemicals Market in United States Volume K Tons Forecast, by Country 2020 & 2033
- Table 61: Turkey Construction Chemicals Market in United States Revenue (million) Forecast, by Application 2020 & 2033
- Table 62: Turkey Construction Chemicals Market in United States Volume (K Tons) Forecast, by Application 2020 & 2033
- Table 63: Israel Construction Chemicals Market in United States Revenue (million) Forecast, by Application 2020 & 2033
- Table 64: Israel Construction Chemicals Market in United States Volume (K Tons) Forecast, by Application 2020 & 2033
- Table 65: GCC Construction Chemicals Market in United States Revenue (million) Forecast, by Application 2020 & 2033
- Table 66: GCC Construction Chemicals Market in United States Volume (K Tons) Forecast, by Application 2020 & 2033
- Table 67: North Africa Construction Chemicals Market in United States Revenue (million) Forecast, by Application 2020 & 2033
- Table 68: North Africa Construction Chemicals Market in United States Volume (K Tons) Forecast, by Application 2020 & 2033
- Table 69: South Africa Construction Chemicals Market in United States Revenue (million) Forecast, by Application 2020 & 2033
- Table 70: South Africa Construction Chemicals Market in United States Volume (K Tons) Forecast, by Application 2020 & 2033
- Table 71: Rest of Middle East & Africa Construction Chemicals Market in United States Revenue (million) Forecast, by Application 2020 & 2033
- Table 72: Rest of Middle East & Africa Construction Chemicals Market in United States Volume (K Tons) Forecast, by Application 2020 & 2033
- Table 73: Global Construction Chemicals Market in United States Revenue million Forecast, by End Use Sector 2020 & 2033
- Table 74: Global Construction Chemicals Market in United States Volume K Tons Forecast, by End Use Sector 2020 & 2033
- Table 75: Global Construction Chemicals Market in United States Revenue million Forecast, by Product 2020 & 2033
- Table 76: Global Construction Chemicals Market in United States Volume K Tons Forecast, by Product 2020 & 2033
- Table 77: Global Construction Chemicals Market in United States Revenue million Forecast, by Country 2020 & 2033
- Table 78: Global Construction Chemicals Market in United States Volume K Tons Forecast, by Country 2020 & 2033
- Table 79: China Construction Chemicals Market in United States Revenue (million) Forecast, by Application 2020 & 2033
- Table 80: China Construction Chemicals Market in United States Volume (K Tons) Forecast, by Application 2020 & 2033
- Table 81: India Construction Chemicals Market in United States Revenue (million) Forecast, by Application 2020 & 2033
- Table 82: India Construction Chemicals Market in United States Volume (K Tons) Forecast, by Application 2020 & 2033
- Table 83: Japan Construction Chemicals Market in United States Revenue (million) Forecast, by Application 2020 & 2033
- Table 84: Japan Construction Chemicals Market in United States Volume (K Tons) Forecast, by Application 2020 & 2033
- Table 85: South Korea Construction Chemicals Market in United States Revenue (million) Forecast, by Application 2020 & 2033
- Table 86: South Korea Construction Chemicals Market in United States Volume (K Tons) Forecast, by Application 2020 & 2033
- Table 87: ASEAN Construction Chemicals Market in United States Revenue (million) Forecast, by Application 2020 & 2033
- Table 88: ASEAN Construction Chemicals Market in United States Volume (K Tons) Forecast, by Application 2020 & 2033
- Table 89: Oceania Construction Chemicals Market in United States Revenue (million) Forecast, by Application 2020 & 2033
- Table 90: Oceania Construction Chemicals Market in United States Volume (K Tons) Forecast, by Application 2020 & 2033
- Table 91: Rest of Asia Pacific Construction Chemicals Market in United States Revenue (million) Forecast, by Application 2020 & 2033
- Table 92: Rest of Asia Pacific Construction Chemicals Market in United States Volume (K Tons) Forecast, by Application 2020 & 2033
Frequently Asked Questions
1. What is the projected Compound Annual Growth Rate (CAGR) of the Construction Chemicals Market in United States?
The projected CAGR is approximately 5.27%.
2. Which companies are prominent players in the Construction Chemicals Market in United States?
Key companies in the market include Henkel AG & Co KGaA, Arkema, Saint-Gobain, RPM International Inc, MBCC Group, Dow, H B Fuller Company, Ardex Group, Sika A, MAPEI S p A.
3. What are the main segments of the Construction Chemicals Market in United States?
The market segments include End Use Sector, Product.
4. Can you provide details about the market size?
The market size is estimated to be USD 11411.4 million as of 2022.
5. What are some drivers contributing to market growth?
Growing Consumption for Polyethylene Terephthalate in the Packaging Sector; Significant Demand of Polyester Fibers from the Textile Sector in Asia Pacific.
6. What are the notable trends driving market growth?
OTHER KEY INDUSTRY TRENDS COVERED IN THE REPORT.
7. Are there any restraints impacting market growth?
Toxic Effects of Terephthalic Acid.
8. Can you provide examples of recent developments in the market?
May 2023: Sika, a global leader in construction chemicals, acquired the MBCC Group, including its waterproofing solutions, anchors & grouts, flooring resins, repair & rehabilitation chemicals, and other businesses, with the exception of its concrete admixture operations in Europe, North America, Australia, and New Zealand.April 2023: Flowcrete, a subsidiary of RPM International Inc., announced that it has extended the shelf life of its epoxy flooring resin products, which can now be stored for an extra 12 months from the previously specified dates without compromising their quality or performance.March 2023: Sika AG announced its plan to divest its MBCC admixture assets to Cinven, a global private equity firm, as part of its strategy to secure full ownership of MBCC Group.
9. What pricing options are available for accessing the report?
Pricing options include single-user, multi-user, and enterprise licenses priced at USD 3800, USD 4500, and USD 5800 respectively.
10. Is the market size provided in terms of value or volume?
The market size is provided in terms of value, measured in million and volume, measured in K Tons.
11. Are there any specific market keywords associated with the report?
Yes, the market keyword associated with the report is "Construction Chemicals Market in United States," which aids in identifying and referencing the specific market segment covered.
12. How do I determine which pricing option suits my needs best?
The pricing options vary based on user requirements and access needs. Individual users may opt for single-user licenses, while businesses requiring broader access may choose multi-user or enterprise licenses for cost-effective access to the report.
13. Are there any additional resources or data provided in the Construction Chemicals Market in United States report?
While the report offers comprehensive insights, it's advisable to review the specific contents or supplementary materials provided to ascertain if additional resources or data are available.
14. How can I stay updated on further developments or reports in the Construction Chemicals Market in United States?
To stay informed about further developments, trends, and reports in the Construction Chemicals Market in United States, consider subscribing to industry newsletters, following relevant companies and organizations, or regularly checking reputable industry news sources and publications.
Methodology
Step 1 - Identification of Relevant Samples Size from Population Database


Step 2 - Approaches for Defining Global Market Size (Value, Volume* & Price*)

Note*: In applicable scenarios
Step 3 - Data Sources
Primary Research
- Web Analytics
- Survey Reports
- Research Institute
- Latest Research Reports
- Opinion Leaders
Secondary Research
- Annual Reports
- White Paper
- Latest Press Release
- Industry Association
- Paid Database
- Investor Presentations

Step 4 - Data Triangulation
Involves using different sources of information in order to increase the validity of a study
These sources are likely to be stakeholders in a program - participants, other researchers, program staff, other community members, and so on.
Then we put all data in single framework & apply various statistical tools to find out the dynamic on the market.
During the analysis stage, feedback from the stakeholder groups would be compared to determine areas of agreement as well as areas of divergence