

Key Insights
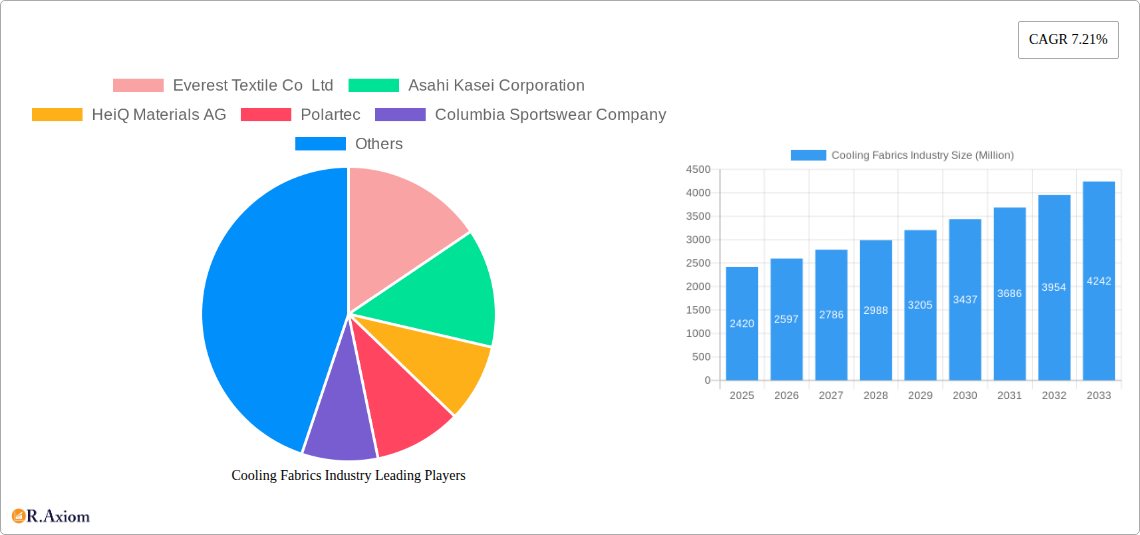
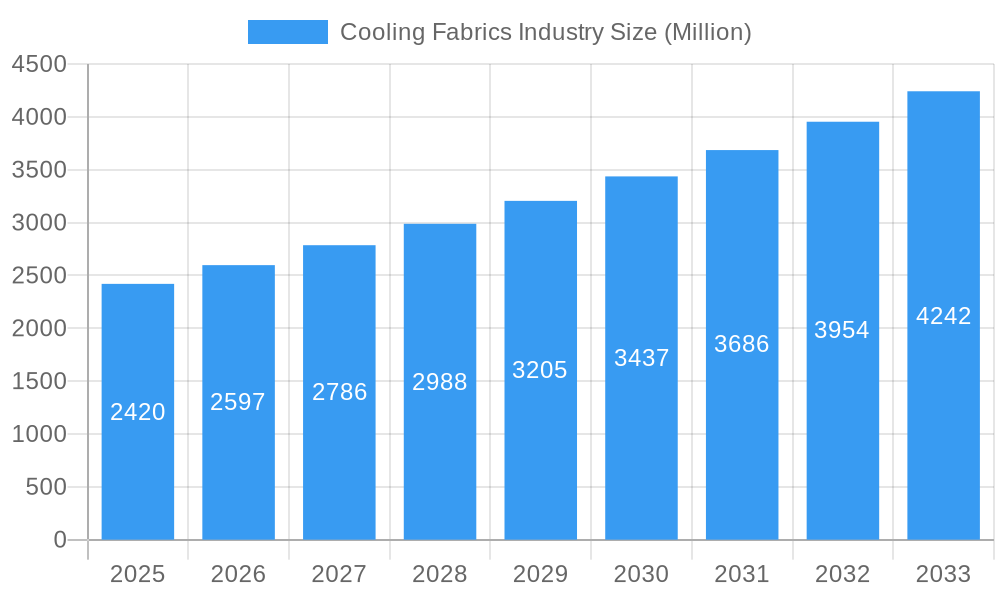
The global Cooling Fabrics market is poised for significant expansion, projected to reach an estimated USD 2.42 billion in 2025 and grow at a robust Compound Annual Growth Rate (CAGR) of 7.21% through 2033. This impressive trajectory is fueled by an increasing consumer demand for advanced textiles that offer superior thermal regulation and comfort, particularly in the face of rising global temperatures and a growing emphasis on health and wellness. The market is witnessing a surge in innovation, with advancements in material science leading to the development of both natural and synthetic cooling fabrics. Natural fibers like cotton and bamboo are being enhanced for breathability and moisture-wicking properties, while synthetic options, leveraging technologies like phase-change materials (PCMs) and embedded cooling agents, offer unparalleled performance. The versatility of cooling fabrics is a key driver, with widespread adoption across sportswear for enhanced athletic performance and recovery, protective wear in industrial and military applications, and everyday apparel contributing to a more comfortable lifestyle. The "Others" segment, encompassing medical applications like temperature-regulating garments for patients, is also demonstrating strong growth potential as healthcare providers recognize the therapeutic benefits.
Cooling Fabrics Industry Market Size (In Billion)
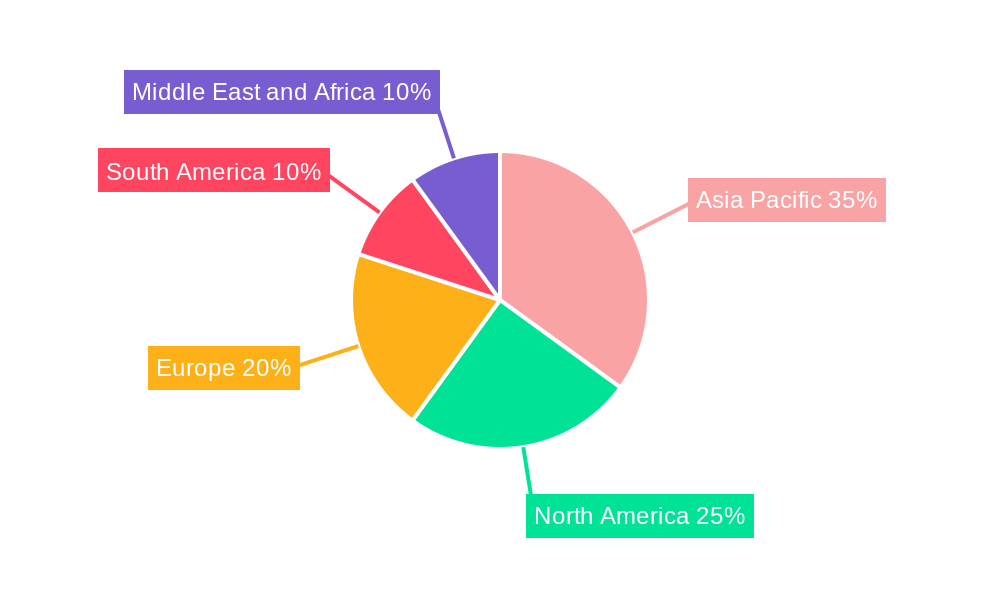
The market's dynamism is further shaped by evolving consumer preferences and technological breakthroughs. Key trends include the integration of smart technologies into cooling fabrics for real-time temperature monitoring and regulation, as well as a growing focus on sustainable and eco-friendly manufacturing processes for these advanced textiles. Consumers are increasingly seeking out apparel that not only performs well but also aligns with their environmental values. However, the market faces certain restraints, including the potentially higher manufacturing costs associated with advanced cooling technologies, which can translate to premium pricing for end products. Furthermore, educating consumers about the specific benefits and technologies behind different types of cooling fabrics remains a crucial aspect of market penetration. Despite these challenges, the expanding application landscape, coupled with the persistent drive for comfort and performance in various sectors, indicates a bright future for the cooling fabrics industry, with Asia Pacific emerging as a dominant region driven by its large population and rapidly growing textile manufacturing capabilities.
Cooling Fabrics Industry Company Market Share
Cooling Fabrics Industry Market Concentration & Innovation
The global Cooling Fabrics Industry exhibits a moderate to high degree of market concentration, driven by a blend of established textile giants and specialized technology providers. Key players like Everest Textile Co Ltd, Asahi Kasei Corporation, HeiQ Materials AG, Polartec, Columbia Sportswear Company, Formosa Taffeta Co Ltd, NILIT, Coolcore, NAN YA PLASTICS CORPORATION, Burlington, Wilson Fabrics, and Balavigna Weaving Mills Pvt Ltd, hold significant market share. Innovation is the primary catalyst, with continuous research and development focused on enhancing thermal regulation, breathability, moisture-wicking properties, and sustainability. Regulatory frameworks, particularly concerning material sourcing and environmental impact, are increasingly shaping product development and market access. Product substitutes, such as advanced ventilation systems in traditional apparel, pose a minor threat, but the inherent advantages of cooling fabrics in comfort and performance maintain their market dominance. End-user trends are strongly skewed towards active lifestyles and performance wear, with a growing demand for smart textiles and temperature-adaptive materials. Merger and acquisition activities are strategic, aimed at consolidating market presence, acquiring new technologies, and expanding geographical reach. The total M&A deal value in the historical period 2019-2024 is estimated to be over $500 Million, signaling robust consolidation efforts.
Cooling Fabrics Industry Industry Trends & Insights
The Cooling Fabrics Industry is experiencing robust growth, projected to witness a Compound Annual Growth Rate (CAGR) of approximately 8.5% during the forecast period of 2025–2033. This expansion is fueled by escalating consumer demand for comfort and performance in everyday wear and specialized applications. Technological advancements in fiber science, nanotechnology, and weaving techniques are enabling the creation of fabrics with superior thermoregulation, moisture management, and breathability. The integration of phase-change materials (PCMs) and innovative finishing treatments are key innovations driving market penetration. Consumer preferences are shifting towards athleisure and smart clothing, where cooling fabrics offer a tangible benefit for enhanced comfort and athletic performance. The increasing awareness of heat-related health issues and the demand for protective wear in various industrial settings further bolster market growth. Competitive dynamics are characterized by intense product innovation and strategic partnerships between fabric manufacturers and apparel brands. The market penetration of advanced cooling fabrics is projected to exceed 40% in the sportswear segment by 2033. The industry is also seeing a rise in sustainable manufacturing practices and the use of recycled materials, aligning with global environmental consciousness. The estimated market size for cooling fabrics in the base year 2025 is $15 Billion, with projections to reach over $30 Billion by 2033.
Dominant Markets & Segments in Cooling Fabrics Industry
The global Cooling Fabrics Industry is dominated by the Synthetic segment within the Type categorization. This dominance stems from the superior performance characteristics that synthetic fibers offer in terms of moisture-wicking, durability, and the ability to incorporate advanced cooling technologies. In terms of Fabric Type, Knitted fabrics hold a leading position, primarily due to their inherent stretch, comfort, and adaptability for sportswear and everyday apparel applications. The Sportswear application segment is the most significant market driver, accounting for over 60% of the global demand. This is attributed to the growing participation in sports and fitness activities worldwide, coupled with the increasing consumer awareness and demand for high-performance athletic wear.
- Key Drivers for Synthetic Dominance:
- Cost-effectiveness and scalability of production.
- Versatility in engineering properties for specific cooling functions.
- Compatibility with a wide range of finishing treatments and technologies.
- Key Drivers for Knitted Fabric Dominance:
- Superior comfort and drape compared to woven fabrics.
- Excellent breathability and ventilation properties.
- Ease of incorporation into seamless garment construction.
- Key Drivers for Sportswear Dominance:
- Increasing global adoption of active lifestyles and fitness trends.
- Demand for apparel that enhances performance and recovery.
- Growth of the athleisure market, blurring the lines between athletic and casual wear.
Regionally, North America and Europe currently lead in market share, driven by high disposable incomes, a strong emphasis on health and wellness, and a well-established sportswear industry. However, the Asia-Pacific region is exhibiting the fastest growth rate due to increasing urbanization, rising disposable incomes, and a burgeoning middle class embracing athletic activities.
Cooling Fabrics Industry Product Developments
Recent product developments in the Cooling Fabrics Industry are characterized by the integration of advanced, sustainable technologies. Innovations focus on enhancing thermoregulation through phase-change materials, embedded cooling channels, and hydrophilic treatments. Companies are leveraging recycled materials like NILIT's SENSIL EcoCare recycled Nylon 6.6, manufactured entirely from US materials, to cater to environmentally conscious consumers. The competitive advantage lies in offering fabrics that provide superior moisture management, rapid drying, and a consistent cooling sensation, thereby improving wearer comfort and performance across diverse applications.
Report Scope & Segmentation Analysis
This report analyzes the Cooling Fabrics Industry across key segmentation parameters. The Type segment is divided into Natural and Synthetic fibers, with Synthetic fibers projected to dominate due to performance advantages and cost-effectiveness. The Fabric Type segment encompasses Woven, Non-woven, and Knitted fabrics, with Knitted fabrics expected to lead in growth owing to their comfort and stretch properties. The Application segment covers Sportswear, Protective Wear, Apparels, and Others (Medical, etc.). Sportswear is the largest and fastest-growing segment, driven by lifestyle trends. The Medical segment, though smaller, presents emerging opportunities. Market size and growth projections are detailed for each sub-segment, alongside competitive dynamics.
Key Drivers of Cooling Fabrics Industry Growth
The growth of the Cooling Fabrics Industry is propelled by several key factors. Firstly, the increasing global adoption of active lifestyles and the burgeoning athleisure market significantly boost demand for high-performance sportswear. Secondly, technological advancements in material science, including the development of smart textiles and advanced finishing techniques, enable enhanced thermoregulation and moisture management. Thirdly, growing consumer awareness regarding the benefits of staying cool for comfort, health, and performance, particularly in warmer climates and during physical exertion, is a crucial driver. Finally, the rising demand for specialized protective wear in industrial and medical sectors further contributes to market expansion.
Challenges in the Cooling Fabrics Industry Sector
Despite its promising growth, the Cooling Fabrics Industry faces several challenges. High production costs associated with advanced materials and manufacturing processes can limit accessibility for some consumer segments. Intense competition among established players and emerging innovators necessitates continuous investment in research and development, posing financial strains. Furthermore, ensuring the durability and longevity of cooling properties throughout the product lifecycle remains a technical hurdle. Supply chain complexities, especially for specialized raw materials, and evolving regulatory landscapes regarding sustainability and chemical usage can also impact market dynamics.
Emerging Opportunities in Cooling Fabrics Industry
Emerging opportunities within the Cooling Fabrics Industry are abundant. The expansion of the smart textiles market presents a significant avenue, with the integration of sensors and connectivity into cooling fabrics for enhanced functionality. The growing healthcare sector's demand for specialized textiles, such as medical compression wear and temperature-regulating patient garments, offers a promising niche. Furthermore, the increasing focus on sustainable and eco-friendly textile solutions creates opportunities for bio-based cooling materials and advanced recycling technologies. Untapped markets in developing economies with rising disposable incomes and a growing middle class also represent substantial growth potential.
Leading Players in the Cooling Fabrics Industry Market
- Everest Textile Co Ltd
- Asahi Kasei Corporation
- HeiQ Materials AG
- Polartec
- Columbia Sportswear Company
- Formosa Taffeta Co Ltd
- NILIT
- Coolcore
- NAN YA PLASTICS CORPORATION
- Burlington
- Wilson Fabrics
- Balavigna Weaving Mills Pvt Ltd
Key Developments in Cooling Fabrics Industry Industry
- January 2023: NILIT launched a new version of SENSIL EcoCare recycled Nylon 6.6 manufactured completely from US materials at its North American facility in Martinsville, VA., enhancing its sustainable product portfolio and localizing production.
- March 2023: NILIT earned the International Sustainability and Carbon Certification Plus system (ISCC+) accreditation for its primary brand SENSIL ByNature, which manufactures cooling fabrics, underscoring its commitment to environmentally responsible practices and sustainable sourcing.
Strategic Outlook for Cooling Fabrics Industry Market
The strategic outlook for the Cooling Fabrics Industry is exceptionally positive, driven by innovation and evolving consumer demands. Future growth will be catalyzed by the continued integration of advanced technologies like nanotechnology and bio-engineered materials to create next-generation cooling solutions. Sustainability will remain a paramount focus, with a greater emphasis on recycled content, circular economy principles, and reduced environmental impact in manufacturing processes. Strategic collaborations between material suppliers and apparel brands will be crucial for expanding market reach and co-creating innovative product lines. The expanding applications beyond sportswear into medical, industrial, and everyday apparel will further diversify revenue streams and ensure sustained market expansion.
Cooling Fabrics Industry Segmentation
-
1. Type
- 1.1. Natural
- 1.2. Synthetic
-
2. Fabric Type
- 2.1. Woven
- 2.2. Non-woven
- 2.3. Knitted
-
3. Application
- 3.1. Sportswear
- 3.2. Protective Wear
- 3.3. Apparels
- 3.4. Others (Medical, etc.)
Cooling Fabrics Industry Segmentation By Geography
-
1. Asia Pacific
- 1.1. China
- 1.2. India
- 1.3. Japan
- 1.4. South Korea
- 1.5. Rest of Asia Pacific
-
2. North America
- 2.1. United States
- 2.2. Canada
- 2.3. Mexico
-
3. Europe
- 3.1. Germany
- 3.2. United Kingdom
- 3.3. Italy
- 3.4. France
- 3.5. Rest of Europe
-
4. South America
- 4.1. Brazil
- 4.2. Argentina
- 4.3. Rest of South America
-
5. Middle East and Africa
- 5.1. Saudi Arabia
- 5.2. South Africa
- 5.3. Rest of Middle East and Africa
Cooling Fabrics Industry Regional Market Share
Geographic Coverage of Cooling Fabrics Industry
Cooling Fabrics Industry REPORT HIGHLIGHTS
| Aspects | Details |
|---|---|
| Study Period | 2020-2034 |
| Base Year | 2025 |
| Estimated Year | 2026 |
| Forecast Period | 2026-2034 |
| Historical Period | 2020-2025 |
| Growth Rate | CAGR of 7.21% from 2020-2034 |
| Segmentation |
|
Table of Contents
- 1. Introduction
- 1.1. Research Scope
- 1.2. Market Segmentation
- 1.3. Research Objective
- 1.4. Definitions and Assumptions
- 2. Executive Summary
- 2.1. Market Snapshot
- 3. Market Dynamics
- 3.1. Market Drivers
- 3.2. Market Restrains
- 3.3. Market Trends
- 3.4. Market Opportunities
- 4. Market Factor Analysis
- 4.1. Porters Five Forces
- 4.1.1. Bargaining Power of Suppliers
- 4.1.2. Bargaining Power of Buyers
- 4.1.3. Threat of New Entrants
- 4.1.4. Threat of Substitutes
- 4.1.5. Competitive Rivalry
- 4.2. PESTEL analysis
- 4.3. BCG Analysis
- 4.3.1. Stars (High Growth, High Market Share)
- 4.3.2. Cash Cows (Low Growth, High Market Share)
- 4.3.3. Question Mark (High Growth, Low Market Share)
- 4.3.4. Dogs (Low Growth, Low Market Share)
- 4.4. Ansoff Matrix Analysis
- 4.5. Supply Chain Analysis
- 4.6. Regulatory Landscape
- 4.7. Current Market Potential and Opportunity Assessment (TAM–SAM–SOM Framework)
- 4.8. RAX Analyst Note
- 4.1. Porters Five Forces
- 5. Market Analysis, Insights and Forecast 2021-2033
- 5.1. Market Analysis, Insights and Forecast - by Type
- 5.1.1. Natural
- 5.1.2. Synthetic
- 5.2. Market Analysis, Insights and Forecast - by Fabric Type
- 5.2.1. Woven
- 5.2.2. Non-woven
- 5.2.3. Knitted
- 5.3. Market Analysis, Insights and Forecast - by Application
- 5.3.1. Sportswear
- 5.3.2. Protective Wear
- 5.3.3. Apparels
- 5.3.4. Others (Medical, etc.)
- 5.4. Market Analysis, Insights and Forecast - by Region
- 5.4.1. Asia Pacific
- 5.4.2. North America
- 5.4.3. Europe
- 5.4.4. South America
- 5.4.5. Middle East and Africa
- 5.1. Market Analysis, Insights and Forecast - by Type
- 6. Global Cooling Fabrics Industry Analysis, Insights and Forecast, 2021-2033
- 6.1. Market Analysis, Insights and Forecast - by Type
- 6.1.1. Natural
- 6.1.2. Synthetic
- 6.2. Market Analysis, Insights and Forecast - by Fabric Type
- 6.2.1. Woven
- 6.2.2. Non-woven
- 6.2.3. Knitted
- 6.3. Market Analysis, Insights and Forecast - by Application
- 6.3.1. Sportswear
- 6.3.2. Protective Wear
- 6.3.3. Apparels
- 6.3.4. Others (Medical, etc.)
- 6.1. Market Analysis, Insights and Forecast - by Type
- 7. Asia Pacific Cooling Fabrics Industry Analysis, Insights and Forecast, 2020-2032
- 7.1. Market Analysis, Insights and Forecast - by Type
- 7.1.1. Natural
- 7.1.2. Synthetic
- 7.2. Market Analysis, Insights and Forecast - by Fabric Type
- 7.2.1. Woven
- 7.2.2. Non-woven
- 7.2.3. Knitted
- 7.3. Market Analysis, Insights and Forecast - by Application
- 7.3.1. Sportswear
- 7.3.2. Protective Wear
- 7.3.3. Apparels
- 7.3.4. Others (Medical, etc.)
- 7.1. Market Analysis, Insights and Forecast - by Type
- 8. North America Cooling Fabrics Industry Analysis, Insights and Forecast, 2020-2032
- 8.1. Market Analysis, Insights and Forecast - by Type
- 8.1.1. Natural
- 8.1.2. Synthetic
- 8.2. Market Analysis, Insights and Forecast - by Fabric Type
- 8.2.1. Woven
- 8.2.2. Non-woven
- 8.2.3. Knitted
- 8.3. Market Analysis, Insights and Forecast - by Application
- 8.3.1. Sportswear
- 8.3.2. Protective Wear
- 8.3.3. Apparels
- 8.3.4. Others (Medical, etc.)
- 8.1. Market Analysis, Insights and Forecast - by Type
- 9. Europe Cooling Fabrics Industry Analysis, Insights and Forecast, 2020-2032
- 9.1. Market Analysis, Insights and Forecast - by Type
- 9.1.1. Natural
- 9.1.2. Synthetic
- 9.2. Market Analysis, Insights and Forecast - by Fabric Type
- 9.2.1. Woven
- 9.2.2. Non-woven
- 9.2.3. Knitted
- 9.3. Market Analysis, Insights and Forecast - by Application
- 9.3.1. Sportswear
- 9.3.2. Protective Wear
- 9.3.3. Apparels
- 9.3.4. Others (Medical, etc.)
- 9.1. Market Analysis, Insights and Forecast - by Type
- 10. South America Cooling Fabrics Industry Analysis, Insights and Forecast, 2020-2032
- 10.1. Market Analysis, Insights and Forecast - by Type
- 10.1.1. Natural
- 10.1.2. Synthetic
- 10.2. Market Analysis, Insights and Forecast - by Fabric Type
- 10.2.1. Woven
- 10.2.2. Non-woven
- 10.2.3. Knitted
- 10.3. Market Analysis, Insights and Forecast - by Application
- 10.3.1. Sportswear
- 10.3.2. Protective Wear
- 10.3.3. Apparels
- 10.3.4. Others (Medical, etc.)
- 10.1. Market Analysis, Insights and Forecast - by Type
- 11. Middle East and Africa Cooling Fabrics Industry Analysis, Insights and Forecast, 2020-2032
- 11.1. Market Analysis, Insights and Forecast - by Type
- 11.1.1. Natural
- 11.1.2. Synthetic
- 11.2. Market Analysis, Insights and Forecast - by Fabric Type
- 11.2.1. Woven
- 11.2.2. Non-woven
- 11.2.3. Knitted
- 11.3. Market Analysis, Insights and Forecast - by Application
- 11.3.1. Sportswear
- 11.3.2. Protective Wear
- 11.3.3. Apparels
- 11.3.4. Others (Medical, etc.)
- 11.1. Market Analysis, Insights and Forecast - by Type
- 12. Competitive Analysis
- 12.1. Company Profiles
- 12.1.1 Everest Textile Co Ltd
- 12.1.1.1. Company Overview
- 12.1.1.2. Products
- 12.1.1.3. Company Financials
- 12.1.1.4. SWOT Analysis
- 12.1.2 Asahi Kasei Corporation
- 12.1.2.1. Company Overview
- 12.1.2.2. Products
- 12.1.2.3. Company Financials
- 12.1.2.4. SWOT Analysis
- 12.1.3 HeiQ Materials AG
- 12.1.3.1. Company Overview
- 12.1.3.2. Products
- 12.1.3.3. Company Financials
- 12.1.3.4. SWOT Analysis
- 12.1.4 Polartec
- 12.1.4.1. Company Overview
- 12.1.4.2. Products
- 12.1.4.3. Company Financials
- 12.1.4.4. SWOT Analysis
- 12.1.5 Columbia Sportswear Company
- 12.1.5.1. Company Overview
- 12.1.5.2. Products
- 12.1.5.3. Company Financials
- 12.1.5.4. SWOT Analysis
- 12.1.6 Formosa Taffeta Co Ltd
- 12.1.6.1. Company Overview
- 12.1.6.2. Products
- 12.1.6.3. Company Financials
- 12.1.6.4. SWOT Analysis
- 12.1.7 NILIT
- 12.1.7.1. Company Overview
- 12.1.7.2. Products
- 12.1.7.3. Company Financials
- 12.1.7.4. SWOT Analysis
- 12.1.8 Coolcore
- 12.1.8.1. Company Overview
- 12.1.8.2. Products
- 12.1.8.3. Company Financials
- 12.1.8.4. SWOT Analysis
- 12.1.9 NAN YA PLASTICS CORPORATION
- 12.1.9.1. Company Overview
- 12.1.9.2. Products
- 12.1.9.3. Company Financials
- 12.1.9.4. SWOT Analysis
- 12.1.10 Burlington
- 12.1.10.1. Company Overview
- 12.1.10.2. Products
- 12.1.10.3. Company Financials
- 12.1.10.4. SWOT Analysis
- 12.1.11 Wilson Fabrics
- 12.1.11.1. Company Overview
- 12.1.11.2. Products
- 12.1.11.3. Company Financials
- 12.1.11.4. SWOT Analysis
- 12.1.12 Balavigna Weaving Mills Pvt Ltd
- 12.1.12.1. Company Overview
- 12.1.12.2. Products
- 12.1.12.3. Company Financials
- 12.1.12.4. SWOT Analysis
- 12.1.1 Everest Textile Co Ltd
- 12.2. Market Entropy
- 12.2.1 Company's Key Areas Served
- 12.2.2 Recent Developments
- 12.3. Company Market Share Analysis 2025
- 12.3.1 Top 5 Companies Market Share Analysis
- 12.3.2 Top 3 Companies Market Share Analysis
- 12.4. List of Potential Customers
- 13. Research Methodology
List of Figures
- Figure 1: Global Cooling Fabrics Industry Revenue Breakdown (Million, %) by Region 2025 & 2033
- Figure 2: Global Cooling Fabrics Industry Volume Breakdown (K Tons, %) by Region 2025 & 2033
- Figure 3: Asia Pacific Cooling Fabrics Industry Revenue (Million), by Type 2025 & 2033
- Figure 4: Asia Pacific Cooling Fabrics Industry Volume (K Tons), by Type 2025 & 2033
- Figure 5: Asia Pacific Cooling Fabrics Industry Revenue Share (%), by Type 2025 & 2033
- Figure 6: Asia Pacific Cooling Fabrics Industry Volume Share (%), by Type 2025 & 2033
- Figure 7: Asia Pacific Cooling Fabrics Industry Revenue (Million), by Fabric Type 2025 & 2033
- Figure 8: Asia Pacific Cooling Fabrics Industry Volume (K Tons), by Fabric Type 2025 & 2033
- Figure 9: Asia Pacific Cooling Fabrics Industry Revenue Share (%), by Fabric Type 2025 & 2033
- Figure 10: Asia Pacific Cooling Fabrics Industry Volume Share (%), by Fabric Type 2025 & 2033
- Figure 11: Asia Pacific Cooling Fabrics Industry Revenue (Million), by Application 2025 & 2033
- Figure 12: Asia Pacific Cooling Fabrics Industry Volume (K Tons), by Application 2025 & 2033
- Figure 13: Asia Pacific Cooling Fabrics Industry Revenue Share (%), by Application 2025 & 2033
- Figure 14: Asia Pacific Cooling Fabrics Industry Volume Share (%), by Application 2025 & 2033
- Figure 15: Asia Pacific Cooling Fabrics Industry Revenue (Million), by Country 2025 & 2033
- Figure 16: Asia Pacific Cooling Fabrics Industry Volume (K Tons), by Country 2025 & 2033
- Figure 17: Asia Pacific Cooling Fabrics Industry Revenue Share (%), by Country 2025 & 2033
- Figure 18: Asia Pacific Cooling Fabrics Industry Volume Share (%), by Country 2025 & 2033
- Figure 19: North America Cooling Fabrics Industry Revenue (Million), by Type 2025 & 2033
- Figure 20: North America Cooling Fabrics Industry Volume (K Tons), by Type 2025 & 2033
- Figure 21: North America Cooling Fabrics Industry Revenue Share (%), by Type 2025 & 2033
- Figure 22: North America Cooling Fabrics Industry Volume Share (%), by Type 2025 & 2033
- Figure 23: North America Cooling Fabrics Industry Revenue (Million), by Fabric Type 2025 & 2033
- Figure 24: North America Cooling Fabrics Industry Volume (K Tons), by Fabric Type 2025 & 2033
- Figure 25: North America Cooling Fabrics Industry Revenue Share (%), by Fabric Type 2025 & 2033
- Figure 26: North America Cooling Fabrics Industry Volume Share (%), by Fabric Type 2025 & 2033
- Figure 27: North America Cooling Fabrics Industry Revenue (Million), by Application 2025 & 2033
- Figure 28: North America Cooling Fabrics Industry Volume (K Tons), by Application 2025 & 2033
- Figure 29: North America Cooling Fabrics Industry Revenue Share (%), by Application 2025 & 2033
- Figure 30: North America Cooling Fabrics Industry Volume Share (%), by Application 2025 & 2033
- Figure 31: North America Cooling Fabrics Industry Revenue (Million), by Country 2025 & 2033
- Figure 32: North America Cooling Fabrics Industry Volume (K Tons), by Country 2025 & 2033
- Figure 33: North America Cooling Fabrics Industry Revenue Share (%), by Country 2025 & 2033
- Figure 34: North America Cooling Fabrics Industry Volume Share (%), by Country 2025 & 2033
- Figure 35: Europe Cooling Fabrics Industry Revenue (Million), by Type 2025 & 2033
- Figure 36: Europe Cooling Fabrics Industry Volume (K Tons), by Type 2025 & 2033
- Figure 37: Europe Cooling Fabrics Industry Revenue Share (%), by Type 2025 & 2033
- Figure 38: Europe Cooling Fabrics Industry Volume Share (%), by Type 2025 & 2033
- Figure 39: Europe Cooling Fabrics Industry Revenue (Million), by Fabric Type 2025 & 2033
- Figure 40: Europe Cooling Fabrics Industry Volume (K Tons), by Fabric Type 2025 & 2033
- Figure 41: Europe Cooling Fabrics Industry Revenue Share (%), by Fabric Type 2025 & 2033
- Figure 42: Europe Cooling Fabrics Industry Volume Share (%), by Fabric Type 2025 & 2033
- Figure 43: Europe Cooling Fabrics Industry Revenue (Million), by Application 2025 & 2033
- Figure 44: Europe Cooling Fabrics Industry Volume (K Tons), by Application 2025 & 2033
- Figure 45: Europe Cooling Fabrics Industry Revenue Share (%), by Application 2025 & 2033
- Figure 46: Europe Cooling Fabrics Industry Volume Share (%), by Application 2025 & 2033
- Figure 47: Europe Cooling Fabrics Industry Revenue (Million), by Country 2025 & 2033
- Figure 48: Europe Cooling Fabrics Industry Volume (K Tons), by Country 2025 & 2033
- Figure 49: Europe Cooling Fabrics Industry Revenue Share (%), by Country 2025 & 2033
- Figure 50: Europe Cooling Fabrics Industry Volume Share (%), by Country 2025 & 2033
- Figure 51: South America Cooling Fabrics Industry Revenue (Million), by Type 2025 & 2033
- Figure 52: South America Cooling Fabrics Industry Volume (K Tons), by Type 2025 & 2033
- Figure 53: South America Cooling Fabrics Industry Revenue Share (%), by Type 2025 & 2033
- Figure 54: South America Cooling Fabrics Industry Volume Share (%), by Type 2025 & 2033
- Figure 55: South America Cooling Fabrics Industry Revenue (Million), by Fabric Type 2025 & 2033
- Figure 56: South America Cooling Fabrics Industry Volume (K Tons), by Fabric Type 2025 & 2033
- Figure 57: South America Cooling Fabrics Industry Revenue Share (%), by Fabric Type 2025 & 2033
- Figure 58: South America Cooling Fabrics Industry Volume Share (%), by Fabric Type 2025 & 2033
- Figure 59: South America Cooling Fabrics Industry Revenue (Million), by Application 2025 & 2033
- Figure 60: South America Cooling Fabrics Industry Volume (K Tons), by Application 2025 & 2033
- Figure 61: South America Cooling Fabrics Industry Revenue Share (%), by Application 2025 & 2033
- Figure 62: South America Cooling Fabrics Industry Volume Share (%), by Application 2025 & 2033
- Figure 63: South America Cooling Fabrics Industry Revenue (Million), by Country 2025 & 2033
- Figure 64: South America Cooling Fabrics Industry Volume (K Tons), by Country 2025 & 2033
- Figure 65: South America Cooling Fabrics Industry Revenue Share (%), by Country 2025 & 2033
- Figure 66: South America Cooling Fabrics Industry Volume Share (%), by Country 2025 & 2033
- Figure 67: Middle East and Africa Cooling Fabrics Industry Revenue (Million), by Type 2025 & 2033
- Figure 68: Middle East and Africa Cooling Fabrics Industry Volume (K Tons), by Type 2025 & 2033
- Figure 69: Middle East and Africa Cooling Fabrics Industry Revenue Share (%), by Type 2025 & 2033
- Figure 70: Middle East and Africa Cooling Fabrics Industry Volume Share (%), by Type 2025 & 2033
- Figure 71: Middle East and Africa Cooling Fabrics Industry Revenue (Million), by Fabric Type 2025 & 2033
- Figure 72: Middle East and Africa Cooling Fabrics Industry Volume (K Tons), by Fabric Type 2025 & 2033
- Figure 73: Middle East and Africa Cooling Fabrics Industry Revenue Share (%), by Fabric Type 2025 & 2033
- Figure 74: Middle East and Africa Cooling Fabrics Industry Volume Share (%), by Fabric Type 2025 & 2033
- Figure 75: Middle East and Africa Cooling Fabrics Industry Revenue (Million), by Application 2025 & 2033
- Figure 76: Middle East and Africa Cooling Fabrics Industry Volume (K Tons), by Application 2025 & 2033
- Figure 77: Middle East and Africa Cooling Fabrics Industry Revenue Share (%), by Application 2025 & 2033
- Figure 78: Middle East and Africa Cooling Fabrics Industry Volume Share (%), by Application 2025 & 2033
- Figure 79: Middle East and Africa Cooling Fabrics Industry Revenue (Million), by Country 2025 & 2033
- Figure 80: Middle East and Africa Cooling Fabrics Industry Volume (K Tons), by Country 2025 & 2033
- Figure 81: Middle East and Africa Cooling Fabrics Industry Revenue Share (%), by Country 2025 & 2033
- Figure 82: Middle East and Africa Cooling Fabrics Industry Volume Share (%), by Country 2025 & 2033
List of Tables
- Table 1: Global Cooling Fabrics Industry Revenue Million Forecast, by Type 2020 & 2033
- Table 2: Global Cooling Fabrics Industry Volume K Tons Forecast, by Type 2020 & 2033
- Table 3: Global Cooling Fabrics Industry Revenue Million Forecast, by Fabric Type 2020 & 2033
- Table 4: Global Cooling Fabrics Industry Volume K Tons Forecast, by Fabric Type 2020 & 2033
- Table 5: Global Cooling Fabrics Industry Revenue Million Forecast, by Application 2020 & 2033
- Table 6: Global Cooling Fabrics Industry Volume K Tons Forecast, by Application 2020 & 2033
- Table 7: Global Cooling Fabrics Industry Revenue Million Forecast, by Region 2020 & 2033
- Table 8: Global Cooling Fabrics Industry Volume K Tons Forecast, by Region 2020 & 2033
- Table 9: Global Cooling Fabrics Industry Revenue Million Forecast, by Type 2020 & 2033
- Table 10: Global Cooling Fabrics Industry Volume K Tons Forecast, by Type 2020 & 2033
- Table 11: Global Cooling Fabrics Industry Revenue Million Forecast, by Fabric Type 2020 & 2033
- Table 12: Global Cooling Fabrics Industry Volume K Tons Forecast, by Fabric Type 2020 & 2033
- Table 13: Global Cooling Fabrics Industry Revenue Million Forecast, by Application 2020 & 2033
- Table 14: Global Cooling Fabrics Industry Volume K Tons Forecast, by Application 2020 & 2033
- Table 15: Global Cooling Fabrics Industry Revenue Million Forecast, by Country 2020 & 2033
- Table 16: Global Cooling Fabrics Industry Volume K Tons Forecast, by Country 2020 & 2033
- Table 17: China Cooling Fabrics Industry Revenue (Million) Forecast, by Application 2020 & 2033
- Table 18: China Cooling Fabrics Industry Volume (K Tons) Forecast, by Application 2020 & 2033
- Table 19: India Cooling Fabrics Industry Revenue (Million) Forecast, by Application 2020 & 2033
- Table 20: India Cooling Fabrics Industry Volume (K Tons) Forecast, by Application 2020 & 2033
- Table 21: Japan Cooling Fabrics Industry Revenue (Million) Forecast, by Application 2020 & 2033
- Table 22: Japan Cooling Fabrics Industry Volume (K Tons) Forecast, by Application 2020 & 2033
- Table 23: South Korea Cooling Fabrics Industry Revenue (Million) Forecast, by Application 2020 & 2033
- Table 24: South Korea Cooling Fabrics Industry Volume (K Tons) Forecast, by Application 2020 & 2033
- Table 25: Rest of Asia Pacific Cooling Fabrics Industry Revenue (Million) Forecast, by Application 2020 & 2033
- Table 26: Rest of Asia Pacific Cooling Fabrics Industry Volume (K Tons) Forecast, by Application 2020 & 2033
- Table 27: Global Cooling Fabrics Industry Revenue Million Forecast, by Type 2020 & 2033
- Table 28: Global Cooling Fabrics Industry Volume K Tons Forecast, by Type 2020 & 2033
- Table 29: Global Cooling Fabrics Industry Revenue Million Forecast, by Fabric Type 2020 & 2033
- Table 30: Global Cooling Fabrics Industry Volume K Tons Forecast, by Fabric Type 2020 & 2033
- Table 31: Global Cooling Fabrics Industry Revenue Million Forecast, by Application 2020 & 2033
- Table 32: Global Cooling Fabrics Industry Volume K Tons Forecast, by Application 2020 & 2033
- Table 33: Global Cooling Fabrics Industry Revenue Million Forecast, by Country 2020 & 2033
- Table 34: Global Cooling Fabrics Industry Volume K Tons Forecast, by Country 2020 & 2033
- Table 35: United States Cooling Fabrics Industry Revenue (Million) Forecast, by Application 2020 & 2033
- Table 36: United States Cooling Fabrics Industry Volume (K Tons) Forecast, by Application 2020 & 2033
- Table 37: Canada Cooling Fabrics Industry Revenue (Million) Forecast, by Application 2020 & 2033
- Table 38: Canada Cooling Fabrics Industry Volume (K Tons) Forecast, by Application 2020 & 2033
- Table 39: Mexico Cooling Fabrics Industry Revenue (Million) Forecast, by Application 2020 & 2033
- Table 40: Mexico Cooling Fabrics Industry Volume (K Tons) Forecast, by Application 2020 & 2033
- Table 41: Global Cooling Fabrics Industry Revenue Million Forecast, by Type 2020 & 2033
- Table 42: Global Cooling Fabrics Industry Volume K Tons Forecast, by Type 2020 & 2033
- Table 43: Global Cooling Fabrics Industry Revenue Million Forecast, by Fabric Type 2020 & 2033
- Table 44: Global Cooling Fabrics Industry Volume K Tons Forecast, by Fabric Type 2020 & 2033
- Table 45: Global Cooling Fabrics Industry Revenue Million Forecast, by Application 2020 & 2033
- Table 46: Global Cooling Fabrics Industry Volume K Tons Forecast, by Application 2020 & 2033
- Table 47: Global Cooling Fabrics Industry Revenue Million Forecast, by Country 2020 & 2033
- Table 48: Global Cooling Fabrics Industry Volume K Tons Forecast, by Country 2020 & 2033
- Table 49: Germany Cooling Fabrics Industry Revenue (Million) Forecast, by Application 2020 & 2033
- Table 50: Germany Cooling Fabrics Industry Volume (K Tons) Forecast, by Application 2020 & 2033
- Table 51: United Kingdom Cooling Fabrics Industry Revenue (Million) Forecast, by Application 2020 & 2033
- Table 52: United Kingdom Cooling Fabrics Industry Volume (K Tons) Forecast, by Application 2020 & 2033
- Table 53: Italy Cooling Fabrics Industry Revenue (Million) Forecast, by Application 2020 & 2033
- Table 54: Italy Cooling Fabrics Industry Volume (K Tons) Forecast, by Application 2020 & 2033
- Table 55: France Cooling Fabrics Industry Revenue (Million) Forecast, by Application 2020 & 2033
- Table 56: France Cooling Fabrics Industry Volume (K Tons) Forecast, by Application 2020 & 2033
- Table 57: Rest of Europe Cooling Fabrics Industry Revenue (Million) Forecast, by Application 2020 & 2033
- Table 58: Rest of Europe Cooling Fabrics Industry Volume (K Tons) Forecast, by Application 2020 & 2033
- Table 59: Global Cooling Fabrics Industry Revenue Million Forecast, by Type 2020 & 2033
- Table 60: Global Cooling Fabrics Industry Volume K Tons Forecast, by Type 2020 & 2033
- Table 61: Global Cooling Fabrics Industry Revenue Million Forecast, by Fabric Type 2020 & 2033
- Table 62: Global Cooling Fabrics Industry Volume K Tons Forecast, by Fabric Type 2020 & 2033
- Table 63: Global Cooling Fabrics Industry Revenue Million Forecast, by Application 2020 & 2033
- Table 64: Global Cooling Fabrics Industry Volume K Tons Forecast, by Application 2020 & 2033
- Table 65: Global Cooling Fabrics Industry Revenue Million Forecast, by Country 2020 & 2033
- Table 66: Global Cooling Fabrics Industry Volume K Tons Forecast, by Country 2020 & 2033
- Table 67: Brazil Cooling Fabrics Industry Revenue (Million) Forecast, by Application 2020 & 2033
- Table 68: Brazil Cooling Fabrics Industry Volume (K Tons) Forecast, by Application 2020 & 2033
- Table 69: Argentina Cooling Fabrics Industry Revenue (Million) Forecast, by Application 2020 & 2033
- Table 70: Argentina Cooling Fabrics Industry Volume (K Tons) Forecast, by Application 2020 & 2033
- Table 71: Rest of South America Cooling Fabrics Industry Revenue (Million) Forecast, by Application 2020 & 2033
- Table 72: Rest of South America Cooling Fabrics Industry Volume (K Tons) Forecast, by Application 2020 & 2033
- Table 73: Global Cooling Fabrics Industry Revenue Million Forecast, by Type 2020 & 2033
- Table 74: Global Cooling Fabrics Industry Volume K Tons Forecast, by Type 2020 & 2033
- Table 75: Global Cooling Fabrics Industry Revenue Million Forecast, by Fabric Type 2020 & 2033
- Table 76: Global Cooling Fabrics Industry Volume K Tons Forecast, by Fabric Type 2020 & 2033
- Table 77: Global Cooling Fabrics Industry Revenue Million Forecast, by Application 2020 & 2033
- Table 78: Global Cooling Fabrics Industry Volume K Tons Forecast, by Application 2020 & 2033
- Table 79: Global Cooling Fabrics Industry Revenue Million Forecast, by Country 2020 & 2033
- Table 80: Global Cooling Fabrics Industry Volume K Tons Forecast, by Country 2020 & 2033
- Table 81: Saudi Arabia Cooling Fabrics Industry Revenue (Million) Forecast, by Application 2020 & 2033
- Table 82: Saudi Arabia Cooling Fabrics Industry Volume (K Tons) Forecast, by Application 2020 & 2033
- Table 83: South Africa Cooling Fabrics Industry Revenue (Million) Forecast, by Application 2020 & 2033
- Table 84: South Africa Cooling Fabrics Industry Volume (K Tons) Forecast, by Application 2020 & 2033
- Table 85: Rest of Middle East and Africa Cooling Fabrics Industry Revenue (Million) Forecast, by Application 2020 & 2033
- Table 86: Rest of Middle East and Africa Cooling Fabrics Industry Volume (K Tons) Forecast, by Application 2020 & 2033
Frequently Asked Questions
1. What is the projected Compound Annual Growth Rate (CAGR) of the Cooling Fabrics Industry?
The projected CAGR is approximately 7.21%.
2. Which companies are prominent players in the Cooling Fabrics Industry?
Key companies in the market include Everest Textile Co Ltd, Asahi Kasei Corporation, HeiQ Materials AG, Polartec, Columbia Sportswear Company, Formosa Taffeta Co Ltd, NILIT, Coolcore, NAN YA PLASTICS CORPORATION, Burlington, Wilson Fabrics, Balavigna Weaving Mills Pvt Ltd.
3. What are the main segments of the Cooling Fabrics Industry?
The market segments include Type, Fabric Type, Application.
4. Can you provide details about the market size?
The market size is estimated to be USD 2.42 Million as of 2022.
5. What are some drivers contributing to market growth?
Growing Demand for Synthetic Fabrics; Increasing Demand for Sportwear Fabrics; Other Drivers.
6. What are the notable trends driving market growth?
Increasing Demand from Sportswear Application.
7. Are there any restraints impacting market growth?
High Cost of Cooling Fabrics; Other Restraints.
8. Can you provide examples of recent developments in the market?
January 2023: NILIT launched a new version of SENSIL EcoCare recycled Nylon 6.6 manufactured completely from US materials at its North American facility in Martinsville, VA.
9. What pricing options are available for accessing the report?
Pricing options include single-user, multi-user, and enterprise licenses priced at USD 4750, USD 5250, and USD 8750 respectively.
10. Is the market size provided in terms of value or volume?
The market size is provided in terms of value, measured in Million and volume, measured in K Tons.
11. Are there any specific market keywords associated with the report?
Yes, the market keyword associated with the report is "Cooling Fabrics Industry," which aids in identifying and referencing the specific market segment covered.
12. How do I determine which pricing option suits my needs best?
The pricing options vary based on user requirements and access needs. Individual users may opt for single-user licenses, while businesses requiring broader access may choose multi-user or enterprise licenses for cost-effective access to the report.
13. Are there any additional resources or data provided in the Cooling Fabrics Industry report?
While the report offers comprehensive insights, it's advisable to review the specific contents or supplementary materials provided to ascertain if additional resources or data are available.
14. How can I stay updated on further developments or reports in the Cooling Fabrics Industry?
To stay informed about further developments, trends, and reports in the Cooling Fabrics Industry, consider subscribing to industry newsletters, following relevant companies and organizations, or regularly checking reputable industry news sources and publications.
Methodology
Step 1 - Identification of Relevant Samples Size from Population Database


Step 2 - Approaches for Defining Global Market Size (Value, Volume* & Price*)

Note*: In applicable scenarios
Step 3 - Data Sources
Primary Research
- Web Analytics
- Survey Reports
- Research Institute
- Latest Research Reports
- Opinion Leaders
Secondary Research
- Annual Reports
- White Paper
- Latest Press Release
- Industry Association
- Paid Database
- Investor Presentations

Step 4 - Data Triangulation
Involves using different sources of information in order to increase the validity of a study
These sources are likely to be stakeholders in a program - participants, other researchers, program staff, other community members, and so on.
Then we put all data in single framework & apply various statistical tools to find out the dynamic on the market.
During the analysis stage, feedback from the stakeholder groups would be compared to determine areas of agreement as well as areas of divergence