

Key Insights
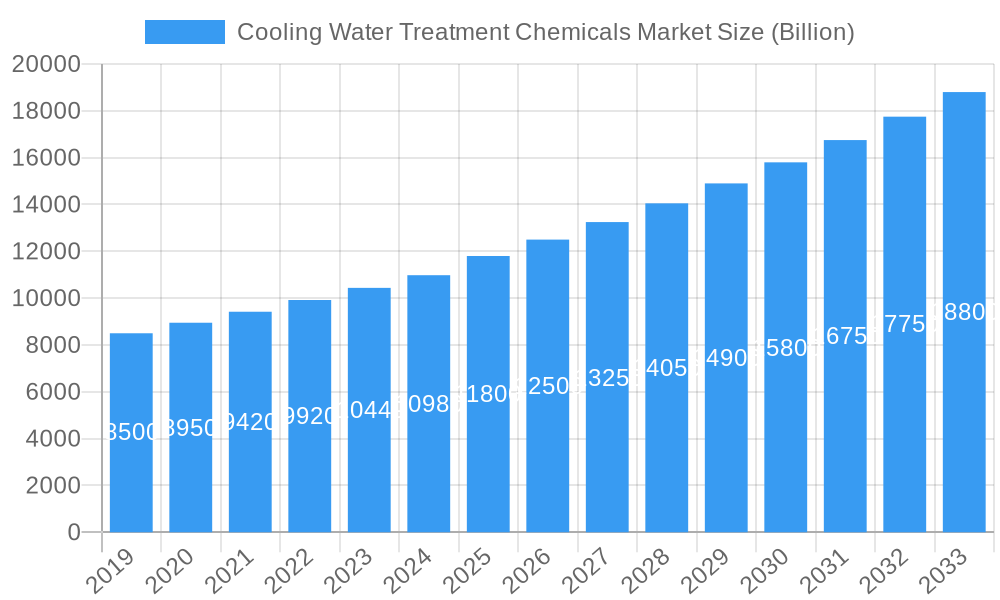
The global Cooling Water Treatment Chemicals market is poised for robust expansion, projected to reach a significant market size of $11.8 billion by 2025, with a Compound Annual Growth Rate (CAGR) of 5.8% expected to propel it through 2033. This impressive growth trajectory is primarily fueled by the escalating demand for efficient water management across a multitude of industrial sectors, driven by stringent environmental regulations and the increasing need for sustainable operational practices. Industries like power generation, petrochemicals and oil and gas, and mining are at the forefront, requiring advanced treatment solutions to prevent scaling, corrosion, and microbial contamination in their critical cooling systems. The continuous technological advancements in developing eco-friendly and high-performance treatment chemicals, coupled with a growing awareness among industries regarding the long-term cost savings and operational efficiency gains offered by effective cooling water treatment, are significant drivers of this market's upward momentum.
Cooling Water Treatment Chemicals Market Market Size (In Billion)
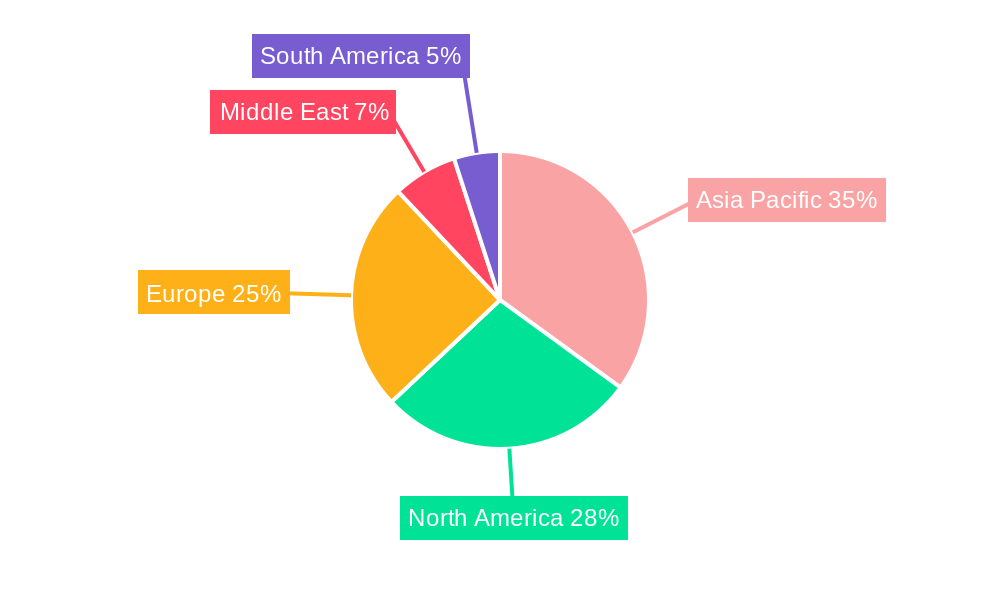
The market's segmentation reveals a dynamic landscape. Corrosion inhibitors and scale inhibitors are anticipated to dominate the demand due to their critical role in extending the lifespan of industrial equipment and preventing costly downtime. Biocides also hold a substantial share, essential for maintaining water quality and preventing biofouling. Geographically, the Asia Pacific region, led by China and India, is expected to emerge as the largest and fastest-growing market, owing to rapid industrialization, increasing infrastructure development, and a growing emphasis on water conservation. North America and Europe also represent mature yet significant markets, driven by their established industrial base and adherence to stringent environmental standards. While the market is characterized by strong growth, challenges such as the fluctuating raw material costs and the development of advanced water recycling technologies that might reduce the overall consumption of traditional chemicals could pose moderate restraints. Nevertheless, the overarching need for efficient and reliable cooling water systems ensures a promising future for this market.
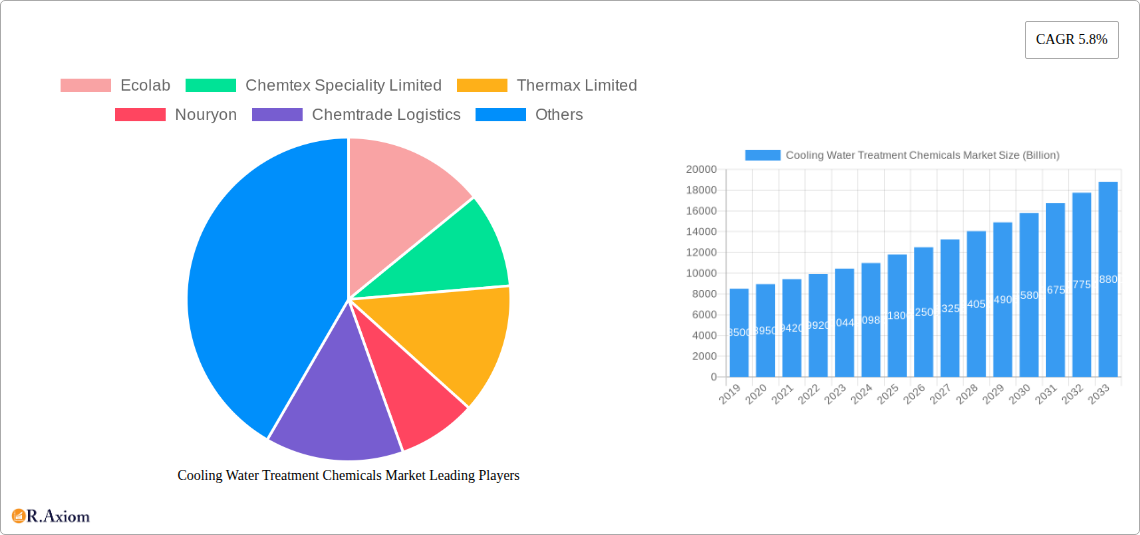
Cooling Water Treatment Chemicals Market Company Market Share
This in-depth report provides a detailed examination of the global Cooling Water Treatment Chemicals market, offering critical insights and actionable intelligence for industry stakeholders. Spanning from 2019 to 2033, with a Base Year of 2025, this study meticulously analyzes historical trends, current market dynamics, and future projections for the Forecast Period of 2025–2033, building upon the Historical Period of 2019–2024. The report focuses on the critical role of cooling water treatment chemicals in ensuring operational efficiency, asset longevity, and environmental compliance across diverse industrial sectors. We delve into the market's intricate segmentation by Type (Corrosion Inhibitor, Scale Inhibitor, Biocide, Other Types) and End-user Industry (Power Industry, Steel, Mining & Metallurgy, Petrochemicals and Oil and Gas, Food and Beverage, Textile and Dyes, Other End-user Industries), providing granular market size estimations and growth forecasts.
Cooling Water Treatment Chemicals Market Market Concentration & Innovation
The Cooling Water Treatment Chemicals market exhibits a moderate level of concentration, characterized by the presence of both large multinational corporations and smaller, specialized players. Innovation is a key driver, with significant investments in research and development aimed at creating more sustainable, efficient, and cost-effective chemical solutions. Regulatory frameworks, particularly concerning environmental discharge and water usage, are increasingly influencing product development and market strategies. Companies are focusing on biodegradable formulations, low-toxicity biocides, and chemicals that reduce water consumption. Product substitutes, such as advanced filtration technologies and alternative cooling methods, pose a growing competitive challenge, necessitating continuous innovation in chemical treatment. End-user trends are leaning towards integrated solutions that combine chemical treatment with digital monitoring and control systems, enhancing performance and reducing operational costs. Mergers and acquisitions (M&A) activities remain prevalent as established players seek to expand their product portfolios, geographical reach, and technological capabilities. Key M&A deal values are estimated to be in the hundreds of millions of dollars, facilitating consolidation and synergy realization.
Cooling Water Treatment Chemicals Market Industry Trends & Insights
The Cooling Water Treatment Chemicals market is experiencing robust growth, driven by increasing industrialization, stringent environmental regulations, and the growing demand for water conservation. The global market size is projected to reach $xx Billion by 2033, exhibiting a Compound Annual Growth Rate (CAGR) of approximately 4.8% during the forecast period. This expansion is fueled by the critical need to prevent scaling, corrosion, and biofouling in industrial cooling systems, which are essential for the efficient operation of numerous sectors, including power generation, manufacturing, and petrochemicals. Technological advancements are playing a pivotal role, with the development of intelligent chemical formulations that offer enhanced performance, reduced environmental impact, and improved operational efficiency. The integration of digital technologies, such as IoT sensors and data analytics, is revolutionizing chemical monitoring and dosing, enabling predictive maintenance and optimizing treatment regimes. Consumer preferences are shifting towards sustainable and eco-friendly solutions, pushing manufacturers to develop greener chemistries and water reuse strategies. The competitive landscape is dynamic, with companies actively investing in R&D to stay ahead of the curve and differentiate their offerings. Market penetration is expected to deepen across emerging economies as industrial development accelerates. The rising awareness of water scarcity and the economic implications of system downtime are further bolstering the demand for effective cooling water treatment solutions. The increasing complexity of industrial processes also necessitates customized chemical formulations to address specific operational challenges and stringent compliance requirements.
Dominant Markets & Segments in Cooling Water Treatment Chemicals Market
The Power Industry stands as a dominant end-user industry within the Cooling Water Treatment Chemicals market, driven by the immense water requirements of thermal power plants for cooling purposes. The global power generation sector's continuous need for reliable and efficient operation necessitates robust water treatment programs to prevent costly downtime caused by scaling, corrosion, and microbial growth. Consequently, the demand for corrosion inhibitors, scale inhibitors, and biocides is exceptionally high. Geographically, Asia Pacific is emerging as a dominant region, propelled by rapid industrial expansion, significant investments in power generation infrastructure, and increasingly stringent environmental regulations across countries like China and India.
Type Segmentation Dominance:
- Corrosion Inhibitors: Essential for protecting metal components in cooling systems from degradation, leading to extended equipment lifespan and reduced maintenance costs. Economic policies promoting industrial longevity and infrastructure development directly influence their demand.
- Scale Inhibitors: Crucial for preventing mineral deposit formation that impairs heat transfer efficiency and increases energy consumption. Growing energy efficiency mandates and rising energy prices are key drivers.
- Biocides: Vital for controlling microbial growth that can lead to biofilm formation, microbially influenced corrosion (MIC), and reduced system performance. Increased focus on public health and stringent water quality standards in industries like food and beverage and pharmaceuticals boost their significance.
- Other Types: Includes dispersants, defoamers, and pH adjusters, which complement primary treatment programs and address specific operational issues.
End-user Industry Dominance:
- Power Industry: The largest consumer due to the sheer volume of water used in cooling towers and condensers. Infrastructure development in power generation and the need to maintain grid stability are key factors.
- Petrochemicals and Oil and Gas: These industries heavily rely on cooling water for refining and processing operations, making them significant consumers of treatment chemicals to ensure system integrity and operational continuity. Stringent safety and environmental regulations further drive demand.
- Steel: Cooling water is indispensable in steel manufacturing processes, particularly in blast furnaces and rolling mills. The demand is linked to global steel production output and technological advancements in manufacturing efficiency.
- Mining & Metallurgy: Cooling systems are vital for various metallurgical processes, including smelting and refining. Infrastructure projects and global demand for minerals and metals directly impact this segment.
- Food and Beverage: Maintaining hygiene and preventing contamination in cooling systems is paramount. Strict food safety regulations and the growing global demand for processed food drive the need for effective biocides and other treatment chemicals.
- Textile and Dyes: Cooling water is used in dyeing and finishing processes. The growth of the textile industry, particularly in developing economies, contributes to the demand, alongside the need for effluent treatment.
Cooling Water Treatment Chemicals Market Product Developments
Recent product developments in the Cooling Water Treatment Chemicals market are sharply focused on enhanced performance, sustainability, and digital integration. Innovations include smart polymer technologies that enable real-time monitoring of treatment efficacy, as demonstrated by Italmatch Chemicals' Smart-Tagged Polymers. This advancement signifies a shift towards digitalization in chemical treatment, offering precise control and optimization for cooling tower applications. Companies are also developing advanced, low-toxicity biocides and biodegradable corrosion inhibitors to meet stringent environmental regulations and reduce the ecological footprint of industrial operations. These developments aim to provide customers with solutions that not only improve operational efficiency and asset longevity but also contribute to water conservation and environmental protection.
Report Scope & Segmentation Analysis
This report provides a comprehensive market segmentation analysis of the Cooling Water Treatment Chemicals market. The segmentation is detailed by Type, encompassing Corrosion Inhibitor, Scale Inhibitor, Biocide, and Other Types. Furthermore, the market is analyzed across key End-user Industries, including the Power Industry, Steel, Mining & Metallurgy, Petrochemicals and Oil and Gas, Food and Beverage, Textile and Dyes, and Other End-user Industries. Each segment is evaluated for its current market size, projected growth rates, and competitive dynamics. The analysis includes granular data for the forecast period, highlighting the specific market penetration and revenue contribution of each segment, allowing stakeholders to identify high-growth areas and understand the competitive landscape within each niche.
- Corrosion Inhibitor Segment: Expected to witness a CAGR of approximately 4.5%, driven by the need to protect critical infrastructure and extend asset life.
- Scale Inhibitor Segment: Projected to grow at a CAGR of around 5.0%, fueled by increasing energy efficiency mandates and the cost-saving benefits of preventing scale formation.
- Biocide Segment: Anticipated to expand at a CAGR of 4.9%, driven by stringent hygiene regulations and the need to prevent microbial contamination in sensitive industries.
- Other Types Segment: Expected to grow moderately, supporting the primary treatment chemicals with specialized functionalities.
Key Drivers of Cooling Water Treatment Chemicals Market Growth
The Cooling Water Treatment Chemicals market is primarily driven by several interconnected factors. Firstly, the escalating global demand for water and energy conservation mandates stringent operational efficiencies across industries, making effective cooling water treatment indispensable. Secondly, increasing industrialization, particularly in developing economies, translates to a higher number of industrial facilities requiring robust cooling systems, thereby boosting demand for treatment chemicals. Thirdly, stricter environmental regulations worldwide are pushing industries towards more sustainable and eco-friendly chemical solutions, fostering innovation in biodegradable and low-toxicity formulations. The aging industrial infrastructure in developed nations also necessitates continuous maintenance and treatment to prevent further degradation, adding to the market's growth.
Challenges in the Cooling Water Treatment Chemicals Market Sector
Despite the positive growth outlook, the Cooling Water Treatment Chemicals market faces several challenges. Regulatory hurdles, including the evolving environmental compliance standards for chemical discharge and usage, can increase operational costs and necessitate significant R&D investments for product reformulation. Supply chain disruptions, exacerbated by geopolitical events and raw material price volatility, can impact product availability and profitability. Intense competitive pressure from both established players and new entrants can lead to price wars and reduced profit margins. Furthermore, the increasing availability and adoption of alternative technologies, such as membrane filtration and advanced non-chemical treatment methods, pose a potential threat to the market's long-term growth trajectory.
Emerging Opportunities in Cooling Water Treatment Chemicals Market
The Cooling Water Treatment Chemicals market presents significant emerging opportunities driven by technological advancements and evolving industry needs. The growing adoption of IoT and AI in industrial water management offers opportunities for smart chemical dosing and predictive maintenance solutions, enhancing treatment efficacy and reducing costs. The increasing focus on water reuse and recycling initiatives creates demand for specialized chemicals that facilitate effective treatment of recycled water streams. Furthermore, the expansion of industries like data centers, which have substantial cooling requirements, presents a new and growing market segment. Emerging economies with rapidly industrializing sectors also represent significant untapped potential for market penetration and growth.
Leading Players in the Cooling Water Treatment Chemicals Market Market
- Ecolab
- Chemtex Speciality Limited
- Thermax Limited
- Nouryon
- Chemtrade Logistics
- Buckman
- Kemira
- DuPont
- Solenis
- Italmatch Chemicals
- Suez
- Veolia
- Albemarle Corporation
- DuBois Chemicals
Key Developments in Cooling Water Treatment Chemicals Market Industry
- October 2022: Italmatch Chemicals company introduced a new Smart-Tagged Polymers brand line specialized for Industrial Water Treatment solutions. It is a cutting-edge smart solution for Cooling Tower applications and a significant step forward in digitalizing chemical treatment performance control.
- February 2022: SUEZ and its partners received the contract for the engineering, procurement, and construction of Wanhua Chemical Group's Penglai sea water reserve osmotic desalination plant.
Strategic Outlook for Cooling Water Treatment Chemicals Market Market
The strategic outlook for the Cooling Water Treatment Chemicals market is characterized by a strong emphasis on innovation, sustainability, and digital integration. Companies that can offer advanced, eco-friendly chemical solutions, coupled with intelligent monitoring and control systems, are poised for significant growth. The increasing stringency of environmental regulations and the global push for water conservation will continue to be major growth catalysts, driving demand for efficient and sustainable treatment programs. Strategic partnerships and acquisitions will remain crucial for companies looking to expand their technological capabilities and market reach. The focus on addressing the unique challenges of diverse end-user industries through customized solutions will be a key differentiator in this competitive landscape.
Cooling Water Treatment Chemicals Market Segmentation
-
1. Type
- 1.1. Corrosion Inhibitor
- 1.2. Scale Inhibitor
- 1.3. Biocide
- 1.4. Other Types
-
2. End-user Industry
- 2.1. Power Industry
- 2.2. Steel, Mining & Metallurgy
- 2.3. Petrochemicals and Oil and Gas
- 2.4. Food and Beverage
- 2.5. Textile and Dyes
- 2.6. Other End-user Industries
Cooling Water Treatment Chemicals Market Segmentation By Geography
-
1. Asia Pacific
- 1.1. China
- 1.2. India
- 1.3. Japan
- 1.4. South Korea
- 1.5. Rest of Asia Pacific
-
2. North America
- 2.1. United States
- 2.2. Canada
- 2.3. Mexico
-
3. Europe
- 3.1. Germany
- 3.2. United Kingdom
- 3.3. France
- 3.4. Italy
- 3.5. Rest of Europe
-
4. South America
- 4.1. Brazil
- 4.2. Argentina
- 4.3. Rest of South America
- 5. Middle East
-
6. Saudi Arabia
- 6.1. South Africa
- 6.2. Rest of Middle East
Cooling Water Treatment Chemicals Market Regional Market Share
Geographic Coverage of Cooling Water Treatment Chemicals Market
Cooling Water Treatment Chemicals Market REPORT HIGHLIGHTS
| Aspects | Details |
|---|---|
| Study Period | 2020-2034 |
| Base Year | 2025 |
| Estimated Year | 2026 |
| Forecast Period | 2026-2034 |
| Historical Period | 2020-2025 |
| Growth Rate | CAGR of 5.8% from 2020-2034 |
| Segmentation |
|
Table of Contents
- 1. Introduction
- 1.1. Research Scope
- 1.2. Market Segmentation
- 1.3. Research Objective
- 1.4. Definitions and Assumptions
- 2. Executive Summary
- 2.1. Market Snapshot
- 3. Market Dynamics
- 3.1. Market Drivers
- 3.2. Market Restrains
- 3.3. Market Trends
- 3.4. Market Opportunities
- 4. Market Factor Analysis
- 4.1. Porters Five Forces
- 4.1.1. Bargaining Power of Suppliers
- 4.1.2. Bargaining Power of Buyers
- 4.1.3. Threat of New Entrants
- 4.1.4. Threat of Substitutes
- 4.1.5. Competitive Rivalry
- 4.2. PESTEL analysis
- 4.3. BCG Analysis
- 4.3.1. Stars (High Growth, High Market Share)
- 4.3.2. Cash Cows (Low Growth, High Market Share)
- 4.3.3. Question Mark (High Growth, Low Market Share)
- 4.3.4. Dogs (Low Growth, Low Market Share)
- 4.4. Ansoff Matrix Analysis
- 4.5. Supply Chain Analysis
- 4.6. Regulatory Landscape
- 4.7. Current Market Potential and Opportunity Assessment (TAM–SAM–SOM Framework)
- 4.8. RAX Analyst Note
- 4.1. Porters Five Forces
- 5. Market Analysis, Insights and Forecast 2021-2033
- 5.1. Market Analysis, Insights and Forecast - by Type
- 5.1.1. Corrosion Inhibitor
- 5.1.2. Scale Inhibitor
- 5.1.3. Biocide
- 5.1.4. Other Types
- 5.2. Market Analysis, Insights and Forecast - by End-user Industry
- 5.2.1. Power Industry
- 5.2.2. Steel, Mining & Metallurgy
- 5.2.3. Petrochemicals and Oil and Gas
- 5.2.4. Food and Beverage
- 5.2.5. Textile and Dyes
- 5.2.6. Other End-user Industries
- 5.3. Market Analysis, Insights and Forecast - by Region
- 5.3.1. Asia Pacific
- 5.3.2. North America
- 5.3.3. Europe
- 5.3.4. South America
- 5.3.5. Middle East
- 5.3.6. Saudi Arabia
- 5.1. Market Analysis, Insights and Forecast - by Type
- 6. Global Cooling Water Treatment Chemicals Market Analysis, Insights and Forecast, 2021-2033
- 6.1. Market Analysis, Insights and Forecast - by Type
- 6.1.1. Corrosion Inhibitor
- 6.1.2. Scale Inhibitor
- 6.1.3. Biocide
- 6.1.4. Other Types
- 6.2. Market Analysis, Insights and Forecast - by End-user Industry
- 6.2.1. Power Industry
- 6.2.2. Steel, Mining & Metallurgy
- 6.2.3. Petrochemicals and Oil and Gas
- 6.2.4. Food and Beverage
- 6.2.5. Textile and Dyes
- 6.2.6. Other End-user Industries
- 6.1. Market Analysis, Insights and Forecast - by Type
- 7. Asia Pacific Cooling Water Treatment Chemicals Market Analysis, Insights and Forecast, 2020-2032
- 7.1. Market Analysis, Insights and Forecast - by Type
- 7.1.1. Corrosion Inhibitor
- 7.1.2. Scale Inhibitor
- 7.1.3. Biocide
- 7.1.4. Other Types
- 7.2. Market Analysis, Insights and Forecast - by End-user Industry
- 7.2.1. Power Industry
- 7.2.2. Steel, Mining & Metallurgy
- 7.2.3. Petrochemicals and Oil and Gas
- 7.2.4. Food and Beverage
- 7.2.5. Textile and Dyes
- 7.2.6. Other End-user Industries
- 7.1. Market Analysis, Insights and Forecast - by Type
- 8. North America Cooling Water Treatment Chemicals Market Analysis, Insights and Forecast, 2020-2032
- 8.1. Market Analysis, Insights and Forecast - by Type
- 8.1.1. Corrosion Inhibitor
- 8.1.2. Scale Inhibitor
- 8.1.3. Biocide
- 8.1.4. Other Types
- 8.2. Market Analysis, Insights and Forecast - by End-user Industry
- 8.2.1. Power Industry
- 8.2.2. Steel, Mining & Metallurgy
- 8.2.3. Petrochemicals and Oil and Gas
- 8.2.4. Food and Beverage
- 8.2.5. Textile and Dyes
- 8.2.6. Other End-user Industries
- 8.1. Market Analysis, Insights and Forecast - by Type
- 9. Europe Cooling Water Treatment Chemicals Market Analysis, Insights and Forecast, 2020-2032
- 9.1. Market Analysis, Insights and Forecast - by Type
- 9.1.1. Corrosion Inhibitor
- 9.1.2. Scale Inhibitor
- 9.1.3. Biocide
- 9.1.4. Other Types
- 9.2. Market Analysis, Insights and Forecast - by End-user Industry
- 9.2.1. Power Industry
- 9.2.2. Steel, Mining & Metallurgy
- 9.2.3. Petrochemicals and Oil and Gas
- 9.2.4. Food and Beverage
- 9.2.5. Textile and Dyes
- 9.2.6. Other End-user Industries
- 9.1. Market Analysis, Insights and Forecast - by Type
- 10. South America Cooling Water Treatment Chemicals Market Analysis, Insights and Forecast, 2020-2032
- 10.1. Market Analysis, Insights and Forecast - by Type
- 10.1.1. Corrosion Inhibitor
- 10.1.2. Scale Inhibitor
- 10.1.3. Biocide
- 10.1.4. Other Types
- 10.2. Market Analysis, Insights and Forecast - by End-user Industry
- 10.2.1. Power Industry
- 10.2.2. Steel, Mining & Metallurgy
- 10.2.3. Petrochemicals and Oil and Gas
- 10.2.4. Food and Beverage
- 10.2.5. Textile and Dyes
- 10.2.6. Other End-user Industries
- 10.1. Market Analysis, Insights and Forecast - by Type
- 11. Middle East Cooling Water Treatment Chemicals Market Analysis, Insights and Forecast, 2020-2032
- 11.1. Market Analysis, Insights and Forecast - by Type
- 11.1.1. Corrosion Inhibitor
- 11.1.2. Scale Inhibitor
- 11.1.3. Biocide
- 11.1.4. Other Types
- 11.2. Market Analysis, Insights and Forecast - by End-user Industry
- 11.2.1. Power Industry
- 11.2.2. Steel, Mining & Metallurgy
- 11.2.3. Petrochemicals and Oil and Gas
- 11.2.4. Food and Beverage
- 11.2.5. Textile and Dyes
- 11.2.6. Other End-user Industries
- 11.1. Market Analysis, Insights and Forecast - by Type
- 12. Saudi Arabia Cooling Water Treatment Chemicals Market Analysis, Insights and Forecast, 2020-2032
- 12.1. Market Analysis, Insights and Forecast - by Type
- 12.1.1. Corrosion Inhibitor
- 12.1.2. Scale Inhibitor
- 12.1.3. Biocide
- 12.1.4. Other Types
- 12.2. Market Analysis, Insights and Forecast - by End-user Industry
- 12.2.1. Power Industry
- 12.2.2. Steel, Mining & Metallurgy
- 12.2.3. Petrochemicals and Oil and Gas
- 12.2.4. Food and Beverage
- 12.2.5. Textile and Dyes
- 12.2.6. Other End-user Industries
- 12.1. Market Analysis, Insights and Forecast - by Type
- 13. Competitive Analysis
- 13.1. Company Profiles
- 13.1.1 Ecolab
- 13.1.1.1. Company Overview
- 13.1.1.2. Products
- 13.1.1.3. Company Financials
- 13.1.1.4. SWOT Analysis
- 13.1.2 Chemtex Speciality Limited
- 13.1.2.1. Company Overview
- 13.1.2.2. Products
- 13.1.2.3. Company Financials
- 13.1.2.4. SWOT Analysis
- 13.1.3 Thermax Limited
- 13.1.3.1. Company Overview
- 13.1.3.2. Products
- 13.1.3.3. Company Financials
- 13.1.3.4. SWOT Analysis
- 13.1.4 Nouryon
- 13.1.4.1. Company Overview
- 13.1.4.2. Products
- 13.1.4.3. Company Financials
- 13.1.4.4. SWOT Analysis
- 13.1.5 Chemtrade Logistics
- 13.1.5.1. Company Overview
- 13.1.5.2. Products
- 13.1.5.3. Company Financials
- 13.1.5.4. SWOT Analysis
- 13.1.6 Buckman
- 13.1.6.1. Company Overview
- 13.1.6.2. Products
- 13.1.6.3. Company Financials
- 13.1.6.4. SWOT Analysis
- 13.1.7 Kemira
- 13.1.7.1. Company Overview
- 13.1.7.2. Products
- 13.1.7.3. Company Financials
- 13.1.7.4. SWOT Analysis
- 13.1.8 DuPont
- 13.1.8.1. Company Overview
- 13.1.8.2. Products
- 13.1.8.3. Company Financials
- 13.1.8.4. SWOT Analysis
- 13.1.9 Solenis
- 13.1.9.1. Company Overview
- 13.1.9.2. Products
- 13.1.9.3. Company Financials
- 13.1.9.4. SWOT Analysis
- 13.1.10 Italmatch Chemicals
- 13.1.10.1. Company Overview
- 13.1.10.2. Products
- 13.1.10.3. Company Financials
- 13.1.10.4. SWOT Analysis
- 13.1.11 Suez
- 13.1.11.1. Company Overview
- 13.1.11.2. Products
- 13.1.11.3. Company Financials
- 13.1.11.4. SWOT Analysis
- 13.1.12 Veolia
- 13.1.12.1. Company Overview
- 13.1.12.2. Products
- 13.1.12.3. Company Financials
- 13.1.12.4. SWOT Analysis
- 13.1.13 Albemarle Corporation
- 13.1.13.1. Company Overview
- 13.1.13.2. Products
- 13.1.13.3. Company Financials
- 13.1.13.4. SWOT Analysis
- 13.1.14 DuBois Chemicals
- 13.1.14.1. Company Overview
- 13.1.14.2. Products
- 13.1.14.3. Company Financials
- 13.1.14.4. SWOT Analysis
- 13.1.1 Ecolab
- 13.2. Market Entropy
- 13.2.1 Company's Key Areas Served
- 13.2.2 Recent Developments
- 13.3. Company Market Share Analysis 2025
- 13.3.1 Top 5 Companies Market Share Analysis
- 13.3.2 Top 3 Companies Market Share Analysis
- 13.4. List of Potential Customers
- 14. Research Methodology
List of Figures
- Figure 1: Global Cooling Water Treatment Chemicals Market Revenue Breakdown (Billion, %) by Region 2025 & 2033
- Figure 2: Global Cooling Water Treatment Chemicals Market Volume Breakdown (K Tons, %) by Region 2025 & 2033
- Figure 3: Asia Pacific Cooling Water Treatment Chemicals Market Revenue (Billion), by Type 2025 & 2033
- Figure 4: Asia Pacific Cooling Water Treatment Chemicals Market Volume (K Tons), by Type 2025 & 2033
- Figure 5: Asia Pacific Cooling Water Treatment Chemicals Market Revenue Share (%), by Type 2025 & 2033
- Figure 6: Asia Pacific Cooling Water Treatment Chemicals Market Volume Share (%), by Type 2025 & 2033
- Figure 7: Asia Pacific Cooling Water Treatment Chemicals Market Revenue (Billion), by End-user Industry 2025 & 2033
- Figure 8: Asia Pacific Cooling Water Treatment Chemicals Market Volume (K Tons), by End-user Industry 2025 & 2033
- Figure 9: Asia Pacific Cooling Water Treatment Chemicals Market Revenue Share (%), by End-user Industry 2025 & 2033
- Figure 10: Asia Pacific Cooling Water Treatment Chemicals Market Volume Share (%), by End-user Industry 2025 & 2033
- Figure 11: Asia Pacific Cooling Water Treatment Chemicals Market Revenue (Billion), by Country 2025 & 2033
- Figure 12: Asia Pacific Cooling Water Treatment Chemicals Market Volume (K Tons), by Country 2025 & 2033
- Figure 13: Asia Pacific Cooling Water Treatment Chemicals Market Revenue Share (%), by Country 2025 & 2033
- Figure 14: Asia Pacific Cooling Water Treatment Chemicals Market Volume Share (%), by Country 2025 & 2033
- Figure 15: North America Cooling Water Treatment Chemicals Market Revenue (Billion), by Type 2025 & 2033
- Figure 16: North America Cooling Water Treatment Chemicals Market Volume (K Tons), by Type 2025 & 2033
- Figure 17: North America Cooling Water Treatment Chemicals Market Revenue Share (%), by Type 2025 & 2033
- Figure 18: North America Cooling Water Treatment Chemicals Market Volume Share (%), by Type 2025 & 2033
- Figure 19: North America Cooling Water Treatment Chemicals Market Revenue (Billion), by End-user Industry 2025 & 2033
- Figure 20: North America Cooling Water Treatment Chemicals Market Volume (K Tons), by End-user Industry 2025 & 2033
- Figure 21: North America Cooling Water Treatment Chemicals Market Revenue Share (%), by End-user Industry 2025 & 2033
- Figure 22: North America Cooling Water Treatment Chemicals Market Volume Share (%), by End-user Industry 2025 & 2033
- Figure 23: North America Cooling Water Treatment Chemicals Market Revenue (Billion), by Country 2025 & 2033
- Figure 24: North America Cooling Water Treatment Chemicals Market Volume (K Tons), by Country 2025 & 2033
- Figure 25: North America Cooling Water Treatment Chemicals Market Revenue Share (%), by Country 2025 & 2033
- Figure 26: North America Cooling Water Treatment Chemicals Market Volume Share (%), by Country 2025 & 2033
- Figure 27: Europe Cooling Water Treatment Chemicals Market Revenue (Billion), by Type 2025 & 2033
- Figure 28: Europe Cooling Water Treatment Chemicals Market Volume (K Tons), by Type 2025 & 2033
- Figure 29: Europe Cooling Water Treatment Chemicals Market Revenue Share (%), by Type 2025 & 2033
- Figure 30: Europe Cooling Water Treatment Chemicals Market Volume Share (%), by Type 2025 & 2033
- Figure 31: Europe Cooling Water Treatment Chemicals Market Revenue (Billion), by End-user Industry 2025 & 2033
- Figure 32: Europe Cooling Water Treatment Chemicals Market Volume (K Tons), by End-user Industry 2025 & 2033
- Figure 33: Europe Cooling Water Treatment Chemicals Market Revenue Share (%), by End-user Industry 2025 & 2033
- Figure 34: Europe Cooling Water Treatment Chemicals Market Volume Share (%), by End-user Industry 2025 & 2033
- Figure 35: Europe Cooling Water Treatment Chemicals Market Revenue (Billion), by Country 2025 & 2033
- Figure 36: Europe Cooling Water Treatment Chemicals Market Volume (K Tons), by Country 2025 & 2033
- Figure 37: Europe Cooling Water Treatment Chemicals Market Revenue Share (%), by Country 2025 & 2033
- Figure 38: Europe Cooling Water Treatment Chemicals Market Volume Share (%), by Country 2025 & 2033
- Figure 39: South America Cooling Water Treatment Chemicals Market Revenue (Billion), by Type 2025 & 2033
- Figure 40: South America Cooling Water Treatment Chemicals Market Volume (K Tons), by Type 2025 & 2033
- Figure 41: South America Cooling Water Treatment Chemicals Market Revenue Share (%), by Type 2025 & 2033
- Figure 42: South America Cooling Water Treatment Chemicals Market Volume Share (%), by Type 2025 & 2033
- Figure 43: South America Cooling Water Treatment Chemicals Market Revenue (Billion), by End-user Industry 2025 & 2033
- Figure 44: South America Cooling Water Treatment Chemicals Market Volume (K Tons), by End-user Industry 2025 & 2033
- Figure 45: South America Cooling Water Treatment Chemicals Market Revenue Share (%), by End-user Industry 2025 & 2033
- Figure 46: South America Cooling Water Treatment Chemicals Market Volume Share (%), by End-user Industry 2025 & 2033
- Figure 47: South America Cooling Water Treatment Chemicals Market Revenue (Billion), by Country 2025 & 2033
- Figure 48: South America Cooling Water Treatment Chemicals Market Volume (K Tons), by Country 2025 & 2033
- Figure 49: South America Cooling Water Treatment Chemicals Market Revenue Share (%), by Country 2025 & 2033
- Figure 50: South America Cooling Water Treatment Chemicals Market Volume Share (%), by Country 2025 & 2033
- Figure 51: Middle East Cooling Water Treatment Chemicals Market Revenue (Billion), by Type 2025 & 2033
- Figure 52: Middle East Cooling Water Treatment Chemicals Market Volume (K Tons), by Type 2025 & 2033
- Figure 53: Middle East Cooling Water Treatment Chemicals Market Revenue Share (%), by Type 2025 & 2033
- Figure 54: Middle East Cooling Water Treatment Chemicals Market Volume Share (%), by Type 2025 & 2033
- Figure 55: Middle East Cooling Water Treatment Chemicals Market Revenue (Billion), by End-user Industry 2025 & 2033
- Figure 56: Middle East Cooling Water Treatment Chemicals Market Volume (K Tons), by End-user Industry 2025 & 2033
- Figure 57: Middle East Cooling Water Treatment Chemicals Market Revenue Share (%), by End-user Industry 2025 & 2033
- Figure 58: Middle East Cooling Water Treatment Chemicals Market Volume Share (%), by End-user Industry 2025 & 2033
- Figure 59: Middle East Cooling Water Treatment Chemicals Market Revenue (Billion), by Country 2025 & 2033
- Figure 60: Middle East Cooling Water Treatment Chemicals Market Volume (K Tons), by Country 2025 & 2033
- Figure 61: Middle East Cooling Water Treatment Chemicals Market Revenue Share (%), by Country 2025 & 2033
- Figure 62: Middle East Cooling Water Treatment Chemicals Market Volume Share (%), by Country 2025 & 2033
- Figure 63: Saudi Arabia Cooling Water Treatment Chemicals Market Revenue (Billion), by Type 2025 & 2033
- Figure 64: Saudi Arabia Cooling Water Treatment Chemicals Market Volume (K Tons), by Type 2025 & 2033
- Figure 65: Saudi Arabia Cooling Water Treatment Chemicals Market Revenue Share (%), by Type 2025 & 2033
- Figure 66: Saudi Arabia Cooling Water Treatment Chemicals Market Volume Share (%), by Type 2025 & 2033
- Figure 67: Saudi Arabia Cooling Water Treatment Chemicals Market Revenue (Billion), by End-user Industry 2025 & 2033
- Figure 68: Saudi Arabia Cooling Water Treatment Chemicals Market Volume (K Tons), by End-user Industry 2025 & 2033
- Figure 69: Saudi Arabia Cooling Water Treatment Chemicals Market Revenue Share (%), by End-user Industry 2025 & 2033
- Figure 70: Saudi Arabia Cooling Water Treatment Chemicals Market Volume Share (%), by End-user Industry 2025 & 2033
- Figure 71: Saudi Arabia Cooling Water Treatment Chemicals Market Revenue (Billion), by Country 2025 & 2033
- Figure 72: Saudi Arabia Cooling Water Treatment Chemicals Market Volume (K Tons), by Country 2025 & 2033
- Figure 73: Saudi Arabia Cooling Water Treatment Chemicals Market Revenue Share (%), by Country 2025 & 2033
- Figure 74: Saudi Arabia Cooling Water Treatment Chemicals Market Volume Share (%), by Country 2025 & 2033
List of Tables
- Table 1: Global Cooling Water Treatment Chemicals Market Revenue Billion Forecast, by Type 2020 & 2033
- Table 2: Global Cooling Water Treatment Chemicals Market Volume K Tons Forecast, by Type 2020 & 2033
- Table 3: Global Cooling Water Treatment Chemicals Market Revenue Billion Forecast, by End-user Industry 2020 & 2033
- Table 4: Global Cooling Water Treatment Chemicals Market Volume K Tons Forecast, by End-user Industry 2020 & 2033
- Table 5: Global Cooling Water Treatment Chemicals Market Revenue Billion Forecast, by Region 2020 & 2033
- Table 6: Global Cooling Water Treatment Chemicals Market Volume K Tons Forecast, by Region 2020 & 2033
- Table 7: Global Cooling Water Treatment Chemicals Market Revenue Billion Forecast, by Type 2020 & 2033
- Table 8: Global Cooling Water Treatment Chemicals Market Volume K Tons Forecast, by Type 2020 & 2033
- Table 9: Global Cooling Water Treatment Chemicals Market Revenue Billion Forecast, by End-user Industry 2020 & 2033
- Table 10: Global Cooling Water Treatment Chemicals Market Volume K Tons Forecast, by End-user Industry 2020 & 2033
- Table 11: Global Cooling Water Treatment Chemicals Market Revenue Billion Forecast, by Country 2020 & 2033
- Table 12: Global Cooling Water Treatment Chemicals Market Volume K Tons Forecast, by Country 2020 & 2033
- Table 13: China Cooling Water Treatment Chemicals Market Revenue (Billion) Forecast, by Application 2020 & 2033
- Table 14: China Cooling Water Treatment Chemicals Market Volume (K Tons) Forecast, by Application 2020 & 2033
- Table 15: India Cooling Water Treatment Chemicals Market Revenue (Billion) Forecast, by Application 2020 & 2033
- Table 16: India Cooling Water Treatment Chemicals Market Volume (K Tons) Forecast, by Application 2020 & 2033
- Table 17: Japan Cooling Water Treatment Chemicals Market Revenue (Billion) Forecast, by Application 2020 & 2033
- Table 18: Japan Cooling Water Treatment Chemicals Market Volume (K Tons) Forecast, by Application 2020 & 2033
- Table 19: South Korea Cooling Water Treatment Chemicals Market Revenue (Billion) Forecast, by Application 2020 & 2033
- Table 20: South Korea Cooling Water Treatment Chemicals Market Volume (K Tons) Forecast, by Application 2020 & 2033
- Table 21: Rest of Asia Pacific Cooling Water Treatment Chemicals Market Revenue (Billion) Forecast, by Application 2020 & 2033
- Table 22: Rest of Asia Pacific Cooling Water Treatment Chemicals Market Volume (K Tons) Forecast, by Application 2020 & 2033
- Table 23: Global Cooling Water Treatment Chemicals Market Revenue Billion Forecast, by Type 2020 & 2033
- Table 24: Global Cooling Water Treatment Chemicals Market Volume K Tons Forecast, by Type 2020 & 2033
- Table 25: Global Cooling Water Treatment Chemicals Market Revenue Billion Forecast, by End-user Industry 2020 & 2033
- Table 26: Global Cooling Water Treatment Chemicals Market Volume K Tons Forecast, by End-user Industry 2020 & 2033
- Table 27: Global Cooling Water Treatment Chemicals Market Revenue Billion Forecast, by Country 2020 & 2033
- Table 28: Global Cooling Water Treatment Chemicals Market Volume K Tons Forecast, by Country 2020 & 2033
- Table 29: United States Cooling Water Treatment Chemicals Market Revenue (Billion) Forecast, by Application 2020 & 2033
- Table 30: United States Cooling Water Treatment Chemicals Market Volume (K Tons) Forecast, by Application 2020 & 2033
- Table 31: Canada Cooling Water Treatment Chemicals Market Revenue (Billion) Forecast, by Application 2020 & 2033
- Table 32: Canada Cooling Water Treatment Chemicals Market Volume (K Tons) Forecast, by Application 2020 & 2033
- Table 33: Mexico Cooling Water Treatment Chemicals Market Revenue (Billion) Forecast, by Application 2020 & 2033
- Table 34: Mexico Cooling Water Treatment Chemicals Market Volume (K Tons) Forecast, by Application 2020 & 2033
- Table 35: Global Cooling Water Treatment Chemicals Market Revenue Billion Forecast, by Type 2020 & 2033
- Table 36: Global Cooling Water Treatment Chemicals Market Volume K Tons Forecast, by Type 2020 & 2033
- Table 37: Global Cooling Water Treatment Chemicals Market Revenue Billion Forecast, by End-user Industry 2020 & 2033
- Table 38: Global Cooling Water Treatment Chemicals Market Volume K Tons Forecast, by End-user Industry 2020 & 2033
- Table 39: Global Cooling Water Treatment Chemicals Market Revenue Billion Forecast, by Country 2020 & 2033
- Table 40: Global Cooling Water Treatment Chemicals Market Volume K Tons Forecast, by Country 2020 & 2033
- Table 41: Germany Cooling Water Treatment Chemicals Market Revenue (Billion) Forecast, by Application 2020 & 2033
- Table 42: Germany Cooling Water Treatment Chemicals Market Volume (K Tons) Forecast, by Application 2020 & 2033
- Table 43: United Kingdom Cooling Water Treatment Chemicals Market Revenue (Billion) Forecast, by Application 2020 & 2033
- Table 44: United Kingdom Cooling Water Treatment Chemicals Market Volume (K Tons) Forecast, by Application 2020 & 2033
- Table 45: France Cooling Water Treatment Chemicals Market Revenue (Billion) Forecast, by Application 2020 & 2033
- Table 46: France Cooling Water Treatment Chemicals Market Volume (K Tons) Forecast, by Application 2020 & 2033
- Table 47: Italy Cooling Water Treatment Chemicals Market Revenue (Billion) Forecast, by Application 2020 & 2033
- Table 48: Italy Cooling Water Treatment Chemicals Market Volume (K Tons) Forecast, by Application 2020 & 2033
- Table 49: Rest of Europe Cooling Water Treatment Chemicals Market Revenue (Billion) Forecast, by Application 2020 & 2033
- Table 50: Rest of Europe Cooling Water Treatment Chemicals Market Volume (K Tons) Forecast, by Application 2020 & 2033
- Table 51: Global Cooling Water Treatment Chemicals Market Revenue Billion Forecast, by Type 2020 & 2033
- Table 52: Global Cooling Water Treatment Chemicals Market Volume K Tons Forecast, by Type 2020 & 2033
- Table 53: Global Cooling Water Treatment Chemicals Market Revenue Billion Forecast, by End-user Industry 2020 & 2033
- Table 54: Global Cooling Water Treatment Chemicals Market Volume K Tons Forecast, by End-user Industry 2020 & 2033
- Table 55: Global Cooling Water Treatment Chemicals Market Revenue Billion Forecast, by Country 2020 & 2033
- Table 56: Global Cooling Water Treatment Chemicals Market Volume K Tons Forecast, by Country 2020 & 2033
- Table 57: Brazil Cooling Water Treatment Chemicals Market Revenue (Billion) Forecast, by Application 2020 & 2033
- Table 58: Brazil Cooling Water Treatment Chemicals Market Volume (K Tons) Forecast, by Application 2020 & 2033
- Table 59: Argentina Cooling Water Treatment Chemicals Market Revenue (Billion) Forecast, by Application 2020 & 2033
- Table 60: Argentina Cooling Water Treatment Chemicals Market Volume (K Tons) Forecast, by Application 2020 & 2033
- Table 61: Rest of South America Cooling Water Treatment Chemicals Market Revenue (Billion) Forecast, by Application 2020 & 2033
- Table 62: Rest of South America Cooling Water Treatment Chemicals Market Volume (K Tons) Forecast, by Application 2020 & 2033
- Table 63: Global Cooling Water Treatment Chemicals Market Revenue Billion Forecast, by Type 2020 & 2033
- Table 64: Global Cooling Water Treatment Chemicals Market Volume K Tons Forecast, by Type 2020 & 2033
- Table 65: Global Cooling Water Treatment Chemicals Market Revenue Billion Forecast, by End-user Industry 2020 & 2033
- Table 66: Global Cooling Water Treatment Chemicals Market Volume K Tons Forecast, by End-user Industry 2020 & 2033
- Table 67: Global Cooling Water Treatment Chemicals Market Revenue Billion Forecast, by Country 2020 & 2033
- Table 68: Global Cooling Water Treatment Chemicals Market Volume K Tons Forecast, by Country 2020 & 2033
- Table 69: Global Cooling Water Treatment Chemicals Market Revenue Billion Forecast, by Type 2020 & 2033
- Table 70: Global Cooling Water Treatment Chemicals Market Volume K Tons Forecast, by Type 2020 & 2033
- Table 71: Global Cooling Water Treatment Chemicals Market Revenue Billion Forecast, by End-user Industry 2020 & 2033
- Table 72: Global Cooling Water Treatment Chemicals Market Volume K Tons Forecast, by End-user Industry 2020 & 2033
- Table 73: Global Cooling Water Treatment Chemicals Market Revenue Billion Forecast, by Country 2020 & 2033
- Table 74: Global Cooling Water Treatment Chemicals Market Volume K Tons Forecast, by Country 2020 & 2033
- Table 75: South Africa Cooling Water Treatment Chemicals Market Revenue (Billion) Forecast, by Application 2020 & 2033
- Table 76: South Africa Cooling Water Treatment Chemicals Market Volume (K Tons) Forecast, by Application 2020 & 2033
- Table 77: Rest of Middle East Cooling Water Treatment Chemicals Market Revenue (Billion) Forecast, by Application 2020 & 2033
- Table 78: Rest of Middle East Cooling Water Treatment Chemicals Market Volume (K Tons) Forecast, by Application 2020 & 2033
Frequently Asked Questions
1. What is the projected Compound Annual Growth Rate (CAGR) of the Cooling Water Treatment Chemicals Market?
The projected CAGR is approximately 5.8%.
2. Which companies are prominent players in the Cooling Water Treatment Chemicals Market?
Key companies in the market include Ecolab, Chemtex Speciality Limited, Thermax Limited, Nouryon, Chemtrade Logistics, Buckman, Kemira, DuPont, Solenis, Italmatch Chemicals, Suez, Veolia, Albemarle Corporation, DuBois Chemicals.
3. What are the main segments of the Cooling Water Treatment Chemicals Market?
The market segments include Type, End-user Industry.
4. Can you provide details about the market size?
The market size is estimated to be USD 11.8 Billion as of 2022.
5. What are some drivers contributing to market growth?
Accelerating Growth of the Power Industry; Growing Popularity of Zero-liquid Blowdown.
6. What are the notable trends driving market growth?
Power Industry to Dominate the Market.
7. Are there any restraints impacting market growth?
Lack of Awareness about Cooling Water Treatment; Increasing Popularity of Chlorine Alternatives.
8. Can you provide examples of recent developments in the market?
October 2022: Italmatch Chemicals company introduced a new Smart-Tagged Polymers brand line specialized for Industrial Water Treatment solutions. It is a cutting-edge smart solution for Cooling Tower applications and a significant step forward in digitalizing chemical treatment performance control.
9. What pricing options are available for accessing the report?
Pricing options include single-user, multi-user, and enterprise licenses priced at USD 3,950, USD 4,950, and USD 6,950 respectively.
10. Is the market size provided in terms of value or volume?
The market size is provided in terms of value, measured in Billion and volume, measured in K Tons.
11. Are there any specific market keywords associated with the report?
Yes, the market keyword associated with the report is "Cooling Water Treatment Chemicals Market," which aids in identifying and referencing the specific market segment covered.
12. How do I determine which pricing option suits my needs best?
The pricing options vary based on user requirements and access needs. Individual users may opt for single-user licenses, while businesses requiring broader access may choose multi-user or enterprise licenses for cost-effective access to the report.
13. Are there any additional resources or data provided in the Cooling Water Treatment Chemicals Market report?
While the report offers comprehensive insights, it's advisable to review the specific contents or supplementary materials provided to ascertain if additional resources or data are available.
14. How can I stay updated on further developments or reports in the Cooling Water Treatment Chemicals Market?
To stay informed about further developments, trends, and reports in the Cooling Water Treatment Chemicals Market, consider subscribing to industry newsletters, following relevant companies and organizations, or regularly checking reputable industry news sources and publications.
Methodology
Step 1 - Identification of Relevant Samples Size from Population Database


Step 2 - Approaches for Defining Global Market Size (Value, Volume* & Price*)

Note*: In applicable scenarios
Step 3 - Data Sources
Primary Research
- Web Analytics
- Survey Reports
- Research Institute
- Latest Research Reports
- Opinion Leaders
Secondary Research
- Annual Reports
- White Paper
- Latest Press Release
- Industry Association
- Paid Database
- Investor Presentations

Step 4 - Data Triangulation
Involves using different sources of information in order to increase the validity of a study
These sources are likely to be stakeholders in a program - participants, other researchers, program staff, other community members, and so on.
Then we put all data in single framework & apply various statistical tools to find out the dynamic on the market.
During the analysis stage, feedback from the stakeholder groups would be compared to determine areas of agreement as well as areas of divergence