

Key Insights
The global Corrective Contact Lens market is poised for significant expansion, projected to reach USD 11.63 billion by 2025. This growth trajectory is fueled by a projected Compound Annual Growth Rate (CAGR) of 3.92% from 2019 to 2033. A primary driver for this sustained upward trend is the increasing prevalence of refractive errors globally, coupled with a rising consumer preference for convenient and aesthetically pleasing vision correction alternatives to traditional eyeglasses. Advances in lens materials, such as enhanced breathability and moisture retention in soft contact lenses, alongside the development of specialized lenses for conditions like astigmatism and presbyopia, are further stimulating demand. The expanding healthcare infrastructure, particularly in emerging economies, and growing awareness campaigns about eye health also contribute to market penetration.
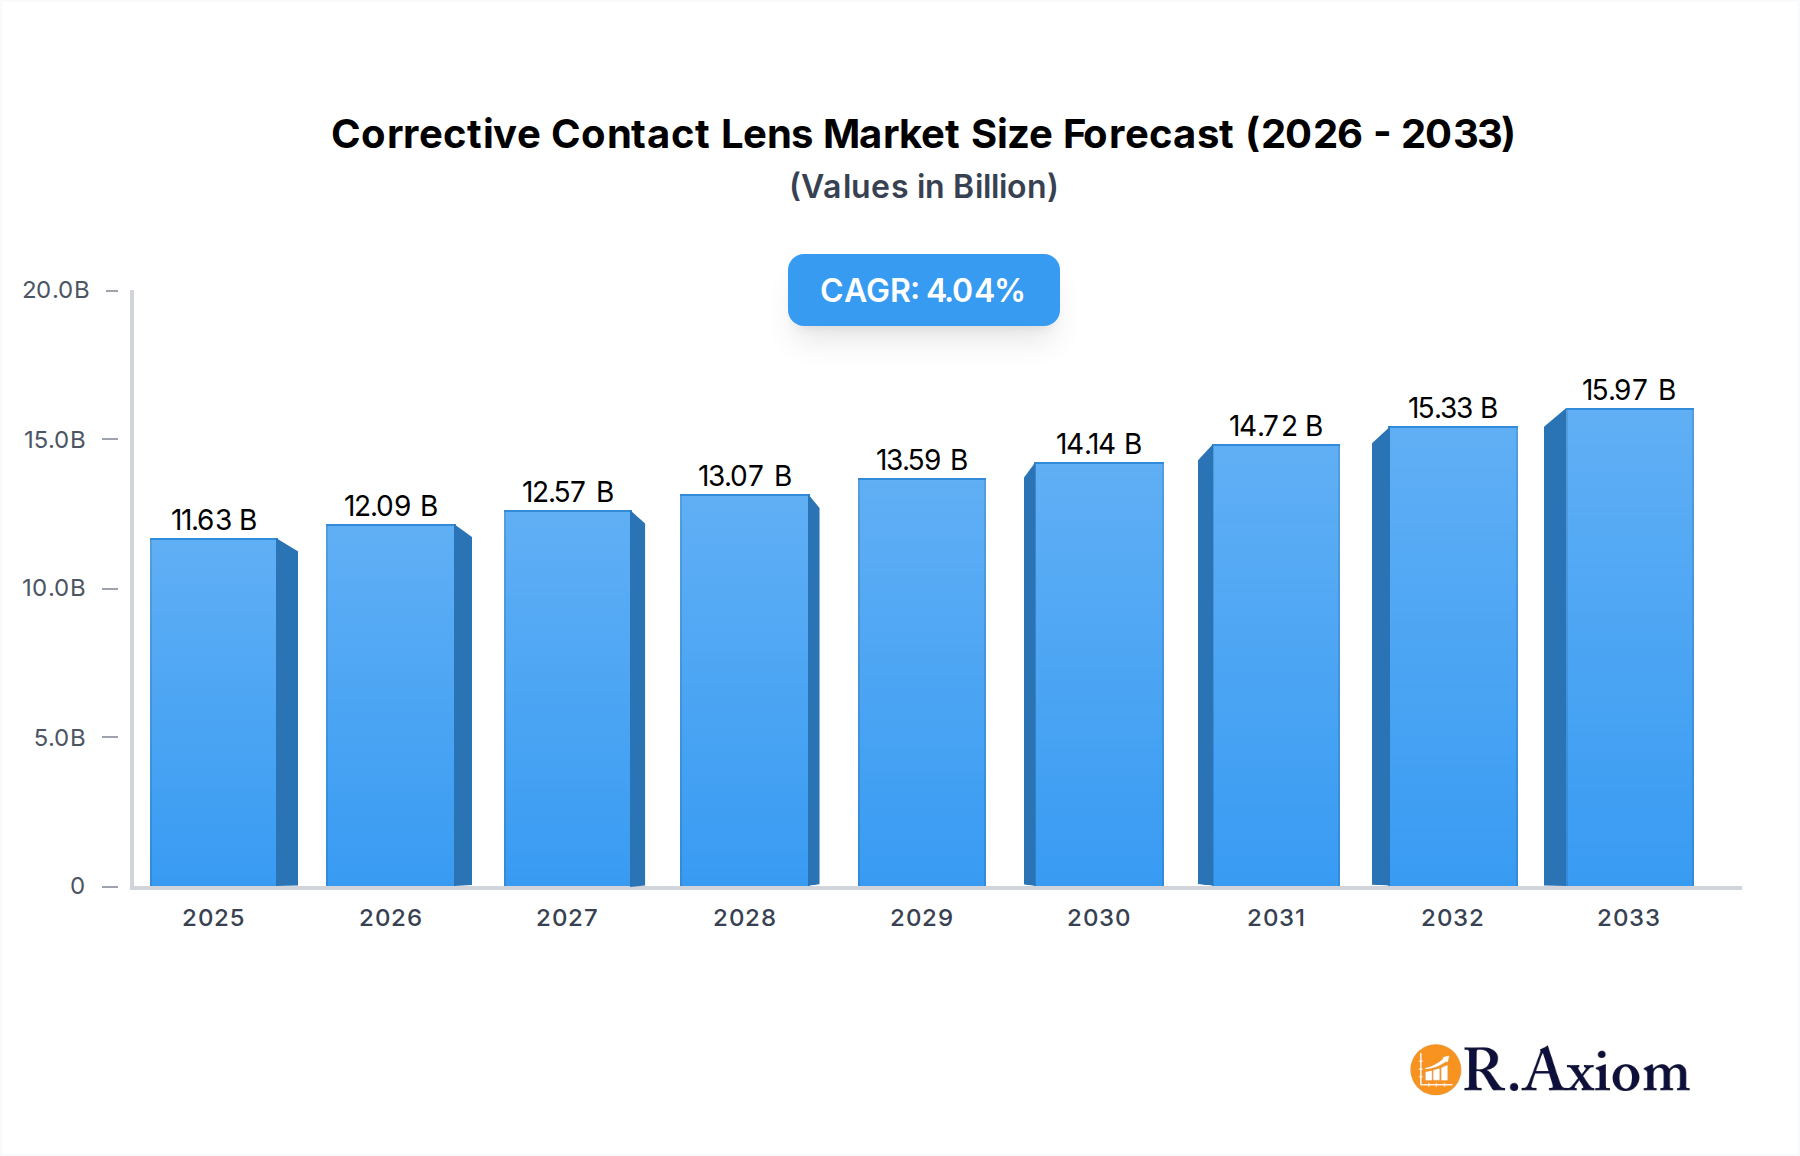
Corrective Contact Lens Market Size (In Billion)
The market segmentation reveals a robust demand across various applications, with hospitals and eye clinics leading adoption due to specialized fittings and medical supervision. Eyeglass stores and online sales channels are also experiencing considerable growth, reflecting increased accessibility and consumer confidence in purchasing corrective lenses. Soft contact lenses dominate the types segment, owing to their comfort and ease of use. However, rigid gas permeable (RGP) and hybrid contact lenses are witnessing steady growth, catering to specific visual needs and improving patient outcomes. Key industry players like CooperVision, Johnson & Johnson, and Novartis are heavily invested in research and development, introducing innovative products and expanding their global reach, further propelling the market forward despite potential challenges related to disposable income fluctuations and the adoption of alternative vision correction technologies like refractive surgery.

Corrective Contact Lens Company Market Share
This in-depth report provides a detailed analysis of the global corrective contact lens market, offering critical insights into market dynamics, emerging trends, and future projections. With a study period spanning from 2019 to 2033, a base year of 2025, and a forecast period extending from 2025 to 2033, this analysis leverages historical data from 2019–2024 to provide actionable intelligence for industry stakeholders. The market is projected to witness substantial growth, driven by technological advancements, increasing prevalence of refractive errors, and evolving consumer preferences.
Corrective Contact Lens Market Concentration & Innovation
The global corrective contact lens market exhibits a moderate to high level of concentration, with key players like CooperVision, Johnson & Johnson, and Novartis holding significant market shares. Innovations in material science, such as advanced hydrogels and silicone hydrogels, are continuously improving lens comfort, oxygen permeability, and wearer satisfaction. The development of specialized lenses for conditions like astigmatism and presbyopia further fuels innovation. Regulatory frameworks, while stringent, are evolving to accommodate novel product introductions and therapeutic applications. Product substitutes, primarily eyeglasses, remain a significant competitive factor, but the convenience and aesthetic appeal of contact lenses continue to drive adoption. End-user trends indicate a growing demand for daily disposable lenses, multifocal designs, and lenses offering UV protection. Mergers and acquisitions (M&A) activities, though not consistently at billion-dollar valuations, are strategic moves to consolidate market presence, acquire innovative technologies, and expand product portfolios. For instance, strategic acquisitions in specialized lens segments could represent transactions valued in the hundreds of millions. The overall market is characterized by a dynamic interplay between established giants and agile innovators, with a constant drive towards enhanced vision correction and ocular health.
Corrective Contact Lens Industry Trends & Insights
The corrective contact lens industry is on a trajectory of robust expansion, fueled by a confluence of compelling market growth drivers. The escalating global prevalence of refractive errors, including myopia, hyperopia, and astigmatism, directly translates into an ever-increasing demand for effective vision correction solutions. This demographic shift, coupled with an aging population experiencing presbyopia, presents a sustained market opportunity. Technological disruptions are profoundly reshaping the landscape. Innovations in biomaterials, such as advanced silicone hydrogels and novel polymers, are enabling the development of lenses with superior oxygen permeability, extended wear capabilities, and enhanced comfort, significantly improving patient compliance and satisfaction. The integration of digital technologies, including smart contact lenses with embedded sensors for diagnostic purposes and augmented reality integration, represents a futuristic frontier promising to revolutionize eye care. Consumer preferences are increasingly leaning towards convenience and aesthetic appeal. The surge in popularity of daily disposable lenses, offering unparalleled hygiene and ease of use, is a testament to this trend. Furthermore, the demand for multifocal and toric lenses to address complex refractive needs is rising. The competitive dynamics are intensifying, with companies investing heavily in research and development to maintain a competitive edge. The market penetration of corrective contact lenses, while already significant, continues to grow as awareness of their benefits and accessibility increases, projected to reach over twenty billion dollars in market size. The Compound Annual Growth Rate (CAGR) is estimated to be a healthy seven percent, indicating sustained and significant expansion. Online sales channels are democratizing access, allowing for wider reach and increased market penetration across diverse geographical regions. The focus on personalized vision correction, catering to individual eye health and lifestyle needs, is also becoming a pivotal trend, driving further innovation and market segmentation.
Dominant Markets & Segments in Corrective Contact Lens
The dominance within the corrective contact lens market is characterized by regional strengths, specific application segments, and prevalent lens types. Regionally, North America and Europe currently hold a significant market share, driven by high disposable incomes, advanced healthcare infrastructure, and a strong emphasis on ocular health. However, the Asia-Pacific region is emerging as a powerhouse, propelled by rapid economic development, increasing awareness of eye care, and a burgeoning middle class. Economic policies in these developing nations are fostering greater access to healthcare solutions, including corrective contact lenses. Infrastructure development, such as the expansion of eye clinics and optical retail chains, is further supporting market growth.
Within the Application segment, Eye Clinics are a dominant channel, providing expert consultations, fittings, and prescription services, contributing a substantial market share estimated at over ten billion dollars. Hospitals also play a role, particularly for post-surgical or complex cases. Eyeglasses Stores are a traditional and widespread outlet, offering a wide range of contact lens options alongside spectacles, with a market share also in the ten billion dollar range. Online Sales are experiencing exponential growth, projected to reach over five billion dollars in market value by the forecast period, offering convenience and competitive pricing, thereby expanding market reach significantly.
In terms of Types, Soft Contact Lenses command the largest market share, estimated at over twenty-five billion dollars, due to their comfort, ease of wear, and wide availability for various refractive errors. Rigid Gas Permeable (RGP) lenses, while a smaller segment, are crucial for specific conditions like keratoconus and astigmatism, with a market share in the hundreds of millions. Hybrid Contact Lenses, combining the benefits of both soft and rigid lenses, are a growing niche, offering a unique solution for complex visual needs and contributing a market share in the hundreds of millions. The key drivers for dominance in these segments include technological advancements in lens materials, the increasing prevalence of specific eye conditions, and targeted marketing strategies by key industry players.
Corrective Contact Lens Product Developments
Product developments in the corrective contact lens market are centered on enhancing wearer experience and addressing a broader spectrum of visual impairments. Innovations in silicone hydrogel materials are yielding lenses with unprecedented oxygen permeability, extending comfortable wear time and improving ocular health. The proliferation of daily disposable lenses offers superior hygiene and convenience. Furthermore, advancements in multifocal and toric lens designs are providing more precise vision correction for presbyopia and astigmatism, respectively. Competitive advantages are derived from superior comfort, extended wearability, advanced optical designs for sharper vision, and specialized formulations for sensitive eyes.
Report Scope & Segmentation Analysis
This report meticulously analyzes the global corrective contact lens market across key segments. Application:
- Hospital: This segment, while smaller, caters to specialized needs and complex cases, with projected market growth in the hundreds of millions.
- Eye Clinic: The dominant application segment, offering expert fittings and personalized care, with estimated market growth exceeding five billion dollars.
- Eyeglasses Store: A significant retail channel, providing accessibility and a wide product range, with projected market growth in the billions.
- Online Sales: Experiencing rapid expansion, driven by convenience and accessibility, with projected market growth in the billions.
Types:
- Rigid Contact Lens: A niche but vital segment for specific optical corrections, with projected market growth in the hundreds of millions.
- Soft Contact Lens: The largest segment by volume and value, driven by comfort and widespread adoption, with projected market growth in the tens of billions.
- Hybrid Contact Lens: An innovative segment offering a blend of benefits, with projected market growth in the hundreds of millions.
Key Drivers of Corrective Contact Lens Growth
The corrective contact lens market is propelled by several key drivers. The escalating global incidence of myopia and other refractive errors, particularly among younger demographics, creates a sustained demand. Technological advancements in material science, leading to more comfortable, breathable, and durable lenses, are a significant catalyst. The increasing adoption of daily disposable lenses enhances convenience and compliance. Furthermore, a growing awareness of ocular health and the aesthetic advantages of contact lenses over eyeglasses contribute to market expansion. Favorable regulatory pathways for innovative lens designs also play a crucial role.
Challenges in the Corrective Contact Lens Sector
Despite robust growth, the corrective contact lens sector faces several challenges. Stringent regulatory approval processes for new materials and designs can lead to prolonged market entry timelines. Counterfeit products and unregulated online sales pose risks to consumer safety and brand integrity. The high cost of specialized lenses, such as those for astigmatism or presbyopia, can be a barrier to adoption for some segments of the population. Moreover, issues related to supply chain disruptions and the availability of raw materials can impact production and distribution. Intense competition and pricing pressures among manufacturers also present a restraint.
Emerging Opportunities in Corrective Contact Lens
Emerging opportunities lie in the development of myopia management contact lenses, addressing the growing concern of progressive myopia in children. Advancements in smart contact lenses with integrated sensors for continuous glucose monitoring or drug delivery present transformative potential. The expansion into emerging economies with a growing middle class and increasing disposable income offers significant untapped market potential. Furthermore, the demand for cosmetic contact lenses, often overlooked in the corrective lens discourse, represents a synergistic market. Personalized lens designs tailored to individual eye anatomies and lifestyles are another avenue for growth.
Leading Players in the Corrective Contact Lens Market
- CooperVision
- Johnson & Johnson
- Novartis
- Bausch Health
- Carl Zeiss
- Contamac
- Essilor International
- HOYA
- Menicon
- SynergEyes
- UltraVision CLPL
- Shanghai Hydron Contact Lens Optics (Ginko International)
Key Developments in Corrective Contact Lens Industry
- 2023 Q4: Launch of novel silicone hydrogel materials offering enhanced wettability and extended wear comfort.
- 2023 Q3: Significant investment by a major player in R&D for myopia control contact lenses.
- 2023 Q2: Introduction of advanced diagnostic tools facilitating more precise contact lens fitting and patient outcomes.
- 2023 Q1: Strategic acquisition by a leading company to bolster its portfolio in specialty contact lenses.
- 2022: Widespread adoption of new online prescription verification systems, enhancing safety and accessibility of online sales.
Strategic Outlook for Corrective Contact Lens Market
The strategic outlook for the corrective contact lens market is exceptionally positive. Continued innovation in material science and optical design will drive the development of next-generation lenses offering superior vision correction, comfort, and ocular health benefits. The growing focus on myopia management presents a substantial growth catalyst. The increasing penetration of online sales channels, coupled with a rising global awareness of eye care, will expand market reach. Strategic partnerships and potential acquisitions will further consolidate market leadership and foster innovation, paving the way for a dynamic and expanding future for corrective contact lenses.
Corrective Contact Lens Segmentation
-
1. Application
- 1.1. Hospital
- 1.2. Eye Clinic
- 1.3. Eyeglasses Store
- 1.4. Online Sales
-
2. Types
- 2.1. Rigid Contact Lens
- 2.2. Soft Contact Lens
- 2.3. Hybrid Contact Lens
Corrective Contact Lens Segmentation By Geography
-
1. North America
- 1.1. United States
- 1.2. Canada
- 1.3. Mexico
-
2. South America
- 2.1. Brazil
- 2.2. Argentina
- 2.3. Rest of South America
-
3. Europe
- 3.1. United Kingdom
- 3.2. Germany
- 3.3. France
- 3.4. Italy
- 3.5. Spain
- 3.6. Russia
- 3.7. Benelux
- 3.8. Nordics
- 3.9. Rest of Europe
-
4. Middle East & Africa
- 4.1. Turkey
- 4.2. Israel
- 4.3. GCC
- 4.4. North Africa
- 4.5. South Africa
- 4.6. Rest of Middle East & Africa
-
5. Asia Pacific
- 5.1. China
- 5.2. India
- 5.3. Japan
- 5.4. South Korea
- 5.5. ASEAN
- 5.6. Oceania
- 5.7. Rest of Asia Pacific

Corrective Contact Lens Regional Market Share
Geographic Coverage of Corrective Contact Lens
Corrective Contact Lens REPORT HIGHLIGHTS
| Aspects | Details |
|---|---|
| Study Period | 2020-2034 |
| Base Year | 2025 |
| Estimated Year | 2026 |
| Forecast Period | 2026-2034 |
| Historical Period | 2020-2025 |
| Growth Rate | CAGR of 3.9% from 2020-2034 |
| Segmentation |
|
Table of Contents
- 1. Introduction
- 1.1. Research Scope
- 1.2. Market Segmentation
- 1.3. Research Objective
- 1.4. Definitions and Assumptions
- 2. Executive Summary
- 2.1. Market Snapshot
- 3. Market Dynamics
- 3.1. Market Drivers
- 3.2. Market Restrains
- 3.3. Market Trends
- 3.4. Market Opportunities
- 4. Market Factor Analysis
- 4.1. Porters Five Forces
- 4.1.1. Bargaining Power of Suppliers
- 4.1.2. Bargaining Power of Buyers
- 4.1.3. Threat of New Entrants
- 4.1.4. Threat of Substitutes
- 4.1.5. Competitive Rivalry
- 4.2. PESTEL analysis
- 4.3. BCG Analysis
- 4.3.1. Stars (High Growth, High Market Share)
- 4.3.2. Cash Cows (Low Growth, High Market Share)
- 4.3.3. Question Mark (High Growth, Low Market Share)
- 4.3.4. Dogs (Low Growth, Low Market Share)
- 4.4. Ansoff Matrix Analysis
- 4.5. Supply Chain Analysis
- 4.6. Regulatory Landscape
- 4.7. Current Market Potential and Opportunity Assessment (TAM–SAM–SOM Framework)
- 4.8. RAX Analyst Note
- 4.1. Porters Five Forces
- 5. Market Analysis, Insights and Forecast 2021-2033
- 5.1. Market Analysis, Insights and Forecast - by Application
- 5.1.1. Hospital
- 5.1.2. Eye Clinic
- 5.1.3. Eyeglasses Store
- 5.1.4. Online Sales
- 5.2. Market Analysis, Insights and Forecast - by Types
- 5.2.1. Rigid Contact Lens
- 5.2.2. Soft Contact Lens
- 5.2.3. Hybrid Contact Lens
- 5.3. Market Analysis, Insights and Forecast - by Region
- 5.3.1. North America
- 5.3.2. South America
- 5.3.3. Europe
- 5.3.4. Middle East & Africa
- 5.3.5. Asia Pacific
- 5.1. Market Analysis, Insights and Forecast - by Application
- 6. Global Corrective Contact Lens Analysis, Insights and Forecast, 2021-2033
- 6.1. Market Analysis, Insights and Forecast - by Application
- 6.1.1. Hospital
- 6.1.2. Eye Clinic
- 6.1.3. Eyeglasses Store
- 6.1.4. Online Sales
- 6.2. Market Analysis, Insights and Forecast - by Types
- 6.2.1. Rigid Contact Lens
- 6.2.2. Soft Contact Lens
- 6.2.3. Hybrid Contact Lens
- 6.1. Market Analysis, Insights and Forecast - by Application
- 7. North America Corrective Contact Lens Analysis, Insights and Forecast, 2020-2032
- 7.1. Market Analysis, Insights and Forecast - by Application
- 7.1.1. Hospital
- 7.1.2. Eye Clinic
- 7.1.3. Eyeglasses Store
- 7.1.4. Online Sales
- 7.2. Market Analysis, Insights and Forecast - by Types
- 7.2.1. Rigid Contact Lens
- 7.2.2. Soft Contact Lens
- 7.2.3. Hybrid Contact Lens
- 7.1. Market Analysis, Insights and Forecast - by Application
- 8. South America Corrective Contact Lens Analysis, Insights and Forecast, 2020-2032
- 8.1. Market Analysis, Insights and Forecast - by Application
- 8.1.1. Hospital
- 8.1.2. Eye Clinic
- 8.1.3. Eyeglasses Store
- 8.1.4. Online Sales
- 8.2. Market Analysis, Insights and Forecast - by Types
- 8.2.1. Rigid Contact Lens
- 8.2.2. Soft Contact Lens
- 8.2.3. Hybrid Contact Lens
- 8.1. Market Analysis, Insights and Forecast - by Application
- 9. Europe Corrective Contact Lens Analysis, Insights and Forecast, 2020-2032
- 9.1. Market Analysis, Insights and Forecast - by Application
- 9.1.1. Hospital
- 9.1.2. Eye Clinic
- 9.1.3. Eyeglasses Store
- 9.1.4. Online Sales
- 9.2. Market Analysis, Insights and Forecast - by Types
- 9.2.1. Rigid Contact Lens
- 9.2.2. Soft Contact Lens
- 9.2.3. Hybrid Contact Lens
- 9.1. Market Analysis, Insights and Forecast - by Application
- 10. Middle East & Africa Corrective Contact Lens Analysis, Insights and Forecast, 2020-2032
- 10.1. Market Analysis, Insights and Forecast - by Application
- 10.1.1. Hospital
- 10.1.2. Eye Clinic
- 10.1.3. Eyeglasses Store
- 10.1.4. Online Sales
- 10.2. Market Analysis, Insights and Forecast - by Types
- 10.2.1. Rigid Contact Lens
- 10.2.2. Soft Contact Lens
- 10.2.3. Hybrid Contact Lens
- 10.1. Market Analysis, Insights and Forecast - by Application
- 11. Asia Pacific Corrective Contact Lens Analysis, Insights and Forecast, 2020-2032
- 11.1. Market Analysis, Insights and Forecast - by Application
- 11.1.1. Hospital
- 11.1.2. Eye Clinic
- 11.1.3. Eyeglasses Store
- 11.1.4. Online Sales
- 11.2. Market Analysis, Insights and Forecast - by Types
- 11.2.1. Rigid Contact Lens
- 11.2.2. Soft Contact Lens
- 11.2.3. Hybrid Contact Lens
- 11.1. Market Analysis, Insights and Forecast - by Application
- 12. Competitive Analysis
- 12.1. Company Profiles
- 12.1.1 CooperVision
- 12.1.1.1. Company Overview
- 12.1.1.2. Products
- 12.1.1.3. Company Financials
- 12.1.1.4. SWOT Analysis
- 12.1.2 Johnson & Johnson
- 12.1.2.1. Company Overview
- 12.1.2.2. Products
- 12.1.2.3. Company Financials
- 12.1.2.4. SWOT Analysis
- 12.1.3 Novartis
- 12.1.3.1. Company Overview
- 12.1.3.2. Products
- 12.1.3.3. Company Financials
- 12.1.3.4. SWOT Analysis
- 12.1.4 Bausch Health
- 12.1.4.1. Company Overview
- 12.1.4.2. Products
- 12.1.4.3. Company Financials
- 12.1.4.4. SWOT Analysis
- 12.1.5 Carl Zeiss
- 12.1.5.1. Company Overview
- 12.1.5.2. Products
- 12.1.5.3. Company Financials
- 12.1.5.4. SWOT Analysis
- 12.1.6 Contamac
- 12.1.6.1. Company Overview
- 12.1.6.2. Products
- 12.1.6.3. Company Financials
- 12.1.6.4. SWOT Analysis
- 12.1.7 Essilor International
- 12.1.7.1. Company Overview
- 12.1.7.2. Products
- 12.1.7.3. Company Financials
- 12.1.7.4. SWOT Analysis
- 12.1.8 HOYA
- 12.1.8.1. Company Overview
- 12.1.8.2. Products
- 12.1.8.3. Company Financials
- 12.1.8.4. SWOT Analysis
- 12.1.9 Menicon
- 12.1.9.1. Company Overview
- 12.1.9.2. Products
- 12.1.9.3. Company Financials
- 12.1.9.4. SWOT Analysis
- 12.1.10 SynergEyes
- 12.1.10.1. Company Overview
- 12.1.10.2. Products
- 12.1.10.3. Company Financials
- 12.1.10.4. SWOT Analysis
- 12.1.11 UltraVision CLPL
- 12.1.11.1. Company Overview
- 12.1.11.2. Products
- 12.1.11.3. Company Financials
- 12.1.11.4. SWOT Analysis
- 12.1.12 Shanghai Hydron Contact Lens Optics (Ginko International)
- 12.1.12.1. Company Overview
- 12.1.12.2. Products
- 12.1.12.3. Company Financials
- 12.1.12.4. SWOT Analysis
- 12.1.1 CooperVision
- 12.2. Market Entropy
- 12.2.1 Company's Key Areas Served
- 12.2.2 Recent Developments
- 12.3. Company Market Share Analysis 2025
- 12.3.1 Top 5 Companies Market Share Analysis
- 12.3.2 Top 3 Companies Market Share Analysis
- 12.4. List of Potential Customers
- 13. Research Methodology
List of Figures
- Figure 1: Global Corrective Contact Lens Revenue Breakdown (undefined, %) by Region 2025 & 2033
- Figure 2: Global Corrective Contact Lens Volume Breakdown (K, %) by Region 2025 & 2033
- Figure 3: North America Corrective Contact Lens Revenue (undefined), by Application 2025 & 2033
- Figure 4: North America Corrective Contact Lens Volume (K), by Application 2025 & 2033
- Figure 5: North America Corrective Contact Lens Revenue Share (%), by Application 2025 & 2033
- Figure 6: North America Corrective Contact Lens Volume Share (%), by Application 2025 & 2033
- Figure 7: North America Corrective Contact Lens Revenue (undefined), by Types 2025 & 2033
- Figure 8: North America Corrective Contact Lens Volume (K), by Types 2025 & 2033
- Figure 9: North America Corrective Contact Lens Revenue Share (%), by Types 2025 & 2033
- Figure 10: North America Corrective Contact Lens Volume Share (%), by Types 2025 & 2033
- Figure 11: North America Corrective Contact Lens Revenue (undefined), by Country 2025 & 2033
- Figure 12: North America Corrective Contact Lens Volume (K), by Country 2025 & 2033
- Figure 13: North America Corrective Contact Lens Revenue Share (%), by Country 2025 & 2033
- Figure 14: North America Corrective Contact Lens Volume Share (%), by Country 2025 & 2033
- Figure 15: South America Corrective Contact Lens Revenue (undefined), by Application 2025 & 2033
- Figure 16: South America Corrective Contact Lens Volume (K), by Application 2025 & 2033
- Figure 17: South America Corrective Contact Lens Revenue Share (%), by Application 2025 & 2033
- Figure 18: South America Corrective Contact Lens Volume Share (%), by Application 2025 & 2033
- Figure 19: South America Corrective Contact Lens Revenue (undefined), by Types 2025 & 2033
- Figure 20: South America Corrective Contact Lens Volume (K), by Types 2025 & 2033
- Figure 21: South America Corrective Contact Lens Revenue Share (%), by Types 2025 & 2033
- Figure 22: South America Corrective Contact Lens Volume Share (%), by Types 2025 & 2033
- Figure 23: South America Corrective Contact Lens Revenue (undefined), by Country 2025 & 2033
- Figure 24: South America Corrective Contact Lens Volume (K), by Country 2025 & 2033
- Figure 25: South America Corrective Contact Lens Revenue Share (%), by Country 2025 & 2033
- Figure 26: South America Corrective Contact Lens Volume Share (%), by Country 2025 & 2033
- Figure 27: Europe Corrective Contact Lens Revenue (undefined), by Application 2025 & 2033
- Figure 28: Europe Corrective Contact Lens Volume (K), by Application 2025 & 2033
- Figure 29: Europe Corrective Contact Lens Revenue Share (%), by Application 2025 & 2033
- Figure 30: Europe Corrective Contact Lens Volume Share (%), by Application 2025 & 2033
- Figure 31: Europe Corrective Contact Lens Revenue (undefined), by Types 2025 & 2033
- Figure 32: Europe Corrective Contact Lens Volume (K), by Types 2025 & 2033
- Figure 33: Europe Corrective Contact Lens Revenue Share (%), by Types 2025 & 2033
- Figure 34: Europe Corrective Contact Lens Volume Share (%), by Types 2025 & 2033
- Figure 35: Europe Corrective Contact Lens Revenue (undefined), by Country 2025 & 2033
- Figure 36: Europe Corrective Contact Lens Volume (K), by Country 2025 & 2033
- Figure 37: Europe Corrective Contact Lens Revenue Share (%), by Country 2025 & 2033
- Figure 38: Europe Corrective Contact Lens Volume Share (%), by Country 2025 & 2033
- Figure 39: Middle East & Africa Corrective Contact Lens Revenue (undefined), by Application 2025 & 2033
- Figure 40: Middle East & Africa Corrective Contact Lens Volume (K), by Application 2025 & 2033
- Figure 41: Middle East & Africa Corrective Contact Lens Revenue Share (%), by Application 2025 & 2033
- Figure 42: Middle East & Africa Corrective Contact Lens Volume Share (%), by Application 2025 & 2033
- Figure 43: Middle East & Africa Corrective Contact Lens Revenue (undefined), by Types 2025 & 2033
- Figure 44: Middle East & Africa Corrective Contact Lens Volume (K), by Types 2025 & 2033
- Figure 45: Middle East & Africa Corrective Contact Lens Revenue Share (%), by Types 2025 & 2033
- Figure 46: Middle East & Africa Corrective Contact Lens Volume Share (%), by Types 2025 & 2033
- Figure 47: Middle East & Africa Corrective Contact Lens Revenue (undefined), by Country 2025 & 2033
- Figure 48: Middle East & Africa Corrective Contact Lens Volume (K), by Country 2025 & 2033
- Figure 49: Middle East & Africa Corrective Contact Lens Revenue Share (%), by Country 2025 & 2033
- Figure 50: Middle East & Africa Corrective Contact Lens Volume Share (%), by Country 2025 & 2033
- Figure 51: Asia Pacific Corrective Contact Lens Revenue (undefined), by Application 2025 & 2033
- Figure 52: Asia Pacific Corrective Contact Lens Volume (K), by Application 2025 & 2033
- Figure 53: Asia Pacific Corrective Contact Lens Revenue Share (%), by Application 2025 & 2033
- Figure 54: Asia Pacific Corrective Contact Lens Volume Share (%), by Application 2025 & 2033
- Figure 55: Asia Pacific Corrective Contact Lens Revenue (undefined), by Types 2025 & 2033
- Figure 56: Asia Pacific Corrective Contact Lens Volume (K), by Types 2025 & 2033
- Figure 57: Asia Pacific Corrective Contact Lens Revenue Share (%), by Types 2025 & 2033
- Figure 58: Asia Pacific Corrective Contact Lens Volume Share (%), by Types 2025 & 2033
- Figure 59: Asia Pacific Corrective Contact Lens Revenue (undefined), by Country 2025 & 2033
- Figure 60: Asia Pacific Corrective Contact Lens Volume (K), by Country 2025 & 2033
- Figure 61: Asia Pacific Corrective Contact Lens Revenue Share (%), by Country 2025 & 2033
- Figure 62: Asia Pacific Corrective Contact Lens Volume Share (%), by Country 2025 & 2033
List of Tables
- Table 1: Global Corrective Contact Lens Revenue undefined Forecast, by Application 2020 & 2033
- Table 2: Global Corrective Contact Lens Volume K Forecast, by Application 2020 & 2033
- Table 3: Global Corrective Contact Lens Revenue undefined Forecast, by Types 2020 & 2033
- Table 4: Global Corrective Contact Lens Volume K Forecast, by Types 2020 & 2033
- Table 5: Global Corrective Contact Lens Revenue undefined Forecast, by Region 2020 & 2033
- Table 6: Global Corrective Contact Lens Volume K Forecast, by Region 2020 & 2033
- Table 7: Global Corrective Contact Lens Revenue undefined Forecast, by Application 2020 & 2033
- Table 8: Global Corrective Contact Lens Volume K Forecast, by Application 2020 & 2033
- Table 9: Global Corrective Contact Lens Revenue undefined Forecast, by Types 2020 & 2033
- Table 10: Global Corrective Contact Lens Volume K Forecast, by Types 2020 & 2033
- Table 11: Global Corrective Contact Lens Revenue undefined Forecast, by Country 2020 & 2033
- Table 12: Global Corrective Contact Lens Volume K Forecast, by Country 2020 & 2033
- Table 13: United States Corrective Contact Lens Revenue (undefined) Forecast, by Application 2020 & 2033
- Table 14: United States Corrective Contact Lens Volume (K) Forecast, by Application 2020 & 2033
- Table 15: Canada Corrective Contact Lens Revenue (undefined) Forecast, by Application 2020 & 2033
- Table 16: Canada Corrective Contact Lens Volume (K) Forecast, by Application 2020 & 2033
- Table 17: Mexico Corrective Contact Lens Revenue (undefined) Forecast, by Application 2020 & 2033
- Table 18: Mexico Corrective Contact Lens Volume (K) Forecast, by Application 2020 & 2033
- Table 19: Global Corrective Contact Lens Revenue undefined Forecast, by Application 2020 & 2033
- Table 20: Global Corrective Contact Lens Volume K Forecast, by Application 2020 & 2033
- Table 21: Global Corrective Contact Lens Revenue undefined Forecast, by Types 2020 & 2033
- Table 22: Global Corrective Contact Lens Volume K Forecast, by Types 2020 & 2033
- Table 23: Global Corrective Contact Lens Revenue undefined Forecast, by Country 2020 & 2033
- Table 24: Global Corrective Contact Lens Volume K Forecast, by Country 2020 & 2033
- Table 25: Brazil Corrective Contact Lens Revenue (undefined) Forecast, by Application 2020 & 2033
- Table 26: Brazil Corrective Contact Lens Volume (K) Forecast, by Application 2020 & 2033
- Table 27: Argentina Corrective Contact Lens Revenue (undefined) Forecast, by Application 2020 & 2033
- Table 28: Argentina Corrective Contact Lens Volume (K) Forecast, by Application 2020 & 2033
- Table 29: Rest of South America Corrective Contact Lens Revenue (undefined) Forecast, by Application 2020 & 2033
- Table 30: Rest of South America Corrective Contact Lens Volume (K) Forecast, by Application 2020 & 2033
- Table 31: Global Corrective Contact Lens Revenue undefined Forecast, by Application 2020 & 2033
- Table 32: Global Corrective Contact Lens Volume K Forecast, by Application 2020 & 2033
- Table 33: Global Corrective Contact Lens Revenue undefined Forecast, by Types 2020 & 2033
- Table 34: Global Corrective Contact Lens Volume K Forecast, by Types 2020 & 2033
- Table 35: Global Corrective Contact Lens Revenue undefined Forecast, by Country 2020 & 2033
- Table 36: Global Corrective Contact Lens Volume K Forecast, by Country 2020 & 2033
- Table 37: United Kingdom Corrective Contact Lens Revenue (undefined) Forecast, by Application 2020 & 2033
- Table 38: United Kingdom Corrective Contact Lens Volume (K) Forecast, by Application 2020 & 2033
- Table 39: Germany Corrective Contact Lens Revenue (undefined) Forecast, by Application 2020 & 2033
- Table 40: Germany Corrective Contact Lens Volume (K) Forecast, by Application 2020 & 2033
- Table 41: France Corrective Contact Lens Revenue (undefined) Forecast, by Application 2020 & 2033
- Table 42: France Corrective Contact Lens Volume (K) Forecast, by Application 2020 & 2033
- Table 43: Italy Corrective Contact Lens Revenue (undefined) Forecast, by Application 2020 & 2033
- Table 44: Italy Corrective Contact Lens Volume (K) Forecast, by Application 2020 & 2033
- Table 45: Spain Corrective Contact Lens Revenue (undefined) Forecast, by Application 2020 & 2033
- Table 46: Spain Corrective Contact Lens Volume (K) Forecast, by Application 2020 & 2033
- Table 47: Russia Corrective Contact Lens Revenue (undefined) Forecast, by Application 2020 & 2033
- Table 48: Russia Corrective Contact Lens Volume (K) Forecast, by Application 2020 & 2033
- Table 49: Benelux Corrective Contact Lens Revenue (undefined) Forecast, by Application 2020 & 2033
- Table 50: Benelux Corrective Contact Lens Volume (K) Forecast, by Application 2020 & 2033
- Table 51: Nordics Corrective Contact Lens Revenue (undefined) Forecast, by Application 2020 & 2033
- Table 52: Nordics Corrective Contact Lens Volume (K) Forecast, by Application 2020 & 2033
- Table 53: Rest of Europe Corrective Contact Lens Revenue (undefined) Forecast, by Application 2020 & 2033
- Table 54: Rest of Europe Corrective Contact Lens Volume (K) Forecast, by Application 2020 & 2033
- Table 55: Global Corrective Contact Lens Revenue undefined Forecast, by Application 2020 & 2033
- Table 56: Global Corrective Contact Lens Volume K Forecast, by Application 2020 & 2033
- Table 57: Global Corrective Contact Lens Revenue undefined Forecast, by Types 2020 & 2033
- Table 58: Global Corrective Contact Lens Volume K Forecast, by Types 2020 & 2033
- Table 59: Global Corrective Contact Lens Revenue undefined Forecast, by Country 2020 & 2033
- Table 60: Global Corrective Contact Lens Volume K Forecast, by Country 2020 & 2033
- Table 61: Turkey Corrective Contact Lens Revenue (undefined) Forecast, by Application 2020 & 2033
- Table 62: Turkey Corrective Contact Lens Volume (K) Forecast, by Application 2020 & 2033
- Table 63: Israel Corrective Contact Lens Revenue (undefined) Forecast, by Application 2020 & 2033
- Table 64: Israel Corrective Contact Lens Volume (K) Forecast, by Application 2020 & 2033
- Table 65: GCC Corrective Contact Lens Revenue (undefined) Forecast, by Application 2020 & 2033
- Table 66: GCC Corrective Contact Lens Volume (K) Forecast, by Application 2020 & 2033
- Table 67: North Africa Corrective Contact Lens Revenue (undefined) Forecast, by Application 2020 & 2033
- Table 68: North Africa Corrective Contact Lens Volume (K) Forecast, by Application 2020 & 2033
- Table 69: South Africa Corrective Contact Lens Revenue (undefined) Forecast, by Application 2020 & 2033
- Table 70: South Africa Corrective Contact Lens Volume (K) Forecast, by Application 2020 & 2033
- Table 71: Rest of Middle East & Africa Corrective Contact Lens Revenue (undefined) Forecast, by Application 2020 & 2033
- Table 72: Rest of Middle East & Africa Corrective Contact Lens Volume (K) Forecast, by Application 2020 & 2033
- Table 73: Global Corrective Contact Lens Revenue undefined Forecast, by Application 2020 & 2033
- Table 74: Global Corrective Contact Lens Volume K Forecast, by Application 2020 & 2033
- Table 75: Global Corrective Contact Lens Revenue undefined Forecast, by Types 2020 & 2033
- Table 76: Global Corrective Contact Lens Volume K Forecast, by Types 2020 & 2033
- Table 77: Global Corrective Contact Lens Revenue undefined Forecast, by Country 2020 & 2033
- Table 78: Global Corrective Contact Lens Volume K Forecast, by Country 2020 & 2033
- Table 79: China Corrective Contact Lens Revenue (undefined) Forecast, by Application 2020 & 2033
- Table 80: China Corrective Contact Lens Volume (K) Forecast, by Application 2020 & 2033
- Table 81: India Corrective Contact Lens Revenue (undefined) Forecast, by Application 2020 & 2033
- Table 82: India Corrective Contact Lens Volume (K) Forecast, by Application 2020 & 2033
- Table 83: Japan Corrective Contact Lens Revenue (undefined) Forecast, by Application 2020 & 2033
- Table 84: Japan Corrective Contact Lens Volume (K) Forecast, by Application 2020 & 2033
- Table 85: South Korea Corrective Contact Lens Revenue (undefined) Forecast, by Application 2020 & 2033
- Table 86: South Korea Corrective Contact Lens Volume (K) Forecast, by Application 2020 & 2033
- Table 87: ASEAN Corrective Contact Lens Revenue (undefined) Forecast, by Application 2020 & 2033
- Table 88: ASEAN Corrective Contact Lens Volume (K) Forecast, by Application 2020 & 2033
- Table 89: Oceania Corrective Contact Lens Revenue (undefined) Forecast, by Application 2020 & 2033
- Table 90: Oceania Corrective Contact Lens Volume (K) Forecast, by Application 2020 & 2033
- Table 91: Rest of Asia Pacific Corrective Contact Lens Revenue (undefined) Forecast, by Application 2020 & 2033
- Table 92: Rest of Asia Pacific Corrective Contact Lens Volume (K) Forecast, by Application 2020 & 2033
Frequently Asked Questions
1. What is the projected Compound Annual Growth Rate (CAGR) of the Corrective Contact Lens?
The projected CAGR is approximately 3.9%.
2. Which companies are prominent players in the Corrective Contact Lens?
Key companies in the market include CooperVision, Johnson & Johnson, Novartis, Bausch Health, Carl Zeiss, Contamac, Essilor International, HOYA, Menicon, SynergEyes, UltraVision CLPL, Shanghai Hydron Contact Lens Optics (Ginko International).
3. What are the main segments of the Corrective Contact Lens?
The market segments include Application, Types.
4. Can you provide details about the market size?
The market size is estimated to be USD XXX N/A as of 2022.
5. What are some drivers contributing to market growth?
N/A
6. What are the notable trends driving market growth?
N/A
7. Are there any restraints impacting market growth?
N/A
8. Can you provide examples of recent developments in the market?
N/A
9. What pricing options are available for accessing the report?
Pricing options include single-user, multi-user, and enterprise licenses priced at USD 3350.00, USD 5025.00, and USD 6700.00 respectively.
10. Is the market size provided in terms of value or volume?
The market size is provided in terms of value, measured in N/A and volume, measured in K.
11. Are there any specific market keywords associated with the report?
Yes, the market keyword associated with the report is "Corrective Contact Lens," which aids in identifying and referencing the specific market segment covered.
12. How do I determine which pricing option suits my needs best?
The pricing options vary based on user requirements and access needs. Individual users may opt for single-user licenses, while businesses requiring broader access may choose multi-user or enterprise licenses for cost-effective access to the report.
13. Are there any additional resources or data provided in the Corrective Contact Lens report?
While the report offers comprehensive insights, it's advisable to review the specific contents or supplementary materials provided to ascertain if additional resources or data are available.
14. How can I stay updated on further developments or reports in the Corrective Contact Lens?
To stay informed about further developments, trends, and reports in the Corrective Contact Lens, consider subscribing to industry newsletters, following relevant companies and organizations, or regularly checking reputable industry news sources and publications.
Methodology
Step 1 - Identification of Relevant Samples Size from Population Database


Step 2 - Approaches for Defining Global Market Size (Value, Volume* & Price*)

Note*: In applicable scenarios
Step 3 - Data Sources
Primary Research
- Web Analytics
- Survey Reports
- Research Institute
- Latest Research Reports
- Opinion Leaders
Secondary Research
- Annual Reports
- White Paper
- Latest Press Release
- Industry Association
- Paid Database
- Investor Presentations

Step 4 - Data Triangulation
Involves using different sources of information in order to increase the validity of a study
These sources are likely to be stakeholders in a program - participants, other researchers, program staff, other community members, and so on.
Then we put all data in single framework & apply various statistical tools to find out the dynamic on the market.
During the analysis stage, feedback from the stakeholder groups would be compared to determine areas of agreement as well as areas of divergence