

Key Insights
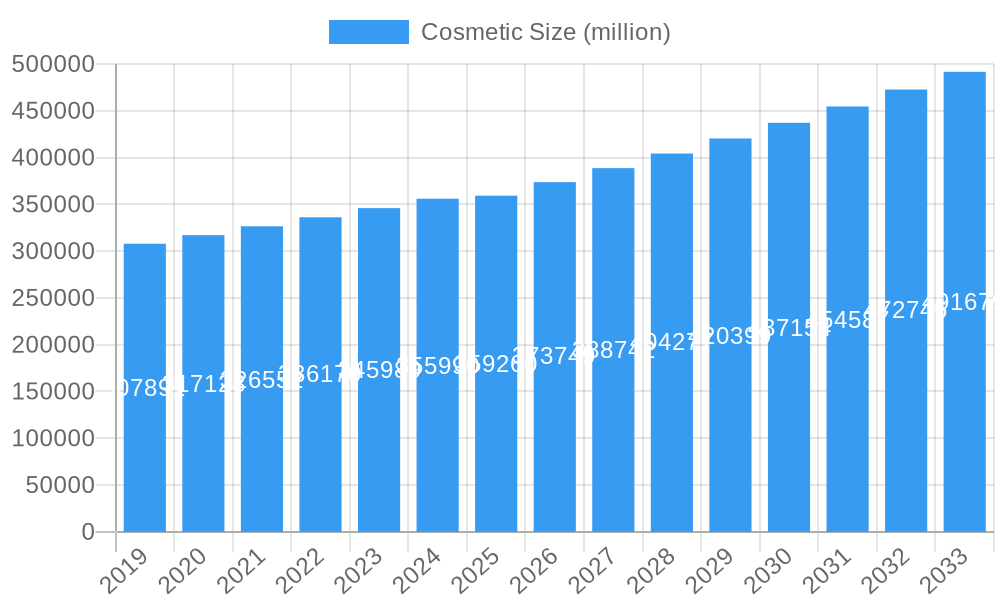
The global cosmetics market is a dynamic and expansive industry, exhibiting robust growth driven by several key factors. Increased disposable incomes, particularly in emerging economies, fuel rising demand for beauty and personal care products. The burgeoning middle class in Asia-Pacific, for example, is a significant contributor to this market expansion. Furthermore, evolving consumer preferences towards natural, organic, and ethically sourced cosmetics are shaping product innovation and driving premiumization within the sector. Strong online retail channels and sophisticated digital marketing strategies are also playing a crucial role in boosting sales and reach. While the market experienced some temporary disruptions due to global events in recent years, the long-term outlook remains positive, fueled by consistent innovation and growing consumer interest in self-care and beauty enhancement. We project a compound annual growth rate (CAGR) of approximately 5% over the forecast period (2025-2033).
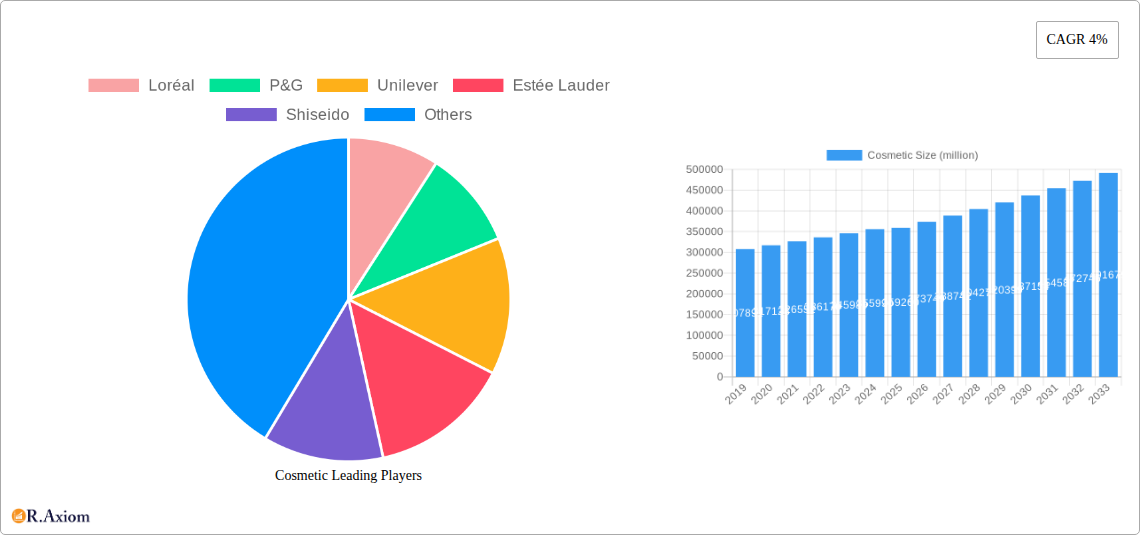
Cosmetic Market Size (In Billion)
The competitive landscape is highly fragmented, with both established multinational corporations like L'Oréal, P&G, and Unilever, and smaller niche players vying for market share. Successful players are adapting to changing consumer demands by focusing on sustainability, inclusivity, and personalization. Customization options, tailored skincare regimens, and the increasing use of AI-powered beauty tools contribute to this trend. The market is segmented by product type (skincare, makeup, haircare, fragrances, etc.), distribution channel (online, retail stores), and region. Geographical variations in consumer preferences and purchasing power will continue to influence regional market growth. Factors such as fluctuating raw material prices and stringent regulatory requirements present challenges, but the overall positive growth trajectory of the cosmetics market is expected to persist throughout the forecast period.
Cosmetic Company Market Share
Cosmetic Market Report: 2019-2033 - A Comprehensive Analysis of a Multi-Billion Dollar Industry
This comprehensive report provides an in-depth analysis of the global cosmetic market, offering invaluable insights for industry stakeholders, investors, and strategic decision-makers. With a study period spanning 2019-2033, a base year of 2025, and a forecast period of 2025-2033, this report meticulously examines market trends, competitive dynamics, and future growth potential. The global cosmetic market is projected to reach a value exceeding $xx million by 2033.
Cosmetic Market Concentration & Innovation
The global cosmetic market is characterized by a high level of concentration, with a few major players dominating the landscape. L'Oréal, P&G, Unilever, Estée Lauder, and Shiseido collectively account for a significant portion (estimated at xx%) of the global market share in 2025. Smaller players, such as Amorepacific, Jahwa, and Sisley, hold niche market positions through specialized product offerings and strong regional presence.
Market Share (2025 Estimate):
- L'Oréal: xx%
- P&G: xx%
- Unilever: xx%
- Estée Lauder: xx%
- Shiseido: xx%
- Others: xx%
Innovation Drivers: Innovation in the cosmetic industry is driven by several factors, including:
- Technological advancements: The incorporation of biotechnology, nanotechnology, and artificial intelligence is leading to the development of novel formulations and personalized beauty solutions.
- Consumer demand for natural and sustainable products: This has fueled the growth of organic and ethically sourced cosmetic brands.
- Regulatory changes: Stringent regulations on ingredients and labeling are driving manufacturers to develop safer and more transparent products.
Mergers & Acquisitions (M&A) Activity: The cosmetic industry has witnessed significant M&A activity in recent years, with major players acquiring smaller companies to expand their product portfolios and market reach. The total value of M&A deals in the cosmetic industry during the historical period (2019-2024) is estimated to be $xx million. Notable deals include [mention specific notable deals and their approximate values if available, otherwise state "Data unavailable"]. These activities reflect the industry's ongoing consolidation and the pursuit of innovation through strategic acquisitions.
Cosmetic Industry Trends & Insights
The cosmetic market is experiencing robust growth, driven by several key factors. Rising disposable incomes in developing economies, coupled with increasing consumer awareness of personal care and beauty, are significantly boosting demand. The global CAGR for the cosmetic market during the forecast period (2025-2033) is projected to be xx%. Technological disruptions, such as the rise of e-commerce and personalized beauty solutions, are transforming the industry landscape. Market penetration of online cosmetic sales is expected to increase from xx% in 2025 to xx% by 2033. Furthermore, the growing adoption of advanced technologies like AR/VR in virtual try-on experiences and the use of AI for personalized skincare recommendations are shaping consumer preferences and behavior.
Consumer preferences are shifting towards natural, organic, and sustainable products, with a rising demand for clean beauty. This trend has created significant opportunities for brands that emphasize transparency, ethical sourcing, and environmentally friendly packaging. Competitive dynamics are characterized by intense rivalry among established players and the emergence of innovative niche brands. Pricing strategies and brand positioning play pivotal roles in securing market share.
Dominant Markets & Segments in Cosmetic
The Asia-Pacific region is currently the dominant market for cosmetics, driven by strong economic growth, a large and expanding middle class, and increasing consumer spending on personal care products. Within the region, China holds the largest market share, followed by other rapidly developing countries.
Key Drivers for Asia-Pacific Dominance:
- Rapid economic growth: Increasing disposable incomes are empowering consumers to invest more in beauty and personal care.
- Growing middle class: This large segment of the population is particularly keen to adopt new products and trends.
- Favorable demographic trends: A large young population fuels a significant demand for cosmetics.
- Supportive government policies: These policies promote the growth of the cosmetic industry.
- Robust e-commerce infrastructure: This provides significant market access.
Detailed Dominance Analysis: China’s market dominance is attributed to its massive population, burgeoning middle class, and significant online retail infrastructure. The country's evolving beauty standards and strong social media influence also play a crucial role. Other significant markets include South Korea, Japan, and India, each with distinct dynamics and cultural influences that shape their cosmetic consumption patterns.
Cosmetic Product Developments
Recent product innovations focus on multifunctional products, customized solutions, and advanced formulations incorporating sustainable and ethically sourced ingredients. Technological trends, such as AI-powered skincare analysis and personalized recommendations, are enhancing customer experience. The market is witnessing a growing emphasis on clean beauty, with brands incorporating natural and organic ingredients and minimizing the use of potentially harmful chemicals. This trend aligns with increased consumer awareness of ingredient safety and environmental sustainability.
Report Scope & Segmentation Analysis
This report segments the cosmetic market based on product type (skincare, makeup, haircare, fragrances, etc.), distribution channel (online, offline), and region (North America, Europe, Asia-Pacific, etc.). Growth projections and market size estimates are provided for each segment, alongside detailed competitive analysis. For example, the skincare segment is expected to exhibit robust growth, driven by increased consumer awareness of skincare routines and the growing popularity of advanced skincare technologies. Similarly, the online distribution channel is experiencing rapid expansion due to increased e-commerce adoption and convenience.
Key Drivers of Cosmetic Growth
Several key factors are driving the growth of the cosmetic market. These include rising disposable incomes, particularly in emerging economies, leading to increased consumer spending on beauty and personal care. Technological advancements in formulation and delivery systems are constantly driving innovation and product diversification. Furthermore, favorable regulatory environments in some regions and the increasing adoption of e-commerce platforms are contributing to market expansion. The growing influence of social media in shaping beauty trends and influencing purchase decisions also plays a significant role in market growth.
Challenges in the Cosmetic Sector
The cosmetic sector faces various challenges including stringent regulations on ingredient safety and labeling, which require manufacturers to invest heavily in compliance and product reformulation. Supply chain disruptions, particularly regarding sourcing of raw materials, can impact production and cost. Intense competition from both established and emerging brands poses significant challenges. The global market is estimated to have lost $xx million due to supply chain disruptions in [year, if data is available]. The increasing demand for transparency and sustainability presents challenges related to sourcing ethical and eco-friendly ingredients and packaging.
Emerging Opportunities in Cosmetic
Emerging opportunities lie in the development of personalized cosmetic products, leveraging technological advancements like AI and big data to tailor products and experiences to individual consumer needs. The growth of the clean beauty segment presents significant potential for brands focused on natural, organic, and ethically sourced ingredients. Expansion into untapped markets, particularly in emerging economies, offers considerable growth prospects. The increasing integration of technology into the customer experience, such as AR/VR applications and personalized recommendations, creates opportunities for innovation.
Leading Players in the Cosmetic Market
- L'Oréal
- P&G
- Unilever
- Estée Lauder
- Shiseido
- Avon
- LV
- Chanel
- Amorepacific
- Jahwa
- Beiersdorf
- Johnson & Johnson
- Jiala
- INOHERB
- Sisley
- Revlon
- Jane iredale
- Henkel
- Coty
Key Developments in Cosmetic Industry
- 2022-Q4: L'Oréal launched a new range of sustainable makeup products.
- 2023-Q1: P&G acquired a smaller natural cosmetics brand.
- 2023-Q2: Unilever invested heavily in AI-driven personalized beauty technology.
- [Add further key developments with dates and descriptions of their impacts on the market if available, otherwise state "Further data unavailable"].
Strategic Outlook for Cosmetic Market
The future of the cosmetic market looks promising, with continued growth driven by several key factors. The increasing demand for personalized and sustainable products, coupled with technological advancements and the expansion of e-commerce, will continue to shape industry dynamics. Emerging markets in developing economies represent significant growth opportunities. Brands that focus on innovation, sustainability, and customer experience will be best positioned to succeed in the dynamic and competitive global cosmetic market. The market is poised for continued expansion, with significant opportunities for innovation and growth in the coming years.
Cosmetic Segmentation
-
1. Application
- 1.1. <24 Age
- 1.2. 25-34 Age
- 1.3. 35-44 Age
- 1.4. 45-54 Age
- 1.5. 55-64 Age
- 1.6. >65 Age
-
2. Types
- 2.1. Hair Care
- 2.2. Skin Care
- 2.3. Make-up
- 2.4. Fragrance
- 2.5. Oral Hygiene Products
Cosmetic Segmentation By Geography
-
1. North America
- 1.1. United States
- 1.2. Canada
- 1.3. Mexico
-
2. South America
- 2.1. Brazil
- 2.2. Argentina
- 2.3. Rest of South America
-
3. Europe
- 3.1. United Kingdom
- 3.2. Germany
- 3.3. France
- 3.4. Italy
- 3.5. Spain
- 3.6. Russia
- 3.7. Benelux
- 3.8. Nordics
- 3.9. Rest of Europe
-
4. Middle East & Africa
- 4.1. Turkey
- 4.2. Israel
- 4.3. GCC
- 4.4. North Africa
- 4.5. South Africa
- 4.6. Rest of Middle East & Africa
-
5. Asia Pacific
- 5.1. China
- 5.2. India
- 5.3. Japan
- 5.4. South Korea
- 5.5. ASEAN
- 5.6. Oceania
- 5.7. Rest of Asia Pacific
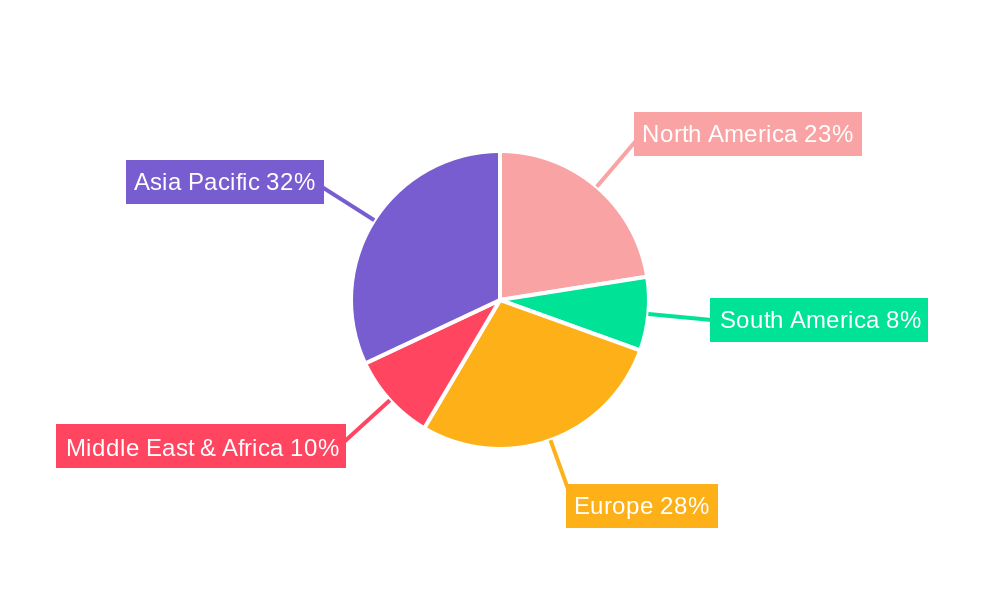
Cosmetic Regional Market Share
Geographic Coverage of Cosmetic
Cosmetic REPORT HIGHLIGHTS
| Aspects | Details |
|---|---|
| Study Period | 2020-2034 |
| Base Year | 2025 |
| Estimated Year | 2026 |
| Forecast Period | 2026-2034 |
| Historical Period | 2020-2025 |
| Growth Rate | CAGR of XX% from 2020-2034 |
| Segmentation |
|
Table of Contents
- 1. Introduction
- 1.1. Research Scope
- 1.2. Market Segmentation
- 1.3. Research Objective
- 1.4. Definitions and Assumptions
- 2. Executive Summary
- 2.1. Market Snapshot
- 3. Market Dynamics
- 3.1. Market Drivers
- 3.2. Market Restrains
- 3.3. Market Trends
- 3.4. Market Opportunities
- 4. Market Factor Analysis
- 4.1. Porters Five Forces
- 4.1.1. Bargaining Power of Suppliers
- 4.1.2. Bargaining Power of Buyers
- 4.1.3. Threat of New Entrants
- 4.1.4. Threat of Substitutes
- 4.1.5. Competitive Rivalry
- 4.2. PESTEL analysis
- 4.3. BCG Analysis
- 4.3.1. Stars (High Growth, High Market Share)
- 4.3.2. Cash Cows (Low Growth, High Market Share)
- 4.3.3. Question Mark (High Growth, Low Market Share)
- 4.3.4. Dogs (Low Growth, Low Market Share)
- 4.4. Ansoff Matrix Analysis
- 4.5. Supply Chain Analysis
- 4.6. Regulatory Landscape
- 4.7. Current Market Potential and Opportunity Assessment (TAM–SAM–SOM Framework)
- 4.8. RAX Analyst Note
- 4.1. Porters Five Forces
- 5. Market Analysis, Insights and Forecast 2021-2033
- 5.1. Market Analysis, Insights and Forecast - by Application
- 5.1.1. <24 Age
- 5.1.2. 25-34 Age
- 5.1.3. 35-44 Age
- 5.1.4. 45-54 Age
- 5.1.5. 55-64 Age
- 5.1.6. >65 Age
- 5.2. Market Analysis, Insights and Forecast - by Types
- 5.2.1. Hair Care
- 5.2.2. Skin Care
- 5.2.3. Make-up
- 5.2.4. Fragrance
- 5.2.5. Oral Hygiene Products
- 5.3. Market Analysis, Insights and Forecast - by Region
- 5.3.1. North America
- 5.3.2. South America
- 5.3.3. Europe
- 5.3.4. Middle East & Africa
- 5.3.5. Asia Pacific
- 5.1. Market Analysis, Insights and Forecast - by Application
- 6. Global Cosmetic Analysis, Insights and Forecast, 2021-2033
- 6.1. Market Analysis, Insights and Forecast - by Application
- 6.1.1. <24 Age
- 6.1.2. 25-34 Age
- 6.1.3. 35-44 Age
- 6.1.4. 45-54 Age
- 6.1.5. 55-64 Age
- 6.1.6. >65 Age
- 6.2. Market Analysis, Insights and Forecast - by Types
- 6.2.1. Hair Care
- 6.2.2. Skin Care
- 6.2.3. Make-up
- 6.2.4. Fragrance
- 6.2.5. Oral Hygiene Products
- 6.1. Market Analysis, Insights and Forecast - by Application
- 7. North America Cosmetic Analysis, Insights and Forecast, 2020-2032
- 7.1. Market Analysis, Insights and Forecast - by Application
- 7.1.1. <24 Age
- 7.1.2. 25-34 Age
- 7.1.3. 35-44 Age
- 7.1.4. 45-54 Age
- 7.1.5. 55-64 Age
- 7.1.6. >65 Age
- 7.2. Market Analysis, Insights and Forecast - by Types
- 7.2.1. Hair Care
- 7.2.2. Skin Care
- 7.2.3. Make-up
- 7.2.4. Fragrance
- 7.2.5. Oral Hygiene Products
- 7.1. Market Analysis, Insights and Forecast - by Application
- 8. South America Cosmetic Analysis, Insights and Forecast, 2020-2032
- 8.1. Market Analysis, Insights and Forecast - by Application
- 8.1.1. <24 Age
- 8.1.2. 25-34 Age
- 8.1.3. 35-44 Age
- 8.1.4. 45-54 Age
- 8.1.5. 55-64 Age
- 8.1.6. >65 Age
- 8.2. Market Analysis, Insights and Forecast - by Types
- 8.2.1. Hair Care
- 8.2.2. Skin Care
- 8.2.3. Make-up
- 8.2.4. Fragrance
- 8.2.5. Oral Hygiene Products
- 8.1. Market Analysis, Insights and Forecast - by Application
- 9. Europe Cosmetic Analysis, Insights and Forecast, 2020-2032
- 9.1. Market Analysis, Insights and Forecast - by Application
- 9.1.1. <24 Age
- 9.1.2. 25-34 Age
- 9.1.3. 35-44 Age
- 9.1.4. 45-54 Age
- 9.1.5. 55-64 Age
- 9.1.6. >65 Age
- 9.2. Market Analysis, Insights and Forecast - by Types
- 9.2.1. Hair Care
- 9.2.2. Skin Care
- 9.2.3. Make-up
- 9.2.4. Fragrance
- 9.2.5. Oral Hygiene Products
- 9.1. Market Analysis, Insights and Forecast - by Application
- 10. Middle East & Africa Cosmetic Analysis, Insights and Forecast, 2020-2032
- 10.1. Market Analysis, Insights and Forecast - by Application
- 10.1.1. <24 Age
- 10.1.2. 25-34 Age
- 10.1.3. 35-44 Age
- 10.1.4. 45-54 Age
- 10.1.5. 55-64 Age
- 10.1.6. >65 Age
- 10.2. Market Analysis, Insights and Forecast - by Types
- 10.2.1. Hair Care
- 10.2.2. Skin Care
- 10.2.3. Make-up
- 10.2.4. Fragrance
- 10.2.5. Oral Hygiene Products
- 10.1. Market Analysis, Insights and Forecast - by Application
- 11. Asia Pacific Cosmetic Analysis, Insights and Forecast, 2020-2032
- 11.1. Market Analysis, Insights and Forecast - by Application
- 11.1.1. <24 Age
- 11.1.2. 25-34 Age
- 11.1.3. 35-44 Age
- 11.1.4. 45-54 Age
- 11.1.5. 55-64 Age
- 11.1.6. >65 Age
- 11.2. Market Analysis, Insights and Forecast - by Types
- 11.2.1. Hair Care
- 11.2.2. Skin Care
- 11.2.3. Make-up
- 11.2.4. Fragrance
- 11.2.5. Oral Hygiene Products
- 11.1. Market Analysis, Insights and Forecast - by Application
- 12. Competitive Analysis
- 12.1. Company Profiles
- 12.1.1 Loréal
- 12.1.1.1. Company Overview
- 12.1.1.2. Products
- 12.1.1.3. Company Financials
- 12.1.1.4. SWOT Analysis
- 12.1.2 P&G
- 12.1.2.1. Company Overview
- 12.1.2.2. Products
- 12.1.2.3. Company Financials
- 12.1.2.4. SWOT Analysis
- 12.1.3 Unilever
- 12.1.3.1. Company Overview
- 12.1.3.2. Products
- 12.1.3.3. Company Financials
- 12.1.3.4. SWOT Analysis
- 12.1.4 Estée Lauder
- 12.1.4.1. Company Overview
- 12.1.4.2. Products
- 12.1.4.3. Company Financials
- 12.1.4.4. SWOT Analysis
- 12.1.5 Shiseido
- 12.1.5.1. Company Overview
- 12.1.5.2. Products
- 12.1.5.3. Company Financials
- 12.1.5.4. SWOT Analysis
- 12.1.6 Avon
- 12.1.6.1. Company Overview
- 12.1.6.2. Products
- 12.1.6.3. Company Financials
- 12.1.6.4. SWOT Analysis
- 12.1.7 LV
- 12.1.7.1. Company Overview
- 12.1.7.2. Products
- 12.1.7.3. Company Financials
- 12.1.7.4. SWOT Analysis
- 12.1.8 Channel
- 12.1.8.1. Company Overview
- 12.1.8.2. Products
- 12.1.8.3. Company Financials
- 12.1.8.4. SWOT Analysis
- 12.1.9 Amorepacific
- 12.1.9.1. Company Overview
- 12.1.9.2. Products
- 12.1.9.3. Company Financials
- 12.1.9.4. SWOT Analysis
- 12.1.10 Jahwa
- 12.1.10.1. Company Overview
- 12.1.10.2. Products
- 12.1.10.3. Company Financials
- 12.1.10.4. SWOT Analysis
- 12.1.11 Beiersdorf
- 12.1.11.1. Company Overview
- 12.1.11.2. Products
- 12.1.11.3. Company Financials
- 12.1.11.4. SWOT Analysis
- 12.1.12 Johnson & Johnson
- 12.1.12.1. Company Overview
- 12.1.12.2. Products
- 12.1.12.3. Company Financials
- 12.1.12.4. SWOT Analysis
- 12.1.13 Jiala
- 12.1.13.1. Company Overview
- 12.1.13.2. Products
- 12.1.13.3. Company Financials
- 12.1.13.4. SWOT Analysis
- 12.1.14 INOHERB
- 12.1.14.1. Company Overview
- 12.1.14.2. Products
- 12.1.14.3. Company Financials
- 12.1.14.4. SWOT Analysis
- 12.1.15 Sisley
- 12.1.15.1. Company Overview
- 12.1.15.2. Products
- 12.1.15.3. Company Financials
- 12.1.15.4. SWOT Analysis
- 12.1.16 Revlon
- 12.1.16.1. Company Overview
- 12.1.16.2. Products
- 12.1.16.3. Company Financials
- 12.1.16.4. SWOT Analysis
- 12.1.17 Jane iredale
- 12.1.17.1. Company Overview
- 12.1.17.2. Products
- 12.1.17.3. Company Financials
- 12.1.17.4. SWOT Analysis
- 12.1.18 Henkel
- 12.1.18.1. Company Overview
- 12.1.18.2. Products
- 12.1.18.3. Company Financials
- 12.1.18.4. SWOT Analysis
- 12.1.19 Coty
- 12.1.19.1. Company Overview
- 12.1.19.2. Products
- 12.1.19.3. Company Financials
- 12.1.19.4. SWOT Analysis
- 12.1.1 Loréal
- 12.2. Market Entropy
- 12.2.1 Company's Key Areas Served
- 12.2.2 Recent Developments
- 12.3. Company Market Share Analysis 2025
- 12.3.1 Top 5 Companies Market Share Analysis
- 12.3.2 Top 3 Companies Market Share Analysis
- 12.4. List of Potential Customers
- 13. Research Methodology
List of Figures
- Figure 1: Global Cosmetic Revenue Breakdown (million, %) by Region 2025 & 2033
- Figure 2: Global Cosmetic Volume Breakdown (K, %) by Region 2025 & 2033
- Figure 3: North America Cosmetic Revenue (million), by Application 2025 & 2033
- Figure 4: North America Cosmetic Volume (K), by Application 2025 & 2033
- Figure 5: North America Cosmetic Revenue Share (%), by Application 2025 & 2033
- Figure 6: North America Cosmetic Volume Share (%), by Application 2025 & 2033
- Figure 7: North America Cosmetic Revenue (million), by Types 2025 & 2033
- Figure 8: North America Cosmetic Volume (K), by Types 2025 & 2033
- Figure 9: North America Cosmetic Revenue Share (%), by Types 2025 & 2033
- Figure 10: North America Cosmetic Volume Share (%), by Types 2025 & 2033
- Figure 11: North America Cosmetic Revenue (million), by Country 2025 & 2033
- Figure 12: North America Cosmetic Volume (K), by Country 2025 & 2033
- Figure 13: North America Cosmetic Revenue Share (%), by Country 2025 & 2033
- Figure 14: North America Cosmetic Volume Share (%), by Country 2025 & 2033
- Figure 15: South America Cosmetic Revenue (million), by Application 2025 & 2033
- Figure 16: South America Cosmetic Volume (K), by Application 2025 & 2033
- Figure 17: South America Cosmetic Revenue Share (%), by Application 2025 & 2033
- Figure 18: South America Cosmetic Volume Share (%), by Application 2025 & 2033
- Figure 19: South America Cosmetic Revenue (million), by Types 2025 & 2033
- Figure 20: South America Cosmetic Volume (K), by Types 2025 & 2033
- Figure 21: South America Cosmetic Revenue Share (%), by Types 2025 & 2033
- Figure 22: South America Cosmetic Volume Share (%), by Types 2025 & 2033
- Figure 23: South America Cosmetic Revenue (million), by Country 2025 & 2033
- Figure 24: South America Cosmetic Volume (K), by Country 2025 & 2033
- Figure 25: South America Cosmetic Revenue Share (%), by Country 2025 & 2033
- Figure 26: South America Cosmetic Volume Share (%), by Country 2025 & 2033
- Figure 27: Europe Cosmetic Revenue (million), by Application 2025 & 2033
- Figure 28: Europe Cosmetic Volume (K), by Application 2025 & 2033
- Figure 29: Europe Cosmetic Revenue Share (%), by Application 2025 & 2033
- Figure 30: Europe Cosmetic Volume Share (%), by Application 2025 & 2033
- Figure 31: Europe Cosmetic Revenue (million), by Types 2025 & 2033
- Figure 32: Europe Cosmetic Volume (K), by Types 2025 & 2033
- Figure 33: Europe Cosmetic Revenue Share (%), by Types 2025 & 2033
- Figure 34: Europe Cosmetic Volume Share (%), by Types 2025 & 2033
- Figure 35: Europe Cosmetic Revenue (million), by Country 2025 & 2033
- Figure 36: Europe Cosmetic Volume (K), by Country 2025 & 2033
- Figure 37: Europe Cosmetic Revenue Share (%), by Country 2025 & 2033
- Figure 38: Europe Cosmetic Volume Share (%), by Country 2025 & 2033
- Figure 39: Middle East & Africa Cosmetic Revenue (million), by Application 2025 & 2033
- Figure 40: Middle East & Africa Cosmetic Volume (K), by Application 2025 & 2033
- Figure 41: Middle East & Africa Cosmetic Revenue Share (%), by Application 2025 & 2033
- Figure 42: Middle East & Africa Cosmetic Volume Share (%), by Application 2025 & 2033
- Figure 43: Middle East & Africa Cosmetic Revenue (million), by Types 2025 & 2033
- Figure 44: Middle East & Africa Cosmetic Volume (K), by Types 2025 & 2033
- Figure 45: Middle East & Africa Cosmetic Revenue Share (%), by Types 2025 & 2033
- Figure 46: Middle East & Africa Cosmetic Volume Share (%), by Types 2025 & 2033
- Figure 47: Middle East & Africa Cosmetic Revenue (million), by Country 2025 & 2033
- Figure 48: Middle East & Africa Cosmetic Volume (K), by Country 2025 & 2033
- Figure 49: Middle East & Africa Cosmetic Revenue Share (%), by Country 2025 & 2033
- Figure 50: Middle East & Africa Cosmetic Volume Share (%), by Country 2025 & 2033
- Figure 51: Asia Pacific Cosmetic Revenue (million), by Application 2025 & 2033
- Figure 52: Asia Pacific Cosmetic Volume (K), by Application 2025 & 2033
- Figure 53: Asia Pacific Cosmetic Revenue Share (%), by Application 2025 & 2033
- Figure 54: Asia Pacific Cosmetic Volume Share (%), by Application 2025 & 2033
- Figure 55: Asia Pacific Cosmetic Revenue (million), by Types 2025 & 2033
- Figure 56: Asia Pacific Cosmetic Volume (K), by Types 2025 & 2033
- Figure 57: Asia Pacific Cosmetic Revenue Share (%), by Types 2025 & 2033
- Figure 58: Asia Pacific Cosmetic Volume Share (%), by Types 2025 & 2033
- Figure 59: Asia Pacific Cosmetic Revenue (million), by Country 2025 & 2033
- Figure 60: Asia Pacific Cosmetic Volume (K), by Country 2025 & 2033
- Figure 61: Asia Pacific Cosmetic Revenue Share (%), by Country 2025 & 2033
- Figure 62: Asia Pacific Cosmetic Volume Share (%), by Country 2025 & 2033
List of Tables
- Table 1: Global Cosmetic Revenue million Forecast, by Application 2020 & 2033
- Table 2: Global Cosmetic Volume K Forecast, by Application 2020 & 2033
- Table 3: Global Cosmetic Revenue million Forecast, by Types 2020 & 2033
- Table 4: Global Cosmetic Volume K Forecast, by Types 2020 & 2033
- Table 5: Global Cosmetic Revenue million Forecast, by Region 2020 & 2033
- Table 6: Global Cosmetic Volume K Forecast, by Region 2020 & 2033
- Table 7: Global Cosmetic Revenue million Forecast, by Application 2020 & 2033
- Table 8: Global Cosmetic Volume K Forecast, by Application 2020 & 2033
- Table 9: Global Cosmetic Revenue million Forecast, by Types 2020 & 2033
- Table 10: Global Cosmetic Volume K Forecast, by Types 2020 & 2033
- Table 11: Global Cosmetic Revenue million Forecast, by Country 2020 & 2033
- Table 12: Global Cosmetic Volume K Forecast, by Country 2020 & 2033
- Table 13: United States Cosmetic Revenue (million) Forecast, by Application 2020 & 2033
- Table 14: United States Cosmetic Volume (K) Forecast, by Application 2020 & 2033
- Table 15: Canada Cosmetic Revenue (million) Forecast, by Application 2020 & 2033
- Table 16: Canada Cosmetic Volume (K) Forecast, by Application 2020 & 2033
- Table 17: Mexico Cosmetic Revenue (million) Forecast, by Application 2020 & 2033
- Table 18: Mexico Cosmetic Volume (K) Forecast, by Application 2020 & 2033
- Table 19: Global Cosmetic Revenue million Forecast, by Application 2020 & 2033
- Table 20: Global Cosmetic Volume K Forecast, by Application 2020 & 2033
- Table 21: Global Cosmetic Revenue million Forecast, by Types 2020 & 2033
- Table 22: Global Cosmetic Volume K Forecast, by Types 2020 & 2033
- Table 23: Global Cosmetic Revenue million Forecast, by Country 2020 & 2033
- Table 24: Global Cosmetic Volume K Forecast, by Country 2020 & 2033
- Table 25: Brazil Cosmetic Revenue (million) Forecast, by Application 2020 & 2033
- Table 26: Brazil Cosmetic Volume (K) Forecast, by Application 2020 & 2033
- Table 27: Argentina Cosmetic Revenue (million) Forecast, by Application 2020 & 2033
- Table 28: Argentina Cosmetic Volume (K) Forecast, by Application 2020 & 2033
- Table 29: Rest of South America Cosmetic Revenue (million) Forecast, by Application 2020 & 2033
- Table 30: Rest of South America Cosmetic Volume (K) Forecast, by Application 2020 & 2033
- Table 31: Global Cosmetic Revenue million Forecast, by Application 2020 & 2033
- Table 32: Global Cosmetic Volume K Forecast, by Application 2020 & 2033
- Table 33: Global Cosmetic Revenue million Forecast, by Types 2020 & 2033
- Table 34: Global Cosmetic Volume K Forecast, by Types 2020 & 2033
- Table 35: Global Cosmetic Revenue million Forecast, by Country 2020 & 2033
- Table 36: Global Cosmetic Volume K Forecast, by Country 2020 & 2033
- Table 37: United Kingdom Cosmetic Revenue (million) Forecast, by Application 2020 & 2033
- Table 38: United Kingdom Cosmetic Volume (K) Forecast, by Application 2020 & 2033
- Table 39: Germany Cosmetic Revenue (million) Forecast, by Application 2020 & 2033
- Table 40: Germany Cosmetic Volume (K) Forecast, by Application 2020 & 2033
- Table 41: France Cosmetic Revenue (million) Forecast, by Application 2020 & 2033
- Table 42: France Cosmetic Volume (K) Forecast, by Application 2020 & 2033
- Table 43: Italy Cosmetic Revenue (million) Forecast, by Application 2020 & 2033
- Table 44: Italy Cosmetic Volume (K) Forecast, by Application 2020 & 2033
- Table 45: Spain Cosmetic Revenue (million) Forecast, by Application 2020 & 2033
- Table 46: Spain Cosmetic Volume (K) Forecast, by Application 2020 & 2033
- Table 47: Russia Cosmetic Revenue (million) Forecast, by Application 2020 & 2033
- Table 48: Russia Cosmetic Volume (K) Forecast, by Application 2020 & 2033
- Table 49: Benelux Cosmetic Revenue (million) Forecast, by Application 2020 & 2033
- Table 50: Benelux Cosmetic Volume (K) Forecast, by Application 2020 & 2033
- Table 51: Nordics Cosmetic Revenue (million) Forecast, by Application 2020 & 2033
- Table 52: Nordics Cosmetic Volume (K) Forecast, by Application 2020 & 2033
- Table 53: Rest of Europe Cosmetic Revenue (million) Forecast, by Application 2020 & 2033
- Table 54: Rest of Europe Cosmetic Volume (K) Forecast, by Application 2020 & 2033
- Table 55: Global Cosmetic Revenue million Forecast, by Application 2020 & 2033
- Table 56: Global Cosmetic Volume K Forecast, by Application 2020 & 2033
- Table 57: Global Cosmetic Revenue million Forecast, by Types 2020 & 2033
- Table 58: Global Cosmetic Volume K Forecast, by Types 2020 & 2033
- Table 59: Global Cosmetic Revenue million Forecast, by Country 2020 & 2033
- Table 60: Global Cosmetic Volume K Forecast, by Country 2020 & 2033
- Table 61: Turkey Cosmetic Revenue (million) Forecast, by Application 2020 & 2033
- Table 62: Turkey Cosmetic Volume (K) Forecast, by Application 2020 & 2033
- Table 63: Israel Cosmetic Revenue (million) Forecast, by Application 2020 & 2033
- Table 64: Israel Cosmetic Volume (K) Forecast, by Application 2020 & 2033
- Table 65: GCC Cosmetic Revenue (million) Forecast, by Application 2020 & 2033
- Table 66: GCC Cosmetic Volume (K) Forecast, by Application 2020 & 2033
- Table 67: North Africa Cosmetic Revenue (million) Forecast, by Application 2020 & 2033
- Table 68: North Africa Cosmetic Volume (K) Forecast, by Application 2020 & 2033
- Table 69: South Africa Cosmetic Revenue (million) Forecast, by Application 2020 & 2033
- Table 70: South Africa Cosmetic Volume (K) Forecast, by Application 2020 & 2033
- Table 71: Rest of Middle East & Africa Cosmetic Revenue (million) Forecast, by Application 2020 & 2033
- Table 72: Rest of Middle East & Africa Cosmetic Volume (K) Forecast, by Application 2020 & 2033
- Table 73: Global Cosmetic Revenue million Forecast, by Application 2020 & 2033
- Table 74: Global Cosmetic Volume K Forecast, by Application 2020 & 2033
- Table 75: Global Cosmetic Revenue million Forecast, by Types 2020 & 2033
- Table 76: Global Cosmetic Volume K Forecast, by Types 2020 & 2033
- Table 77: Global Cosmetic Revenue million Forecast, by Country 2020 & 2033
- Table 78: Global Cosmetic Volume K Forecast, by Country 2020 & 2033
- Table 79: China Cosmetic Revenue (million) Forecast, by Application 2020 & 2033
- Table 80: China Cosmetic Volume (K) Forecast, by Application 2020 & 2033
- Table 81: India Cosmetic Revenue (million) Forecast, by Application 2020 & 2033
- Table 82: India Cosmetic Volume (K) Forecast, by Application 2020 & 2033
- Table 83: Japan Cosmetic Revenue (million) Forecast, by Application 2020 & 2033
- Table 84: Japan Cosmetic Volume (K) Forecast, by Application 2020 & 2033
- Table 85: South Korea Cosmetic Revenue (million) Forecast, by Application 2020 & 2033
- Table 86: South Korea Cosmetic Volume (K) Forecast, by Application 2020 & 2033
- Table 87: ASEAN Cosmetic Revenue (million) Forecast, by Application 2020 & 2033
- Table 88: ASEAN Cosmetic Volume (K) Forecast, by Application 2020 & 2033
- Table 89: Oceania Cosmetic Revenue (million) Forecast, by Application 2020 & 2033
- Table 90: Oceania Cosmetic Volume (K) Forecast, by Application 2020 & 2033
- Table 91: Rest of Asia Pacific Cosmetic Revenue (million) Forecast, by Application 2020 & 2033
- Table 92: Rest of Asia Pacific Cosmetic Volume (K) Forecast, by Application 2020 & 2033
Frequently Asked Questions
1. What is the projected Compound Annual Growth Rate (CAGR) of the Cosmetic?
The projected CAGR is approximately XX%.
2. Which companies are prominent players in the Cosmetic?
Key companies in the market include Loréal, P&G, Unilever, Estée Lauder, Shiseido, Avon, LV, Channel, Amorepacific, Jahwa, Beiersdorf, Johnson & Johnson, Jiala, INOHERB, Sisley, Revlon, Jane iredale, Henkel, Coty.
3. What are the main segments of the Cosmetic?
The market segments include Application, Types.
4. Can you provide details about the market size?
The market size is estimated to be USD XXX million as of 2022.
5. What are some drivers contributing to market growth?
N/A
6. What are the notable trends driving market growth?
N/A
7. Are there any restraints impacting market growth?
N/A
8. Can you provide examples of recent developments in the market?
N/A
9. What pricing options are available for accessing the report?
Pricing options include single-user, multi-user, and enterprise licenses priced at USD 3350.00, USD 5025.00, and USD 6700.00 respectively.
10. Is the market size provided in terms of value or volume?
The market size is provided in terms of value, measured in million and volume, measured in K.
11. Are there any specific market keywords associated with the report?
Yes, the market keyword associated with the report is "Cosmetic," which aids in identifying and referencing the specific market segment covered.
12. How do I determine which pricing option suits my needs best?
The pricing options vary based on user requirements and access needs. Individual users may opt for single-user licenses, while businesses requiring broader access may choose multi-user or enterprise licenses for cost-effective access to the report.
13. Are there any additional resources or data provided in the Cosmetic report?
While the report offers comprehensive insights, it's advisable to review the specific contents or supplementary materials provided to ascertain if additional resources or data are available.
14. How can I stay updated on further developments or reports in the Cosmetic?
To stay informed about further developments, trends, and reports in the Cosmetic, consider subscribing to industry newsletters, following relevant companies and organizations, or regularly checking reputable industry news sources and publications.
Methodology
Step 1 - Identification of Relevant Samples Size from Population Database


Step 2 - Approaches for Defining Global Market Size (Value, Volume* & Price*)

Note*: In applicable scenarios
Step 3 - Data Sources
Primary Research
- Web Analytics
- Survey Reports
- Research Institute
- Latest Research Reports
- Opinion Leaders
Secondary Research
- Annual Reports
- White Paper
- Latest Press Release
- Industry Association
- Paid Database
- Investor Presentations

Step 4 - Data Triangulation
Involves using different sources of information in order to increase the validity of a study
These sources are likely to be stakeholders in a program - participants, other researchers, program staff, other community members, and so on.
Then we put all data in single framework & apply various statistical tools to find out the dynamic on the market.
During the analysis stage, feedback from the stakeholder groups would be compared to determine areas of agreement as well as areas of divergence