

Key Insights
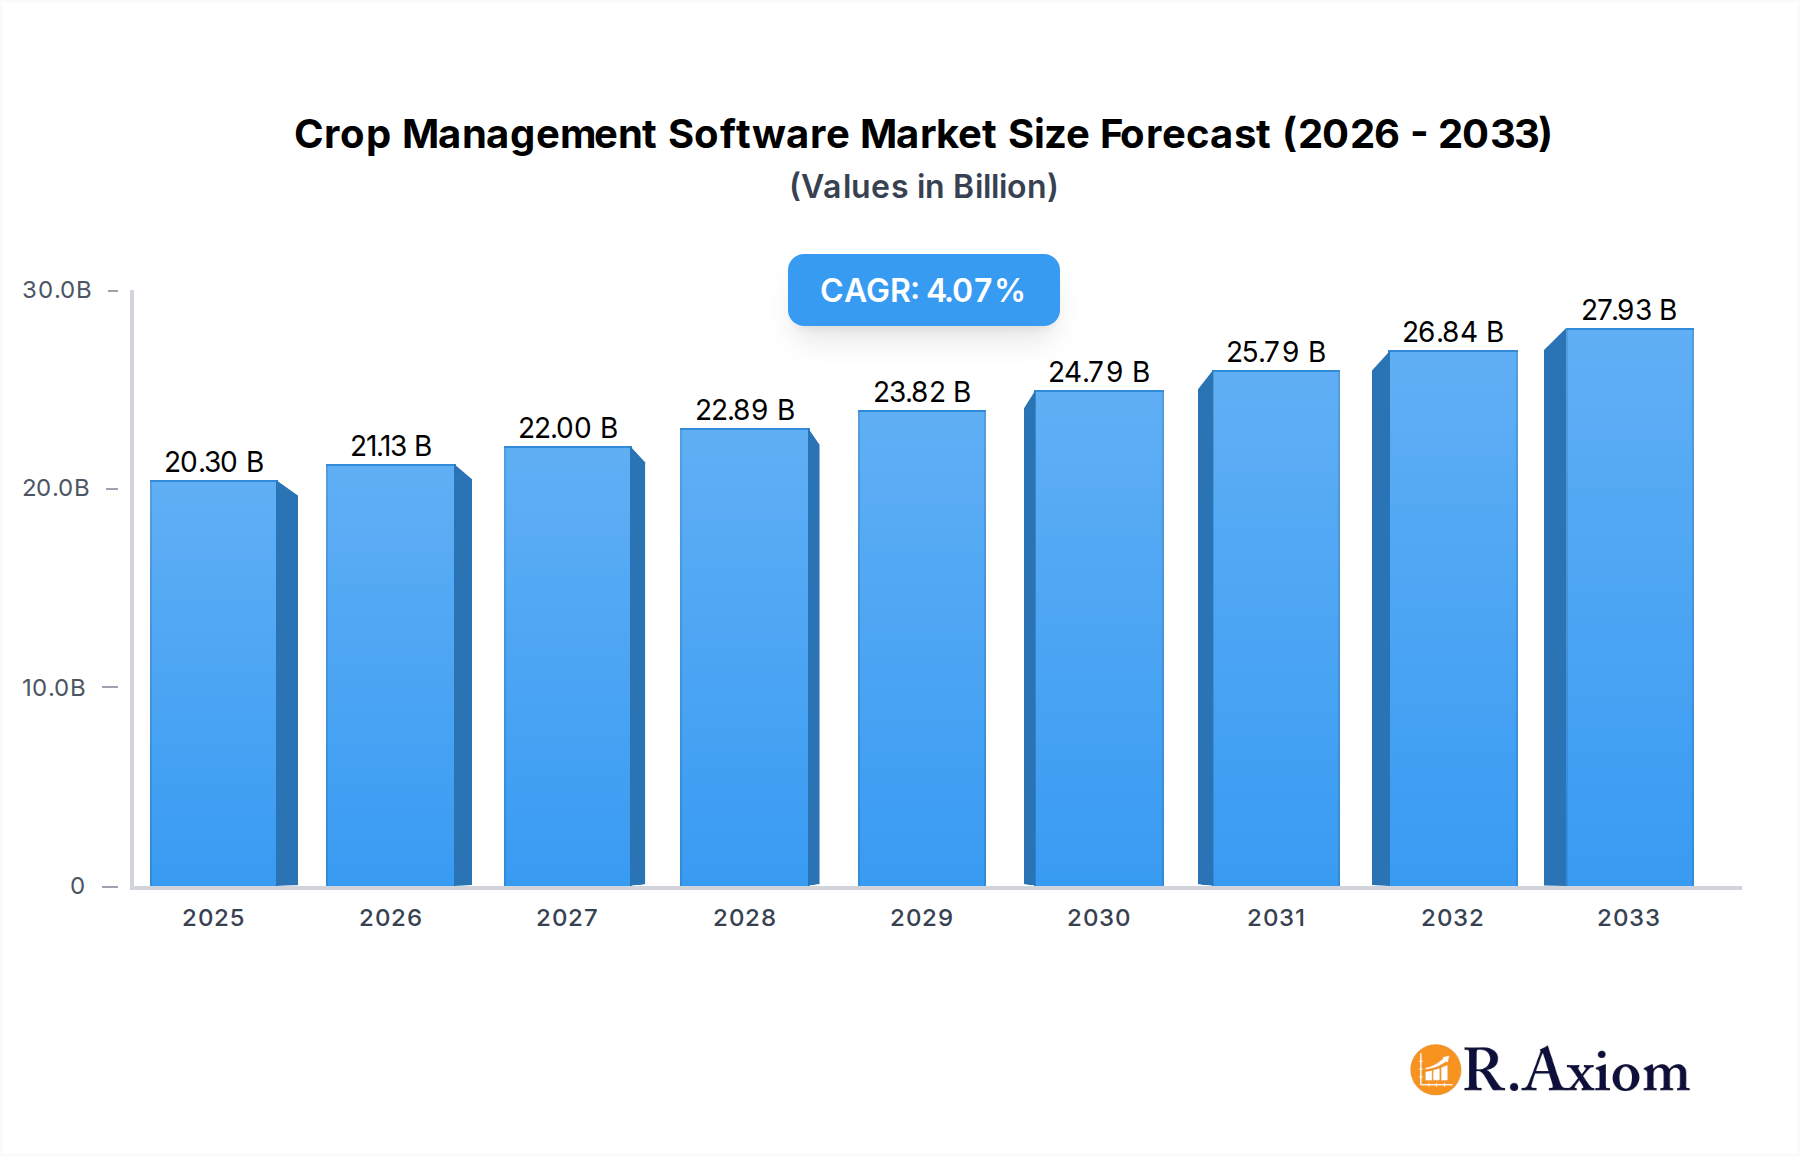
The global Crop Management Software market is poised for significant expansion, projected to reach $20.3 billion in 2025. This robust growth is underpinned by a compound annual growth rate (CAGR) of 4.2%, indicating a steady and consistent upward trajectory over the forecast period extending to 2033. The market is being propelled by critical drivers such as the increasing adoption of precision agriculture techniques, which necessitate sophisticated software solutions for data analysis and operational efficiency. The growing need for enhanced crop yields, improved resource management (water, fertilizers, pesticides), and stringent regulatory compliance further fuels demand. Furthermore, the rising global population and the imperative to ensure food security are driving innovation and investment in technologies that optimize agricultural productivity, with crop management software at the forefront.

Crop Management Software Market Size (In Billion)
The market's expansion is further characterized by key trends including the widespread adoption of cloud-based solutions, offering scalability, accessibility, and advanced analytics capabilities for both large enterprises and SMEs. Web-based platforms are also gaining traction, providing flexible access and user-friendly interfaces. While the market exhibits strong growth potential, certain restraints, such as the initial high cost of implementation and the need for farmer training and digital literacy, may temper growth in specific regions or for smaller agricultural operations. However, the overwhelming benefits in terms of increased profitability, reduced waste, and sustainable farming practices are expected to outweigh these challenges. Prominent players like Croptracker, FarmSoft, and Agrivi are actively contributing to market development through continuous innovation and strategic partnerships.
Crop Management Software Company Market Share
Comprehensive Report: Crop Management Software Market Analysis (2019-2033)
This in-depth report provides a definitive analysis of the global Crop Management Software market, projecting significant growth and evolution over the study period of 2019–2033, with a base year of 2025 and a forecast period from 2025–2033. Leveraging extensive historical data from 2019–2024, this report offers unparalleled insights into market dynamics, key players, and future trajectories.
Crop Management Software Market Concentration & Innovation
The global Crop Management Software market exhibits moderate concentration, with leading companies such as Croptracker, FarmSoft, Agrivi, Cropio, EasyKeeper, Farmbrite, Vertical Solutions, AgData, Farm Matters, and AgriXP carving out substantial market shares. Innovation is primarily driven by the increasing demand for precision agriculture, automation, and data-driven decision-making to optimize crop yields, reduce resource wastage, and enhance sustainability. Regulatory frameworks, while evolving, generally support the adoption of advanced agricultural technologies. Product substitutes, though present in the form of traditional farm management practices, are increasingly being superseded by sophisticated software solutions. End-user trends highlight a growing preference for integrated platforms offering comprehensive farm operations management. Mergers and acquisitions (M&A) activities are anticipated to intensify as larger players seek to expand their technological capabilities and market reach. M&A deal values are projected to escalate, reflecting the strategic importance of acquiring innovative solutions and customer bases.
Crop Management Software Industry Trends & Insights
The Crop Management Software industry is poised for remarkable expansion, driven by a confluence of factors that are reshaping agricultural practices worldwide. The increasing global population necessitates enhanced food production efficiency, making crop management software indispensable for optimizing yields and minimizing losses. The escalating adoption of IoT devices, sensors, and artificial intelligence (AI) in agriculture is fueling demand for integrated software platforms that can process and analyze vast amounts of data for informed decision-making. Precision agriculture, a cornerstone of modern farming, relies heavily on these software solutions to enable targeted application of fertilizers, water, and pesticides, thereby reducing costs and environmental impact. Consumer preferences for sustainably grown, high-quality produce are also pushing farmers towards more advanced management techniques, directly benefiting the crop management software market. The competitive landscape is characterized by continuous innovation, with companies investing heavily in R&D to develop user-friendly, scalable, and feature-rich solutions. The projected Compound Annual Growth Rate (CAGR) for this market is robust, indicating significant market penetration and widespread adoption across diverse agricultural sectors. Technological disruptions, such as the integration of blockchain for supply chain transparency and advanced predictive analytics for disease and pest management, are further accelerating market growth.
Dominant Markets & Segments in Crop Management Software
The Crop Management Software market's dominance is distributed across various regions and segments, driven by specific economic, technological, and environmental factors. In terms of application, Large Enterprises represent a significant segment due to their substantial investment capacity and the complexity of their operations, which benefit immensely from sophisticated, integrated crop management solutions. Their need for large-scale data analysis, resource optimization, and compliance reporting makes them prime adopters of advanced software.
Large Enterprises: Key drivers for this segment include the necessity for robust farm management systems capable of handling extensive land areas, diverse crop types, and complex logistical operations. The adoption of IoT and automation technologies within large-scale agribusinesses further bolsters the demand for enterprise-grade crop management software. Economic policies promoting agricultural modernization and technological advancement in developed economies significantly contribute to the dominance of this segment.
SMEs: Small and Medium-sized Enterprises (SMEs) are increasingly recognizing the value proposition of crop management software, particularly cloud-based solutions that offer scalability and affordability. The growing availability of user-friendly and cost-effective platforms is enabling SMEs to adopt these technologies, improving their efficiency and competitiveness. Government initiatives aimed at supporting smallholder farmers and promoting technological adoption in agriculture are also crucial drivers for this segment.
In terms of type, Cloud Based solutions are exhibiting strong dominance and rapid growth. This is attributed to their inherent flexibility, scalability, accessibility from any device, and reduced upfront IT infrastructure costs.
Cloud Based: The shift towards cloud-based crop management software is propelled by its ability to provide real-time data access, facilitate remote collaboration, and enable seamless integration with other cloud-based services. The subscription-based model makes it financially attractive for a wider range of users, from large enterprises to SMEs. The increasing availability of high-speed internet connectivity globally further supports the widespread adoption of cloud solutions.
Web Based: Web-based solutions, while often overlapping with cloud-based offerings, also represent a significant segment. Their accessibility through standard web browsers without the need for extensive software installation is a key advantage. These platforms are instrumental in providing farmers with critical information and tools for managing their operations effectively, contributing to overall market growth.
Crop Management Software Product Developments
Product developments in the Crop Management Software market are centered on enhancing predictive capabilities, automation, and user experience. Innovations include AI-powered analytics for yield forecasting and pest detection, advanced IoT sensor integration for real-time environmental monitoring, and the development of mobile-first applications for on-field decision-making. Companies are focusing on offering tailored solutions that address specific crop types and regional farming challenges, providing distinct competitive advantages. Integration with farm machinery and supply chain platforms is also a key trend, fostering a more connected and efficient agricultural ecosystem.
Report Scope & Segmentation Analysis
This report provides a comprehensive segmentation analysis of the Crop Management Software market.
Application Segments: The market is segmented by Application into Large Enterprises and SMEs. Large Enterprises are characterized by their significant operational scale and advanced technological adoption, driving demand for comprehensive solutions. SMEs, while smaller in scale, are increasingly adopting scalable and cost-effective cloud-based options to enhance their farming practices.
Type Segments: The market is segmented by Type into Cloud Based and Web Based solutions. Cloud-based software offers flexibility, scalability, and remote accessibility, making it a dominant choice. Web-based solutions provide accessibility via web browsers, catering to a broad user base.
Key Drivers of Crop Management Software Growth
The growth of the Crop Management Software market is propelled by several critical factors. Technologically, the increasing integration of IoT, AI, and machine learning is enabling more precise data analysis and predictive capabilities, leading to optimized resource allocation and yield enhancement. Economically, the rising global demand for food, coupled with the need to improve agricultural productivity and profitability, is a primary driver. Government initiatives and subsidies promoting smart farming and sustainable agricultural practices are further accelerating adoption. Regulatory frameworks encouraging data-driven agriculture and environmental stewardship also play a crucial role.
Challenges in the Crop Management Software Sector
Despite robust growth, the Crop Management Software sector faces several challenges. High initial investment costs for some advanced solutions can be a barrier, particularly for smaller farms. Connectivity issues in remote agricultural areas can hinder the seamless operation of cloud-based and real-time data platforms. Furthermore, the need for digital literacy among farmers and the resistance to adopting new technologies can slow down market penetration. Stringent data privacy regulations and concerns over data security also present ongoing challenges that require careful management and robust compliance measures.
Emerging Opportunities in Crop Management Software
Emerging opportunities in the Crop Management Software market are abundant. The burgeoning demand for sustainable and organic farming practices is creating a need for specialized software solutions that can track and manage these specific requirements. The expansion of precision agriculture into developing economies presents a significant untapped market. Furthermore, the integration of blockchain technology for enhanced supply chain transparency and traceability, along with the development of more sophisticated AI-driven advisory services, represent promising avenues for future growth and innovation.
Leading Players in the Crop Management Software Market
- Croptracker
- FarmSoft
- Agrivi
- Cropio
- EasyKeeper
- Farmbrite
- Vertical Solutions
- AgData
- Farm Matters
- AgriXP
Key Developments in Crop Management Software Industry
- 2023/Q1: Launch of advanced AI-powered pest and disease prediction modules by Agrivi, enhancing proactive farm management.
- 2023/Q2: Croptracker announces strategic partnership with a leading agricultural drone company to integrate aerial imagery analysis into its platform.
- 2022/Y4: FarmSoft acquires a smaller competitor, expanding its market reach and product portfolio in specialty crop management.
- 2022/Y3: Cropio introduces enhanced supply chain traceability features, responding to growing consumer demand for transparent food sourcing.
- 2021/Y2: Farmbrite rolls out a new suite of affordable cloud-based solutions tailored for smallholder farmers, increasing market accessibility.
- 2020/Y1: Vertical Solutions invests heavily in R&D for autonomous farming integration, showcasing future-forward product development.
- 2019/Y1: AgData announces a major data-sharing initiative with research institutions to advance agricultural analytics.
Strategic Outlook for Crop Management Software Market
The strategic outlook for the Crop Management Software market is exceptionally positive. The increasing global imperative for food security, coupled with the accelerating adoption of digital technologies in agriculture, will continue to fuel demand. Investments in R&D, strategic partnerships, and M&A activities will be crucial for players to maintain a competitive edge. The focus on sustainability, precision farming, and data-driven decision-making will drive innovation and create new market opportunities, particularly in emerging economies and for specialized agricultural practices. Cloud-based and AI-integrated solutions are expected to dominate, offering scalable, efficient, and intelligent tools for modern agriculture.
Crop Management Software Segmentation
-
1. Application
- 1.1. Large Enterprises
- 1.2. SMEs
-
2. Types
- 2.1. Cloud Based
- 2.2. Web Based
Crop Management Software Segmentation By Geography
-
1. North America
- 1.1. United States
- 1.2. Canada
- 1.3. Mexico
-
2. South America
- 2.1. Brazil
- 2.2. Argentina
- 2.3. Rest of South America
-
3. Europe
- 3.1. United Kingdom
- 3.2. Germany
- 3.3. France
- 3.4. Italy
- 3.5. Spain
- 3.6. Russia
- 3.7. Benelux
- 3.8. Nordics
- 3.9. Rest of Europe
-
4. Middle East & Africa
- 4.1. Turkey
- 4.2. Israel
- 4.3. GCC
- 4.4. North Africa
- 4.5. South Africa
- 4.6. Rest of Middle East & Africa
-
5. Asia Pacific
- 5.1. China
- 5.2. India
- 5.3. Japan
- 5.4. South Korea
- 5.5. ASEAN
- 5.6. Oceania
- 5.7. Rest of Asia Pacific
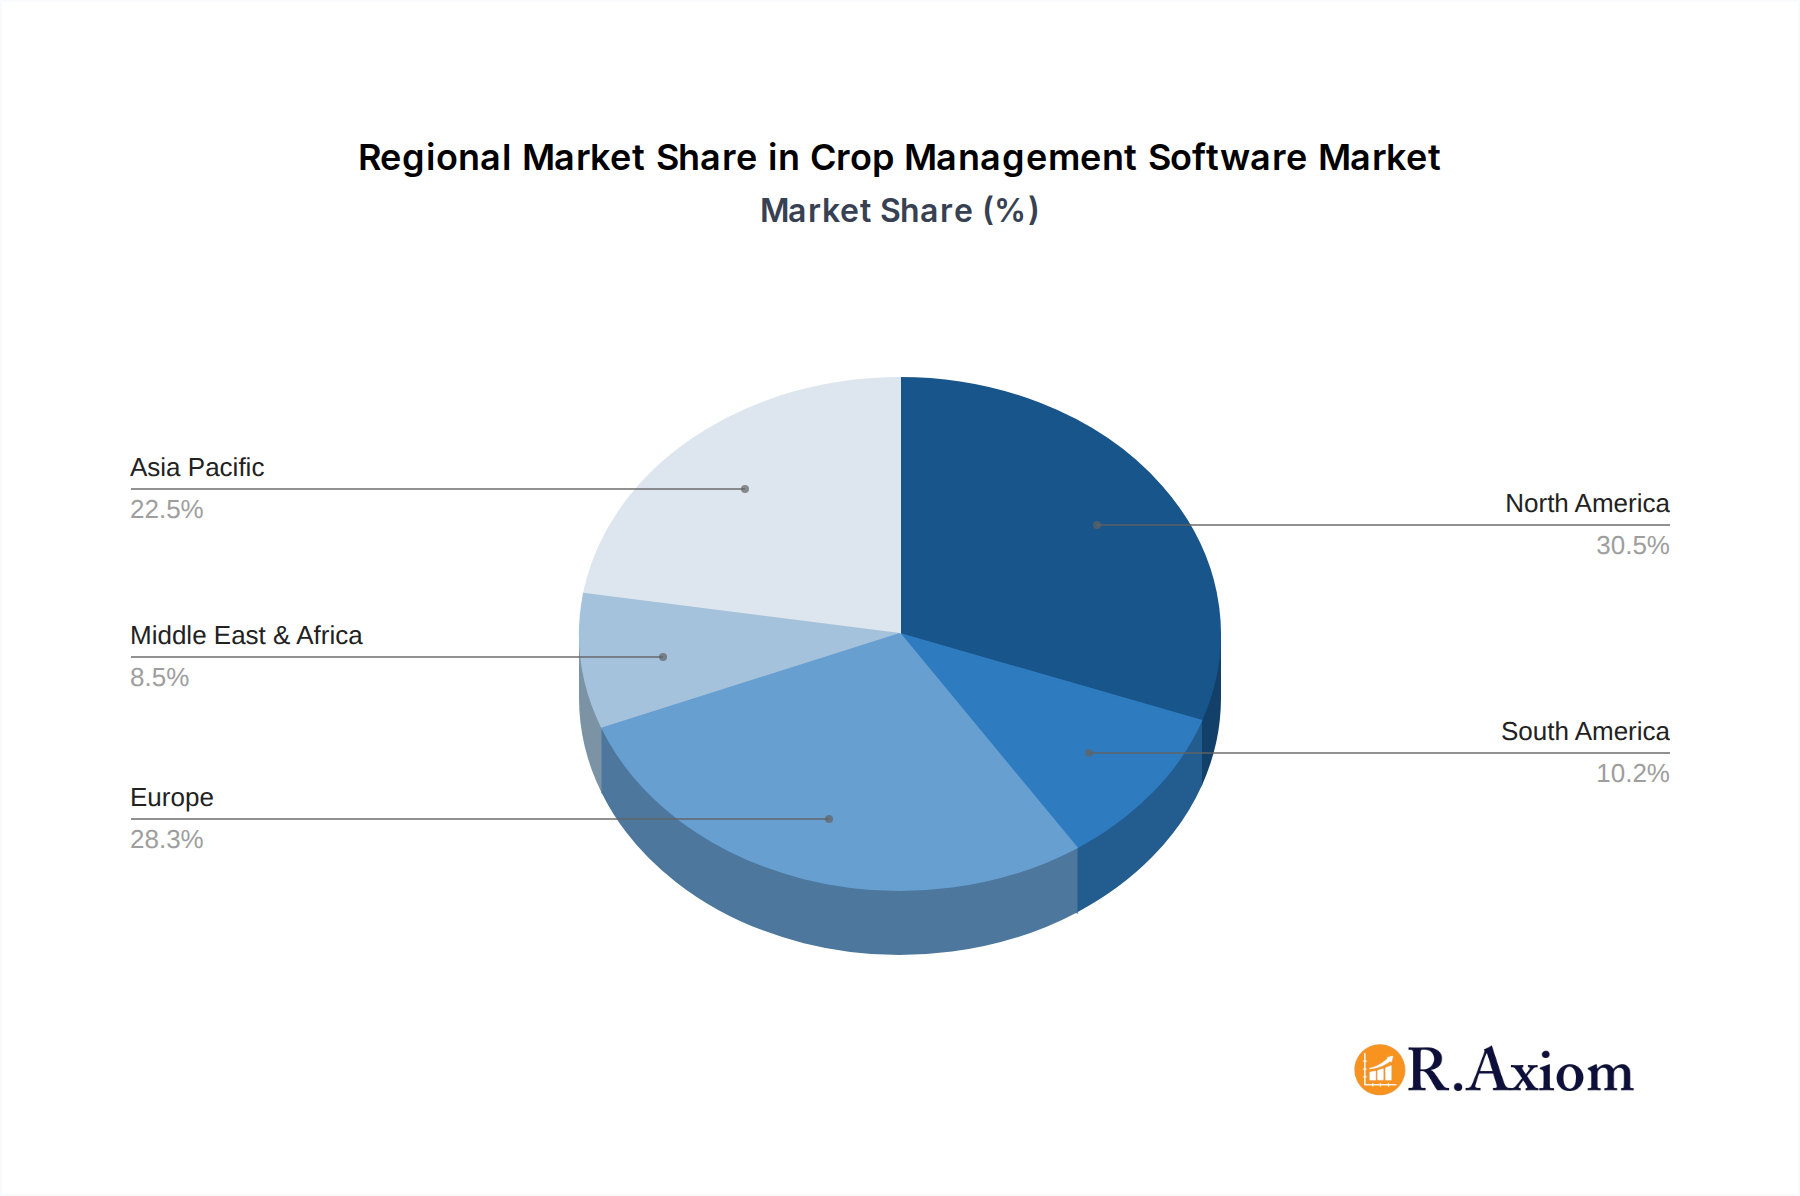
Crop Management Software Regional Market Share
Geographic Coverage of Crop Management Software
Crop Management Software REPORT HIGHLIGHTS
| Aspects | Details |
|---|---|
| Study Period | 2020-2034 |
| Base Year | 2025 |
| Estimated Year | 2026 |
| Forecast Period | 2026-2034 |
| Historical Period | 2020-2025 |
| Growth Rate | CAGR of 17.4% from 2020-2034 |
| Segmentation |
|
Table of Contents
- 1. Introduction
- 1.1. Research Scope
- 1.2. Market Segmentation
- 1.3. Research Objective
- 1.4. Definitions and Assumptions
- 2. Executive Summary
- 2.1. Market Snapshot
- 3. Market Dynamics
- 3.1. Market Drivers
- 3.2. Market Restrains
- 3.3. Market Trends
- 3.4. Market Opportunities
- 4. Market Factor Analysis
- 4.1. Porters Five Forces
- 4.1.1. Bargaining Power of Suppliers
- 4.1.2. Bargaining Power of Buyers
- 4.1.3. Threat of New Entrants
- 4.1.4. Threat of Substitutes
- 4.1.5. Competitive Rivalry
- 4.2. PESTEL analysis
- 4.3. BCG Analysis
- 4.3.1. Stars (High Growth, High Market Share)
- 4.3.2. Cash Cows (Low Growth, High Market Share)
- 4.3.3. Question Mark (High Growth, Low Market Share)
- 4.3.4. Dogs (Low Growth, Low Market Share)
- 4.4. Ansoff Matrix Analysis
- 4.5. Supply Chain Analysis
- 4.6. Regulatory Landscape
- 4.7. Current Market Potential and Opportunity Assessment (TAM–SAM–SOM Framework)
- 4.8. RAX Analyst Note
- 4.1. Porters Five Forces
- 5. Market Analysis, Insights and Forecast 2021-2033
- 5.1. Market Analysis, Insights and Forecast - by Application
- 5.1.1. Large Enterprises
- 5.1.2. SMEs
- 5.2. Market Analysis, Insights and Forecast - by Types
- 5.2.1. Cloud Based
- 5.2.2. Web Based
- 5.3. Market Analysis, Insights and Forecast - by Region
- 5.3.1. North America
- 5.3.2. South America
- 5.3.3. Europe
- 5.3.4. Middle East & Africa
- 5.3.5. Asia Pacific
- 5.1. Market Analysis, Insights and Forecast - by Application
- 6. Global Crop Management Software Analysis, Insights and Forecast, 2021-2033
- 6.1. Market Analysis, Insights and Forecast - by Application
- 6.1.1. Large Enterprises
- 6.1.2. SMEs
- 6.2. Market Analysis, Insights and Forecast - by Types
- 6.2.1. Cloud Based
- 6.2.2. Web Based
- 6.1. Market Analysis, Insights and Forecast - by Application
- 7. North America Crop Management Software Analysis, Insights and Forecast, 2020-2032
- 7.1. Market Analysis, Insights and Forecast - by Application
- 7.1.1. Large Enterprises
- 7.1.2. SMEs
- 7.2. Market Analysis, Insights and Forecast - by Types
- 7.2.1. Cloud Based
- 7.2.2. Web Based
- 7.1. Market Analysis, Insights and Forecast - by Application
- 8. South America Crop Management Software Analysis, Insights and Forecast, 2020-2032
- 8.1. Market Analysis, Insights and Forecast - by Application
- 8.1.1. Large Enterprises
- 8.1.2. SMEs
- 8.2. Market Analysis, Insights and Forecast - by Types
- 8.2.1. Cloud Based
- 8.2.2. Web Based
- 8.1. Market Analysis, Insights and Forecast - by Application
- 9. Europe Crop Management Software Analysis, Insights and Forecast, 2020-2032
- 9.1. Market Analysis, Insights and Forecast - by Application
- 9.1.1. Large Enterprises
- 9.1.2. SMEs
- 9.2. Market Analysis, Insights and Forecast - by Types
- 9.2.1. Cloud Based
- 9.2.2. Web Based
- 9.1. Market Analysis, Insights and Forecast - by Application
- 10. Middle East & Africa Crop Management Software Analysis, Insights and Forecast, 2020-2032
- 10.1. Market Analysis, Insights and Forecast - by Application
- 10.1.1. Large Enterprises
- 10.1.2. SMEs
- 10.2. Market Analysis, Insights and Forecast - by Types
- 10.2.1. Cloud Based
- 10.2.2. Web Based
- 10.1. Market Analysis, Insights and Forecast - by Application
- 11. Asia Pacific Crop Management Software Analysis, Insights and Forecast, 2020-2032
- 11.1. Market Analysis, Insights and Forecast - by Application
- 11.1.1. Large Enterprises
- 11.1.2. SMEs
- 11.2. Market Analysis, Insights and Forecast - by Types
- 11.2.1. Cloud Based
- 11.2.2. Web Based
- 11.1. Market Analysis, Insights and Forecast - by Application
- 12. Competitive Analysis
- 12.1. Company Profiles
- 12.1.1 Croptracker
- 12.1.1.1. Company Overview
- 12.1.1.2. Products
- 12.1.1.3. Company Financials
- 12.1.1.4. SWOT Analysis
- 12.1.2 FarmSoft
- 12.1.2.1. Company Overview
- 12.1.2.2. Products
- 12.1.2.3. Company Financials
- 12.1.2.4. SWOT Analysis
- 12.1.3 Agrivi
- 12.1.3.1. Company Overview
- 12.1.3.2. Products
- 12.1.3.3. Company Financials
- 12.1.3.4. SWOT Analysis
- 12.1.4 Cropio
- 12.1.4.1. Company Overview
- 12.1.4.2. Products
- 12.1.4.3. Company Financials
- 12.1.4.4. SWOT Analysis
- 12.1.5 EasyKeeper
- 12.1.5.1. Company Overview
- 12.1.5.2. Products
- 12.1.5.3. Company Financials
- 12.1.5.4. SWOT Analysis
- 12.1.6 Farmbrite
- 12.1.6.1. Company Overview
- 12.1.6.2. Products
- 12.1.6.3. Company Financials
- 12.1.6.4. SWOT Analysis
- 12.1.7 Vertical Solutions
- 12.1.7.1. Company Overview
- 12.1.7.2. Products
- 12.1.7.3. Company Financials
- 12.1.7.4. SWOT Analysis
- 12.1.8 AgData
- 12.1.8.1. Company Overview
- 12.1.8.2. Products
- 12.1.8.3. Company Financials
- 12.1.8.4. SWOT Analysis
- 12.1.9 Farm Matters
- 12.1.9.1. Company Overview
- 12.1.9.2. Products
- 12.1.9.3. Company Financials
- 12.1.9.4. SWOT Analysis
- 12.1.10 AgriXP
- 12.1.10.1. Company Overview
- 12.1.10.2. Products
- 12.1.10.3. Company Financials
- 12.1.10.4. SWOT Analysis
- 12.1.1 Croptracker
- 12.2. Market Entropy
- 12.2.1 Company's Key Areas Served
- 12.2.2 Recent Developments
- 12.3. Company Market Share Analysis 2025
- 12.3.1 Top 5 Companies Market Share Analysis
- 12.3.2 Top 3 Companies Market Share Analysis
- 12.4. List of Potential Customers
- 13. Research Methodology
List of Figures
- Figure 1: Global Crop Management Software Revenue Breakdown (billion, %) by Region 2025 & 2033
- Figure 2: North America Crop Management Software Revenue (billion), by Application 2025 & 2033
- Figure 3: North America Crop Management Software Revenue Share (%), by Application 2025 & 2033
- Figure 4: North America Crop Management Software Revenue (billion), by Types 2025 & 2033
- Figure 5: North America Crop Management Software Revenue Share (%), by Types 2025 & 2033
- Figure 6: North America Crop Management Software Revenue (billion), by Country 2025 & 2033
- Figure 7: North America Crop Management Software Revenue Share (%), by Country 2025 & 2033
- Figure 8: South America Crop Management Software Revenue (billion), by Application 2025 & 2033
- Figure 9: South America Crop Management Software Revenue Share (%), by Application 2025 & 2033
- Figure 10: South America Crop Management Software Revenue (billion), by Types 2025 & 2033
- Figure 11: South America Crop Management Software Revenue Share (%), by Types 2025 & 2033
- Figure 12: South America Crop Management Software Revenue (billion), by Country 2025 & 2033
- Figure 13: South America Crop Management Software Revenue Share (%), by Country 2025 & 2033
- Figure 14: Europe Crop Management Software Revenue (billion), by Application 2025 & 2033
- Figure 15: Europe Crop Management Software Revenue Share (%), by Application 2025 & 2033
- Figure 16: Europe Crop Management Software Revenue (billion), by Types 2025 & 2033
- Figure 17: Europe Crop Management Software Revenue Share (%), by Types 2025 & 2033
- Figure 18: Europe Crop Management Software Revenue (billion), by Country 2025 & 2033
- Figure 19: Europe Crop Management Software Revenue Share (%), by Country 2025 & 2033
- Figure 20: Middle East & Africa Crop Management Software Revenue (billion), by Application 2025 & 2033
- Figure 21: Middle East & Africa Crop Management Software Revenue Share (%), by Application 2025 & 2033
- Figure 22: Middle East & Africa Crop Management Software Revenue (billion), by Types 2025 & 2033
- Figure 23: Middle East & Africa Crop Management Software Revenue Share (%), by Types 2025 & 2033
- Figure 24: Middle East & Africa Crop Management Software Revenue (billion), by Country 2025 & 2033
- Figure 25: Middle East & Africa Crop Management Software Revenue Share (%), by Country 2025 & 2033
- Figure 26: Asia Pacific Crop Management Software Revenue (billion), by Application 2025 & 2033
- Figure 27: Asia Pacific Crop Management Software Revenue Share (%), by Application 2025 & 2033
- Figure 28: Asia Pacific Crop Management Software Revenue (billion), by Types 2025 & 2033
- Figure 29: Asia Pacific Crop Management Software Revenue Share (%), by Types 2025 & 2033
- Figure 30: Asia Pacific Crop Management Software Revenue (billion), by Country 2025 & 2033
- Figure 31: Asia Pacific Crop Management Software Revenue Share (%), by Country 2025 & 2033
List of Tables
- Table 1: Global Crop Management Software Revenue billion Forecast, by Application 2020 & 2033
- Table 2: Global Crop Management Software Revenue billion Forecast, by Types 2020 & 2033
- Table 3: Global Crop Management Software Revenue billion Forecast, by Region 2020 & 2033
- Table 4: Global Crop Management Software Revenue billion Forecast, by Application 2020 & 2033
- Table 5: Global Crop Management Software Revenue billion Forecast, by Types 2020 & 2033
- Table 6: Global Crop Management Software Revenue billion Forecast, by Country 2020 & 2033
- Table 7: United States Crop Management Software Revenue (billion) Forecast, by Application 2020 & 2033
- Table 8: Canada Crop Management Software Revenue (billion) Forecast, by Application 2020 & 2033
- Table 9: Mexico Crop Management Software Revenue (billion) Forecast, by Application 2020 & 2033
- Table 10: Global Crop Management Software Revenue billion Forecast, by Application 2020 & 2033
- Table 11: Global Crop Management Software Revenue billion Forecast, by Types 2020 & 2033
- Table 12: Global Crop Management Software Revenue billion Forecast, by Country 2020 & 2033
- Table 13: Brazil Crop Management Software Revenue (billion) Forecast, by Application 2020 & 2033
- Table 14: Argentina Crop Management Software Revenue (billion) Forecast, by Application 2020 & 2033
- Table 15: Rest of South America Crop Management Software Revenue (billion) Forecast, by Application 2020 & 2033
- Table 16: Global Crop Management Software Revenue billion Forecast, by Application 2020 & 2033
- Table 17: Global Crop Management Software Revenue billion Forecast, by Types 2020 & 2033
- Table 18: Global Crop Management Software Revenue billion Forecast, by Country 2020 & 2033
- Table 19: United Kingdom Crop Management Software Revenue (billion) Forecast, by Application 2020 & 2033
- Table 20: Germany Crop Management Software Revenue (billion) Forecast, by Application 2020 & 2033
- Table 21: France Crop Management Software Revenue (billion) Forecast, by Application 2020 & 2033
- Table 22: Italy Crop Management Software Revenue (billion) Forecast, by Application 2020 & 2033
- Table 23: Spain Crop Management Software Revenue (billion) Forecast, by Application 2020 & 2033
- Table 24: Russia Crop Management Software Revenue (billion) Forecast, by Application 2020 & 2033
- Table 25: Benelux Crop Management Software Revenue (billion) Forecast, by Application 2020 & 2033
- Table 26: Nordics Crop Management Software Revenue (billion) Forecast, by Application 2020 & 2033
- Table 27: Rest of Europe Crop Management Software Revenue (billion) Forecast, by Application 2020 & 2033
- Table 28: Global Crop Management Software Revenue billion Forecast, by Application 2020 & 2033
- Table 29: Global Crop Management Software Revenue billion Forecast, by Types 2020 & 2033
- Table 30: Global Crop Management Software Revenue billion Forecast, by Country 2020 & 2033
- Table 31: Turkey Crop Management Software Revenue (billion) Forecast, by Application 2020 & 2033
- Table 32: Israel Crop Management Software Revenue (billion) Forecast, by Application 2020 & 2033
- Table 33: GCC Crop Management Software Revenue (billion) Forecast, by Application 2020 & 2033
- Table 34: North Africa Crop Management Software Revenue (billion) Forecast, by Application 2020 & 2033
- Table 35: South Africa Crop Management Software Revenue (billion) Forecast, by Application 2020 & 2033
- Table 36: Rest of Middle East & Africa Crop Management Software Revenue (billion) Forecast, by Application 2020 & 2033
- Table 37: Global Crop Management Software Revenue billion Forecast, by Application 2020 & 2033
- Table 38: Global Crop Management Software Revenue billion Forecast, by Types 2020 & 2033
- Table 39: Global Crop Management Software Revenue billion Forecast, by Country 2020 & 2033
- Table 40: China Crop Management Software Revenue (billion) Forecast, by Application 2020 & 2033
- Table 41: India Crop Management Software Revenue (billion) Forecast, by Application 2020 & 2033
- Table 42: Japan Crop Management Software Revenue (billion) Forecast, by Application 2020 & 2033
- Table 43: South Korea Crop Management Software Revenue (billion) Forecast, by Application 2020 & 2033
- Table 44: ASEAN Crop Management Software Revenue (billion) Forecast, by Application 2020 & 2033
- Table 45: Oceania Crop Management Software Revenue (billion) Forecast, by Application 2020 & 2033
- Table 46: Rest of Asia Pacific Crop Management Software Revenue (billion) Forecast, by Application 2020 & 2033
Frequently Asked Questions
1. What is the projected Compound Annual Growth Rate (CAGR) of the Crop Management Software?
The projected CAGR is approximately 17.4%.
2. Which companies are prominent players in the Crop Management Software?
Key companies in the market include Croptracker, FarmSoft, Agrivi, Cropio, EasyKeeper, Farmbrite, Vertical Solutions, AgData, Farm Matters, AgriXP.
3. What are the main segments of the Crop Management Software?
The market segments include Application, Types.
4. Can you provide details about the market size?
The market size is estimated to be USD 3.4 billion as of 2022.
5. What are some drivers contributing to market growth?
N/A
6. What are the notable trends driving market growth?
N/A
7. Are there any restraints impacting market growth?
N/A
8. Can you provide examples of recent developments in the market?
N/A
9. What pricing options are available for accessing the report?
Pricing options include single-user, multi-user, and enterprise licenses priced at USD 3350.00, USD 5025.00, and USD 6700.00 respectively.
10. Is the market size provided in terms of value or volume?
The market size is provided in terms of value, measured in billion.
11. Are there any specific market keywords associated with the report?
Yes, the market keyword associated with the report is "Crop Management Software," which aids in identifying and referencing the specific market segment covered.
12. How do I determine which pricing option suits my needs best?
The pricing options vary based on user requirements and access needs. Individual users may opt for single-user licenses, while businesses requiring broader access may choose multi-user or enterprise licenses for cost-effective access to the report.
13. Are there any additional resources or data provided in the Crop Management Software report?
While the report offers comprehensive insights, it's advisable to review the specific contents or supplementary materials provided to ascertain if additional resources or data are available.
14. How can I stay updated on further developments or reports in the Crop Management Software?
To stay informed about further developments, trends, and reports in the Crop Management Software, consider subscribing to industry newsletters, following relevant companies and organizations, or regularly checking reputable industry news sources and publications.
Methodology
Step 1 - Identification of Relevant Samples Size from Population Database


Step 2 - Approaches for Defining Global Market Size (Value, Volume* & Price*)

Note*: In applicable scenarios
Step 3 - Data Sources
Primary Research
- Web Analytics
- Survey Reports
- Research Institute
- Latest Research Reports
- Opinion Leaders
Secondary Research
- Annual Reports
- White Paper
- Latest Press Release
- Industry Association
- Paid Database
- Investor Presentations

Step 4 - Data Triangulation
Involves using different sources of information in order to increase the validity of a study
These sources are likely to be stakeholders in a program - participants, other researchers, program staff, other community members, and so on.
Then we put all data in single framework & apply various statistical tools to find out the dynamic on the market.
During the analysis stage, feedback from the stakeholder groups would be compared to determine areas of agreement as well as areas of divergence