

Key Insights
The global cut-resistant gloves market is projected for substantial growth, driven by an escalating emphasis on workplace safety across diverse industries and the increasing demand for advanced personal protective equipment (PPE). With an estimated market size of 12.248 billion in 2025 and a Compound Annual Growth Rate (CAGR) of approximately 11.41%, the market is anticipated to reach significant value by 2033. This expansion is propelled by stringent occupational safety regulations, proactive employer initiatives to minimize workplace accidents, and continuous innovation in material science, resulting in lighter, more comfortable, and exceptionally durable glove solutions. Key sectors, including metal processing, glass manufacturing, and petrochemical industries, are major contributors due to the inherent risks associated with handling sharp or abrasive materials. Furthermore, the increasing adoption of advanced fibers and coating technologies, such as nitrile and PU coatings, provides superior protection without compromising dexterity, thus addressing specialized requirements in fields like disaster relief and fire rescue.
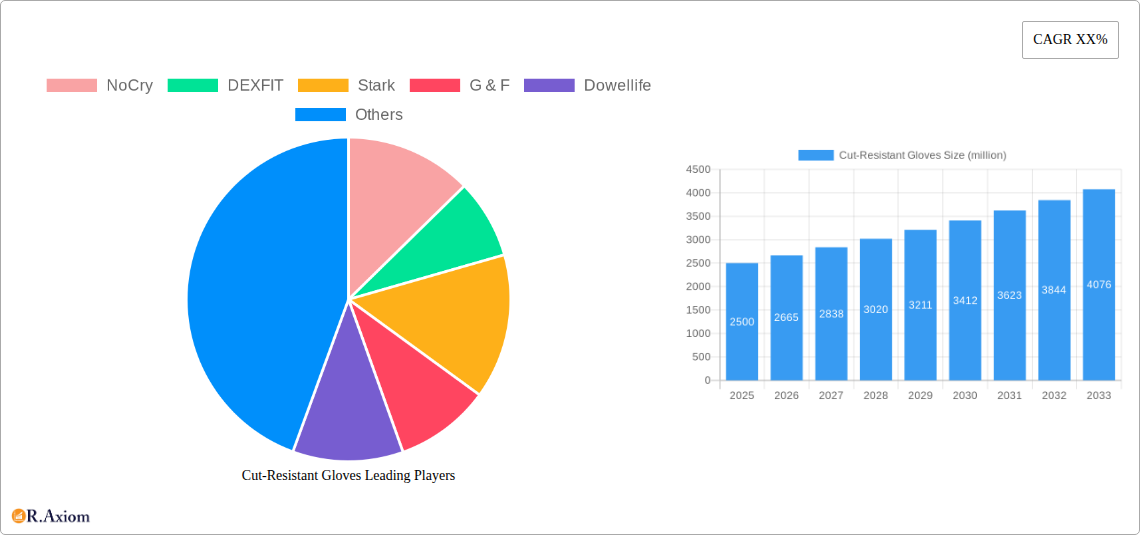
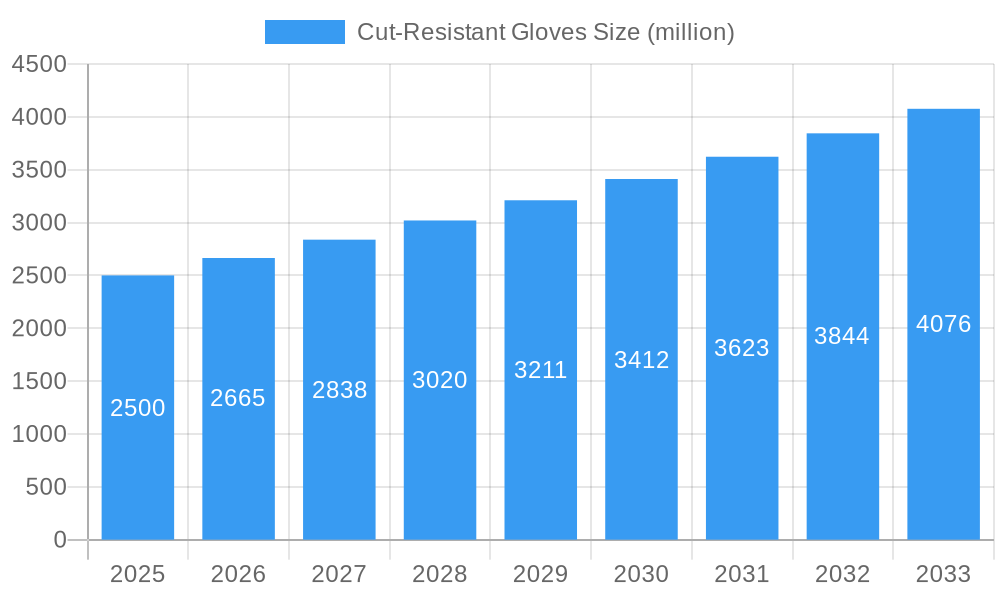
Cut-Resistant Gloves Market Size (In Billion)
Market dynamics are further influenced by evolving industry demands and technological advancements. While established applications continue to drive demand, emerging sectors and niche applications are creating new growth avenues. The market is segmented by application, with key consumption areas including Glass Processing, Metal Processing, Petrochemical, Disaster Relief, and Fire Rescue. Types of cut-resistant gloves are primarily categorized by their coatings, with Nitrile Coating and PU Coating leading the market due to their excellent balance of protection, grip, and durability. Potential restraints, such as the initial investment in high-performance gloves and the availability of less protective but more affordable alternatives, are being mitigated by the long-term cost savings achieved through reduced injuries and operational downtime. The competitive landscape is populated by established industry leaders focused on product innovation and strategic collaborations. Regional analysis highlights strong market presence in North America and Europe, with Asia Pacific demonstrating significant growth potential due to rapid industrialization and heightened safety awareness.
Cut-Resistant Gloves Company Market Share
This comprehensive report, "Cut-Resistant Gloves Market: Global Analysis and Forecast 2019–2033," provides an in-depth examination of the global cut-resistant gloves market. Covering a study period from 2019 to 2033, with a base year of 2025 and a forecast period of 2025–2033, this report offers critical insights for industry stakeholders. It details historical trends from 2019–2024, analyzes current market dynamics in the estimated year of 2025, and projects future growth trajectories. The report explores various market segments, applications, and geographical regions, identifying key growth drivers, emerging opportunities, and significant challenges.
Cut-Resistant Gloves Market Concentration & Innovation
The global cut-resistant gloves market exhibits moderate concentration, with several key players holding significant market share. Innovation is a primary driver, fueled by advancements in material science and protective technologies. Companies are continuously developing gloves with enhanced cut resistance, dexterity, and comfort. Regulatory frameworks, particularly those concerning workplace safety standards and personal protective equipment (PPE), play a crucial role in shaping market demands and product development. For instance, evolving OSHA standards and EN ISO 21420 compliance directly influence manufacturers. Product substitutes, such as thicker leather gloves or specialized sleeves, exist but often compromise on the superior cut protection offered by dedicated cut-resistant gloves. End-user trends lean towards lightweight, breathable, and highly dexterous options that do not hinder performance. Mergers and acquisitions (M&A) activities are sporadic, with some larger PPE manufacturers acquiring smaller, specialized glove companies to expand their product portfolios and market reach. Deal values in M&A activities are estimated to be in the range of tens to hundreds of million, reflecting the strategic importance of specialized PPE segments. The market share of leading companies like Superior Glove and Mechanix Wear is estimated to be approximately 5-8% each, with a combined M&A deal value in the last five years of roughly 75 million.
Cut-Resistant Gloves Industry Trends & Insights
The cut-resistant gloves industry is experiencing robust growth, driven by an increasing emphasis on worker safety across diverse sectors. The projected Compound Annual Growth Rate (CAGR) for the global cut-resistant gloves market is approximately 6.5% for the forecast period 2025–2033. This upward trend is propelled by stringent occupational safety regulations and a heightened awareness of the financial and human costs associated with workplace injuries. Technological disruptions are at the forefront, with manufacturers investing heavily in research and development to integrate advanced materials like UHMWPE (Ultra-High Molecular Weight Polyethylene), Kevlar, and advanced composite fibers. These innovations result in gloves that offer superior cut protection without sacrificing flexibility and comfort, crucial for high-dexterity tasks. Consumer preferences are evolving, with a demand for gloves that provide not only protection but also ergonomic design, breathability, and durability. The trend towards customization and specialized glove solutions for specific applications is also gaining momentum. Competitive dynamics are characterized by intense innovation and strategic partnerships. Companies are differentiating themselves through proprietary material blends, unique coating technologies, and tailored product offerings for niche markets. Market penetration is deepening across developing economies as safety standards are harmonized and industrial activities expand. For example, the automotive sector's adoption of advanced materials and manufacturing processes is directly correlating with an increased demand for high-performance cut-resistant gloves. The petrochemical industry's need for enhanced protection against sharp objects and chemical exposure further fuels market expansion. Emerging applications in areas like renewable energy installation and advanced manufacturing are also contributing significantly to market growth. The overall market size is projected to reach over 3,500 million by 2033.
Dominant Markets & Segments in Cut-Resistant Gloves
The Metal Processing segment stands out as a dominant market within the broader cut-resistant gloves landscape. This dominance is attributed to the inherent risks associated with handling sharp metal sheets, components, and machinery, leading to a consistent and high demand for protective gear. Economic policies supporting manufacturing growth, coupled with robust infrastructure development in regions like North America and Europe, further bolster this segment. The Petrochemical sector also represents a significant and growing segment, driven by the need for specialized gloves offering not only cut resistance but also protection against chemicals and extreme temperatures.
Metal Processing:
- Key Drivers: High frequency of hand injuries from sharp edges, rigorous safety standards in metal fabrication, growth in industrial automation requiring precise handling of materials, and the presence of established manufacturing hubs.
- Dominance Analysis: This segment accounts for an estimated 25% of the total cut-resistant gloves market share. The increasing production of automobiles, construction materials, and industrial machinery directly fuels the demand for cut-resistant gloves in metal processing. Countries with strong automotive and heavy machinery manufacturing industries, such as Germany, the United States, and China, are key contributors.
Petrochemical:
- Key Drivers: Stringent safety regulations for handling hazardous materials, operations in environments with potential for sharp object exposure (e.g., pipelines, drilling equipment), and the need for multi-hazard protection.
- Dominance Analysis: This segment is projected to witness a CAGR of approximately 7.2% due to ongoing global energy demands and infrastructure projects. The expansion of refining capabilities and the exploration of new oil and gas reserves contribute to sustained demand.
Glass Processing:
- Key Drivers: The inherent fragility and sharp edges of glass materials, demanding precise handling and robust protection. Growth in construction and the automotive industry, which utilize significant amounts of glass, is a key factor.
- Dominance Analysis: This segment represents about 18% of the market, with consistent demand from architectural glass manufacturers, automotive glass suppliers, and consumer electronics producers.
Carnivorous Segmentation (Food Processing):
- Key Drivers: The need for hygienic and cut-resistant gloves to protect workers from sharp knives and cutting tools in meat, poultry, and seafood processing plants.
- Dominance Analysis: While not as large as metal processing, this segment shows steady growth, with an estimated 10% market share, driven by increasing global demand for protein and evolving food safety standards.
Disaster Relief & Fire Rescue:
- Key Drivers: The critical need for durable and protective gloves that can withstand various hazards, including sharp debris, during emergency response operations.
- Dominance Analysis: This segment, though smaller in volume, is characterized by high-value, specialized products, contributing approximately 5% to the market share.
Types of Coatings:
- Nitrile Coating: Dominant due to its excellent grip in wet and oily conditions, chemical resistance, and durability, making it ideal for metalworking and food handling.
- PU Coating: Preferred for its high dexterity, breathability, and good abrasion resistance, suitable for electronics assembly and general industrial tasks.
- Emulsion Coating: Offers a balance of protection and flexibility, finding applications in various general-purpose industrial tasks.
- Others (e.g., Latex, PVC): Cater to specific niche requirements and specialized applications.
Cut-Resistant Gloves Product Developments
Recent product developments in cut-resistant gloves are centered on advanced material integration and enhanced user experience. Innovations include the use of proprietary blends of high-performance fibers such as Dyneema® and Spectra® for superior cut resistance, coupled with ergonomic designs that improve dexterity and reduce hand fatigue. Manufacturers are also focusing on breathable linings and water-repellent coatings to enhance comfort for prolonged use in demanding environments. These developments aim to meet the evolving needs of industries requiring specialized protection, such as advanced manufacturing and renewable energy installation, offering competitive advantages through superior performance and wearer acceptance. The market is seeing a trend towards gloves with integrated touch-screen compatibility, adding further utility for workers using digital devices on the job.
Report Scope & Segmentation Analysis
This report provides an exhaustive analysis of the global cut-resistant gloves market. The segmentation includes:
Application:
- Carnivorous Segmentation: This segment encompasses gloves used in meat processing, butchery, and poultry handling, where sharp blades and cutting tools are prevalent. Projections indicate a steady growth of 5.5% driven by global food demand.
- Glass Processing: Gloves for handling glass, crucial in construction and manufacturing. Market size is estimated at 450 million with a projected CAGR of 6.0%.
- Metal Processing: A significant segment covering metal fabrication, automotive, and heavy industry. It represents approximately 25% of the market, with a CAGR of 6.8%.
- Petrochemical: Gloves for the oil and gas industry, requiring resistance to cuts and chemicals. This segment is expected to grow at 7.2% CAGR.
- Disaster Relief: Protective gloves for emergency responders, with a niche but vital market.
- Fire Rescue: Specialized gloves for firefighters, offering high levels of cut, heat, and flame resistance.
Types:
- Nitrile Coating: Dominant type, offering excellent grip and chemical resistance. Estimated market share of 35%.
- PU Coating: Valued for dexterity and breathability.
- Emulsion Coating: Balances protection and flexibility for general use.
- Others: Specialized coatings for unique applications.
Key Drivers of Cut-Resistant Gloves Growth
The growth of the cut-resistant gloves market is propelled by several key factors. Foremost is the increasing stringency of occupational health and safety regulations globally, mandating the use of appropriate personal protective equipment (PPE). This is complemented by a growing awareness among both employers and employees regarding the importance of preventing hand injuries, which can lead to significant downtime and compensation costs. Technological advancements in material science are continuously yielding lighter, more flexible, and highly durable cut-resistant fibers, enhancing product performance and wearer comfort. Furthermore, the expansion of industries such as metal fabrication, construction, and food processing, particularly in emerging economies, directly translates into higher demand for protective gloves. For instance, government initiatives promoting industrial safety in countries like India and Brazil are significant growth catalysts.
Challenges in the Cut-Resistant Gloves Sector
Despite robust growth, the cut-resistant gloves sector faces several challenges. Regulatory compliance can be complex, with varying standards across different regions, requiring manufacturers to invest in certifications and product testing. Supply chain disruptions, particularly for specialized raw materials like high-performance fibers, can impact production and lead times. Intense competition among manufacturers, including both established brands and new entrants, leads to price pressures and necessitates continuous innovation to maintain market share. The development of cost-effective solutions that meet stringent safety requirements remains a constant challenge. Furthermore, educating end-users about the correct selection and use of cut-resistant gloves for specific applications is crucial to ensure optimal protection and prevent misuse. The estimated impact of supply chain disruptions on market growth is around 0.5% annually.
Emerging Opportunities in Cut-Resistant Gloves
Emerging opportunities in the cut-resistant gloves market are abundant, driven by innovation and evolving industry needs. The development of smart gloves integrated with sensors for monitoring worker vitals or environmental conditions presents a significant growth avenue. Expansion into niche applications like advanced manufacturing (e.g., 3D printing, robotics) and the renewable energy sector (e.g., solar panel installation) offers new market potential. The increasing demand for sustainable and eco-friendly protective equipment is also creating opportunities for manufacturers developing gloves from recycled materials or bio-based fibers. Furthermore, the growing e-commerce channel provides a direct route to market for specialized and custom-designed gloves, catering to a wider range of industrial and individual needs. The development of anti-microbial coatings for gloves used in food handling and healthcare also represents a promising expansion area.
Leading Players in the Cut-Resistant Gloves Market
- NoCry
- DEXFIT
- Stark
- G & F
- Dowellife
- Seibertron
- Superior Glove
- Youngstown
- Maxiflex
- Mechanix Wear
Key Developments in Cut-Resistant Gloves Industry
- 2023: Superior Glove launches a new line of cut-resistant gloves featuring a proprietary blend of advanced composite fibers for enhanced dexterity and protection in metal fabrication.
- 2022: Mechanix Wear introduces innovative glove designs with enhanced grip technology for use in automotive repair and maintenance, catering to increasing demand in the automotive aftermarket.
- 2021: DEXFIT expands its product offerings with specialized cut-resistant gloves for the glass industry, emphasizing improved comfort and tactile sensitivity.
- 2020: G & F enhances its existing range of cut-resistant gloves with advanced coatings offering improved chemical resistance for the petrochemical sector.
- 2019: Seibertron focuses on research and development for lightweight, breathable cut-resistant gloves for general industrial applications, aiming to capture a larger share of the broad market.
Strategic Outlook for Cut-Resistant Gloves Market
The strategic outlook for the cut-resistant gloves market remains exceptionally positive, driven by persistent demand for enhanced workplace safety and continuous technological advancements. Future growth will be significantly influenced by the adoption of advanced materials, the integration of smart technologies into protective gear, and the expansion into emerging industrial sectors such as electric vehicle manufacturing and sustainable energy production. Manufacturers that can effectively balance high-performance protection with user comfort and sustainability will be well-positioned for success. Strategic collaborations, mergers, and acquisitions are expected to continue as companies seek to consolidate market presence, acquire innovative technologies, and expand their product portfolios to meet the diverse needs of a global clientele. The increasing emphasis on worker well-being and regulatory compliance across all industries will ensure a sustained and growing market for cut-resistant gloves. The market is projected to reach over 4,000 million by 2033.
Cut-Resistant Gloves Segmentation
-
1. Application
- 1.1. Carnivorous Segmentation
- 1.2. Glass Processing
- 1.3. Metal Processing
- 1.4. Petrochemical
- 1.5. Disaster Relief
- 1.6. Fire Rescue
-
2. Types
- 2.1. Nitrile Coating
- 2.2. PU Coating
- 2.3. Emulsion Coating
- 2.4. Others
Cut-Resistant Gloves Segmentation By Geography
-
1. North America
- 1.1. United States
- 1.2. Canada
- 1.3. Mexico
-
2. South America
- 2.1. Brazil
- 2.2. Argentina
- 2.3. Rest of South America
-
3. Europe
- 3.1. United Kingdom
- 3.2. Germany
- 3.3. France
- 3.4. Italy
- 3.5. Spain
- 3.6. Russia
- 3.7. Benelux
- 3.8. Nordics
- 3.9. Rest of Europe
-
4. Middle East & Africa
- 4.1. Turkey
- 4.2. Israel
- 4.3. GCC
- 4.4. North Africa
- 4.5. South Africa
- 4.6. Rest of Middle East & Africa
-
5. Asia Pacific
- 5.1. China
- 5.2. India
- 5.3. Japan
- 5.4. South Korea
- 5.5. ASEAN
- 5.6. Oceania
- 5.7. Rest of Asia Pacific
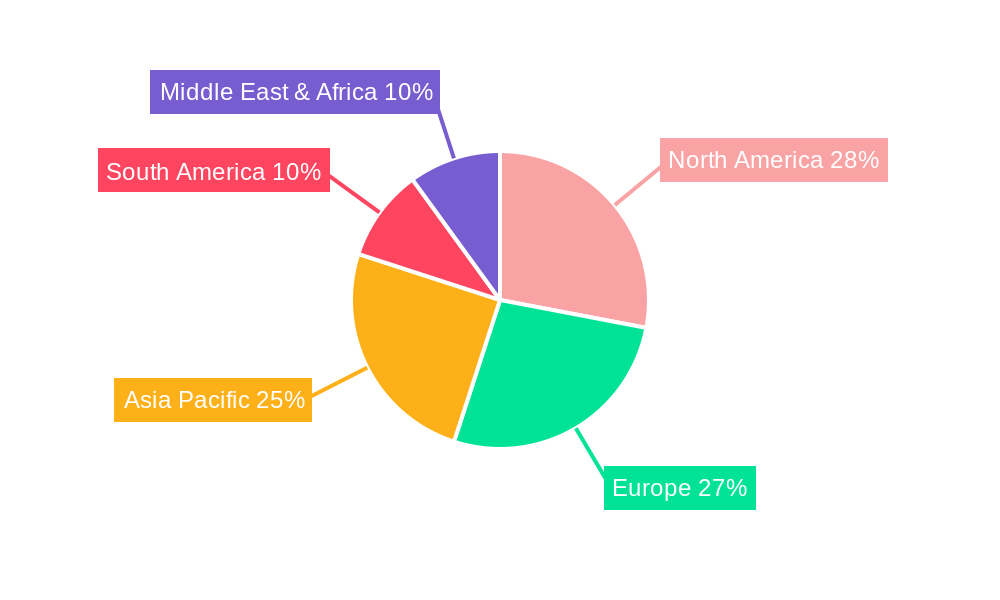
Cut-Resistant Gloves Regional Market Share
Geographic Coverage of Cut-Resistant Gloves
Cut-Resistant Gloves REPORT HIGHLIGHTS
| Aspects | Details |
|---|---|
| Study Period | 2020-2034 |
| Base Year | 2025 |
| Estimated Year | 2026 |
| Forecast Period | 2026-2034 |
| Historical Period | 2020-2025 |
| Growth Rate | CAGR of 11.41% from 2020-2034 |
| Segmentation |
|
Table of Contents
- 1. Introduction
- 1.1. Research Scope
- 1.2. Market Segmentation
- 1.3. Research Methodology
- 1.4. Definitions and Assumptions
- 2. Executive Summary
- 2.1. Introduction
- 3. Market Dynamics
- 3.1. Introduction
- 3.2. Market Drivers
- 3.3. Market Restrains
- 3.4. Market Trends
- 4. Market Factor Analysis
- 4.1. Porters Five Forces
- 4.2. Supply/Value Chain
- 4.3. PESTEL analysis
- 4.4. Market Entropy
- 4.5. Patent/Trademark Analysis
- 5. Global Cut-Resistant Gloves Analysis, Insights and Forecast, 2020-2032
- 5.1. Market Analysis, Insights and Forecast - by Application
- 5.1.1. Carnivorous Segmentation
- 5.1.2. Glass Processing
- 5.1.3. Metal Processing
- 5.1.4. Petrochemical
- 5.1.5. Disaster Relief
- 5.1.6. Fire Rescue
- 5.2. Market Analysis, Insights and Forecast - by Types
- 5.2.1. Nitrile Coating
- 5.2.2. PU Coating
- 5.2.3. Emulsion Coating
- 5.2.4. Others
- 5.3. Market Analysis, Insights and Forecast - by Region
- 5.3.1. North America
- 5.3.2. South America
- 5.3.3. Europe
- 5.3.4. Middle East & Africa
- 5.3.5. Asia Pacific
- 5.1. Market Analysis, Insights and Forecast - by Application
- 6. North America Cut-Resistant Gloves Analysis, Insights and Forecast, 2020-2032
- 6.1. Market Analysis, Insights and Forecast - by Application
- 6.1.1. Carnivorous Segmentation
- 6.1.2. Glass Processing
- 6.1.3. Metal Processing
- 6.1.4. Petrochemical
- 6.1.5. Disaster Relief
- 6.1.6. Fire Rescue
- 6.2. Market Analysis, Insights and Forecast - by Types
- 6.2.1. Nitrile Coating
- 6.2.2. PU Coating
- 6.2.3. Emulsion Coating
- 6.2.4. Others
- 6.1. Market Analysis, Insights and Forecast - by Application
- 7. South America Cut-Resistant Gloves Analysis, Insights and Forecast, 2020-2032
- 7.1. Market Analysis, Insights and Forecast - by Application
- 7.1.1. Carnivorous Segmentation
- 7.1.2. Glass Processing
- 7.1.3. Metal Processing
- 7.1.4. Petrochemical
- 7.1.5. Disaster Relief
- 7.1.6. Fire Rescue
- 7.2. Market Analysis, Insights and Forecast - by Types
- 7.2.1. Nitrile Coating
- 7.2.2. PU Coating
- 7.2.3. Emulsion Coating
- 7.2.4. Others
- 7.1. Market Analysis, Insights and Forecast - by Application
- 8. Europe Cut-Resistant Gloves Analysis, Insights and Forecast, 2020-2032
- 8.1. Market Analysis, Insights and Forecast - by Application
- 8.1.1. Carnivorous Segmentation
- 8.1.2. Glass Processing
- 8.1.3. Metal Processing
- 8.1.4. Petrochemical
- 8.1.5. Disaster Relief
- 8.1.6. Fire Rescue
- 8.2. Market Analysis, Insights and Forecast - by Types
- 8.2.1. Nitrile Coating
- 8.2.2. PU Coating
- 8.2.3. Emulsion Coating
- 8.2.4. Others
- 8.1. Market Analysis, Insights and Forecast - by Application
- 9. Middle East & Africa Cut-Resistant Gloves Analysis, Insights and Forecast, 2020-2032
- 9.1. Market Analysis, Insights and Forecast - by Application
- 9.1.1. Carnivorous Segmentation
- 9.1.2. Glass Processing
- 9.1.3. Metal Processing
- 9.1.4. Petrochemical
- 9.1.5. Disaster Relief
- 9.1.6. Fire Rescue
- 9.2. Market Analysis, Insights and Forecast - by Types
- 9.2.1. Nitrile Coating
- 9.2.2. PU Coating
- 9.2.3. Emulsion Coating
- 9.2.4. Others
- 9.1. Market Analysis, Insights and Forecast - by Application
- 10. Asia Pacific Cut-Resistant Gloves Analysis, Insights and Forecast, 2020-2032
- 10.1. Market Analysis, Insights and Forecast - by Application
- 10.1.1. Carnivorous Segmentation
- 10.1.2. Glass Processing
- 10.1.3. Metal Processing
- 10.1.4. Petrochemical
- 10.1.5. Disaster Relief
- 10.1.6. Fire Rescue
- 10.2. Market Analysis, Insights and Forecast - by Types
- 10.2.1. Nitrile Coating
- 10.2.2. PU Coating
- 10.2.3. Emulsion Coating
- 10.2.4. Others
- 10.1. Market Analysis, Insights and Forecast - by Application
- 11. Competitive Analysis
- 11.1. Global Market Share Analysis 2025
- 11.2. Company Profiles
- 11.2.1 NoCry
- 11.2.1.1. Overview
- 11.2.1.2. Products
- 11.2.1.3. SWOT Analysis
- 11.2.1.4. Recent Developments
- 11.2.1.5. Financials (Based on Availability)
- 11.2.2 DEXFIT
- 11.2.2.1. Overview
- 11.2.2.2. Products
- 11.2.2.3. SWOT Analysis
- 11.2.2.4. Recent Developments
- 11.2.2.5. Financials (Based on Availability)
- 11.2.3 Stark
- 11.2.3.1. Overview
- 11.2.3.2. Products
- 11.2.3.3. SWOT Analysis
- 11.2.3.4. Recent Developments
- 11.2.3.5. Financials (Based on Availability)
- 11.2.4 G & F
- 11.2.4.1. Overview
- 11.2.4.2. Products
- 11.2.4.3. SWOT Analysis
- 11.2.4.4. Recent Developments
- 11.2.4.5. Financials (Based on Availability)
- 11.2.5 Dowellife
- 11.2.5.1. Overview
- 11.2.5.2. Products
- 11.2.5.3. SWOT Analysis
- 11.2.5.4. Recent Developments
- 11.2.5.5. Financials (Based on Availability)
- 11.2.6 Seibertron
- 11.2.6.1. Overview
- 11.2.6.2. Products
- 11.2.6.3. SWOT Analysis
- 11.2.6.4. Recent Developments
- 11.2.6.5. Financials (Based on Availability)
- 11.2.7 Superior Glove
- 11.2.7.1. Overview
- 11.2.7.2. Products
- 11.2.7.3. SWOT Analysis
- 11.2.7.4. Recent Developments
- 11.2.7.5. Financials (Based on Availability)
- 11.2.8 Youngstown
- 11.2.8.1. Overview
- 11.2.8.2. Products
- 11.2.8.3. SWOT Analysis
- 11.2.8.4. Recent Developments
- 11.2.8.5. Financials (Based on Availability)
- 11.2.9 Maxiflex
- 11.2.9.1. Overview
- 11.2.9.2. Products
- 11.2.9.3. SWOT Analysis
- 11.2.9.4. Recent Developments
- 11.2.9.5. Financials (Based on Availability)
- 11.2.10 Mechanix Wear
- 11.2.10.1. Overview
- 11.2.10.2. Products
- 11.2.10.3. SWOT Analysis
- 11.2.10.4. Recent Developments
- 11.2.10.5. Financials (Based on Availability)
- 11.2.1 NoCry
List of Figures
- Figure 1: Global Cut-Resistant Gloves Revenue Breakdown (billion, %) by Region 2025 & 2033
- Figure 2: Global Cut-Resistant Gloves Volume Breakdown (K, %) by Region 2025 & 2033
- Figure 3: North America Cut-Resistant Gloves Revenue (billion), by Application 2025 & 2033
- Figure 4: North America Cut-Resistant Gloves Volume (K), by Application 2025 & 2033
- Figure 5: North America Cut-Resistant Gloves Revenue Share (%), by Application 2025 & 2033
- Figure 6: North America Cut-Resistant Gloves Volume Share (%), by Application 2025 & 2033
- Figure 7: North America Cut-Resistant Gloves Revenue (billion), by Types 2025 & 2033
- Figure 8: North America Cut-Resistant Gloves Volume (K), by Types 2025 & 2033
- Figure 9: North America Cut-Resistant Gloves Revenue Share (%), by Types 2025 & 2033
- Figure 10: North America Cut-Resistant Gloves Volume Share (%), by Types 2025 & 2033
- Figure 11: North America Cut-Resistant Gloves Revenue (billion), by Country 2025 & 2033
- Figure 12: North America Cut-Resistant Gloves Volume (K), by Country 2025 & 2033
- Figure 13: North America Cut-Resistant Gloves Revenue Share (%), by Country 2025 & 2033
- Figure 14: North America Cut-Resistant Gloves Volume Share (%), by Country 2025 & 2033
- Figure 15: South America Cut-Resistant Gloves Revenue (billion), by Application 2025 & 2033
- Figure 16: South America Cut-Resistant Gloves Volume (K), by Application 2025 & 2033
- Figure 17: South America Cut-Resistant Gloves Revenue Share (%), by Application 2025 & 2033
- Figure 18: South America Cut-Resistant Gloves Volume Share (%), by Application 2025 & 2033
- Figure 19: South America Cut-Resistant Gloves Revenue (billion), by Types 2025 & 2033
- Figure 20: South America Cut-Resistant Gloves Volume (K), by Types 2025 & 2033
- Figure 21: South America Cut-Resistant Gloves Revenue Share (%), by Types 2025 & 2033
- Figure 22: South America Cut-Resistant Gloves Volume Share (%), by Types 2025 & 2033
- Figure 23: South America Cut-Resistant Gloves Revenue (billion), by Country 2025 & 2033
- Figure 24: South America Cut-Resistant Gloves Volume (K), by Country 2025 & 2033
- Figure 25: South America Cut-Resistant Gloves Revenue Share (%), by Country 2025 & 2033
- Figure 26: South America Cut-Resistant Gloves Volume Share (%), by Country 2025 & 2033
- Figure 27: Europe Cut-Resistant Gloves Revenue (billion), by Application 2025 & 2033
- Figure 28: Europe Cut-Resistant Gloves Volume (K), by Application 2025 & 2033
- Figure 29: Europe Cut-Resistant Gloves Revenue Share (%), by Application 2025 & 2033
- Figure 30: Europe Cut-Resistant Gloves Volume Share (%), by Application 2025 & 2033
- Figure 31: Europe Cut-Resistant Gloves Revenue (billion), by Types 2025 & 2033
- Figure 32: Europe Cut-Resistant Gloves Volume (K), by Types 2025 & 2033
- Figure 33: Europe Cut-Resistant Gloves Revenue Share (%), by Types 2025 & 2033
- Figure 34: Europe Cut-Resistant Gloves Volume Share (%), by Types 2025 & 2033
- Figure 35: Europe Cut-Resistant Gloves Revenue (billion), by Country 2025 & 2033
- Figure 36: Europe Cut-Resistant Gloves Volume (K), by Country 2025 & 2033
- Figure 37: Europe Cut-Resistant Gloves Revenue Share (%), by Country 2025 & 2033
- Figure 38: Europe Cut-Resistant Gloves Volume Share (%), by Country 2025 & 2033
- Figure 39: Middle East & Africa Cut-Resistant Gloves Revenue (billion), by Application 2025 & 2033
- Figure 40: Middle East & Africa Cut-Resistant Gloves Volume (K), by Application 2025 & 2033
- Figure 41: Middle East & Africa Cut-Resistant Gloves Revenue Share (%), by Application 2025 & 2033
- Figure 42: Middle East & Africa Cut-Resistant Gloves Volume Share (%), by Application 2025 & 2033
- Figure 43: Middle East & Africa Cut-Resistant Gloves Revenue (billion), by Types 2025 & 2033
- Figure 44: Middle East & Africa Cut-Resistant Gloves Volume (K), by Types 2025 & 2033
- Figure 45: Middle East & Africa Cut-Resistant Gloves Revenue Share (%), by Types 2025 & 2033
- Figure 46: Middle East & Africa Cut-Resistant Gloves Volume Share (%), by Types 2025 & 2033
- Figure 47: Middle East & Africa Cut-Resistant Gloves Revenue (billion), by Country 2025 & 2033
- Figure 48: Middle East & Africa Cut-Resistant Gloves Volume (K), by Country 2025 & 2033
- Figure 49: Middle East & Africa Cut-Resistant Gloves Revenue Share (%), by Country 2025 & 2033
- Figure 50: Middle East & Africa Cut-Resistant Gloves Volume Share (%), by Country 2025 & 2033
- Figure 51: Asia Pacific Cut-Resistant Gloves Revenue (billion), by Application 2025 & 2033
- Figure 52: Asia Pacific Cut-Resistant Gloves Volume (K), by Application 2025 & 2033
- Figure 53: Asia Pacific Cut-Resistant Gloves Revenue Share (%), by Application 2025 & 2033
- Figure 54: Asia Pacific Cut-Resistant Gloves Volume Share (%), by Application 2025 & 2033
- Figure 55: Asia Pacific Cut-Resistant Gloves Revenue (billion), by Types 2025 & 2033
- Figure 56: Asia Pacific Cut-Resistant Gloves Volume (K), by Types 2025 & 2033
- Figure 57: Asia Pacific Cut-Resistant Gloves Revenue Share (%), by Types 2025 & 2033
- Figure 58: Asia Pacific Cut-Resistant Gloves Volume Share (%), by Types 2025 & 2033
- Figure 59: Asia Pacific Cut-Resistant Gloves Revenue (billion), by Country 2025 & 2033
- Figure 60: Asia Pacific Cut-Resistant Gloves Volume (K), by Country 2025 & 2033
- Figure 61: Asia Pacific Cut-Resistant Gloves Revenue Share (%), by Country 2025 & 2033
- Figure 62: Asia Pacific Cut-Resistant Gloves Volume Share (%), by Country 2025 & 2033
List of Tables
- Table 1: Global Cut-Resistant Gloves Revenue billion Forecast, by Application 2020 & 2033
- Table 2: Global Cut-Resistant Gloves Volume K Forecast, by Application 2020 & 2033
- Table 3: Global Cut-Resistant Gloves Revenue billion Forecast, by Types 2020 & 2033
- Table 4: Global Cut-Resistant Gloves Volume K Forecast, by Types 2020 & 2033
- Table 5: Global Cut-Resistant Gloves Revenue billion Forecast, by Region 2020 & 2033
- Table 6: Global Cut-Resistant Gloves Volume K Forecast, by Region 2020 & 2033
- Table 7: Global Cut-Resistant Gloves Revenue billion Forecast, by Application 2020 & 2033
- Table 8: Global Cut-Resistant Gloves Volume K Forecast, by Application 2020 & 2033
- Table 9: Global Cut-Resistant Gloves Revenue billion Forecast, by Types 2020 & 2033
- Table 10: Global Cut-Resistant Gloves Volume K Forecast, by Types 2020 & 2033
- Table 11: Global Cut-Resistant Gloves Revenue billion Forecast, by Country 2020 & 2033
- Table 12: Global Cut-Resistant Gloves Volume K Forecast, by Country 2020 & 2033
- Table 13: United States Cut-Resistant Gloves Revenue (billion) Forecast, by Application 2020 & 2033
- Table 14: United States Cut-Resistant Gloves Volume (K) Forecast, by Application 2020 & 2033
- Table 15: Canada Cut-Resistant Gloves Revenue (billion) Forecast, by Application 2020 & 2033
- Table 16: Canada Cut-Resistant Gloves Volume (K) Forecast, by Application 2020 & 2033
- Table 17: Mexico Cut-Resistant Gloves Revenue (billion) Forecast, by Application 2020 & 2033
- Table 18: Mexico Cut-Resistant Gloves Volume (K) Forecast, by Application 2020 & 2033
- Table 19: Global Cut-Resistant Gloves Revenue billion Forecast, by Application 2020 & 2033
- Table 20: Global Cut-Resistant Gloves Volume K Forecast, by Application 2020 & 2033
- Table 21: Global Cut-Resistant Gloves Revenue billion Forecast, by Types 2020 & 2033
- Table 22: Global Cut-Resistant Gloves Volume K Forecast, by Types 2020 & 2033
- Table 23: Global Cut-Resistant Gloves Revenue billion Forecast, by Country 2020 & 2033
- Table 24: Global Cut-Resistant Gloves Volume K Forecast, by Country 2020 & 2033
- Table 25: Brazil Cut-Resistant Gloves Revenue (billion) Forecast, by Application 2020 & 2033
- Table 26: Brazil Cut-Resistant Gloves Volume (K) Forecast, by Application 2020 & 2033
- Table 27: Argentina Cut-Resistant Gloves Revenue (billion) Forecast, by Application 2020 & 2033
- Table 28: Argentina Cut-Resistant Gloves Volume (K) Forecast, by Application 2020 & 2033
- Table 29: Rest of South America Cut-Resistant Gloves Revenue (billion) Forecast, by Application 2020 & 2033
- Table 30: Rest of South America Cut-Resistant Gloves Volume (K) Forecast, by Application 2020 & 2033
- Table 31: Global Cut-Resistant Gloves Revenue billion Forecast, by Application 2020 & 2033
- Table 32: Global Cut-Resistant Gloves Volume K Forecast, by Application 2020 & 2033
- Table 33: Global Cut-Resistant Gloves Revenue billion Forecast, by Types 2020 & 2033
- Table 34: Global Cut-Resistant Gloves Volume K Forecast, by Types 2020 & 2033
- Table 35: Global Cut-Resistant Gloves Revenue billion Forecast, by Country 2020 & 2033
- Table 36: Global Cut-Resistant Gloves Volume K Forecast, by Country 2020 & 2033
- Table 37: United Kingdom Cut-Resistant Gloves Revenue (billion) Forecast, by Application 2020 & 2033
- Table 38: United Kingdom Cut-Resistant Gloves Volume (K) Forecast, by Application 2020 & 2033
- Table 39: Germany Cut-Resistant Gloves Revenue (billion) Forecast, by Application 2020 & 2033
- Table 40: Germany Cut-Resistant Gloves Volume (K) Forecast, by Application 2020 & 2033
- Table 41: France Cut-Resistant Gloves Revenue (billion) Forecast, by Application 2020 & 2033
- Table 42: France Cut-Resistant Gloves Volume (K) Forecast, by Application 2020 & 2033
- Table 43: Italy Cut-Resistant Gloves Revenue (billion) Forecast, by Application 2020 & 2033
- Table 44: Italy Cut-Resistant Gloves Volume (K) Forecast, by Application 2020 & 2033
- Table 45: Spain Cut-Resistant Gloves Revenue (billion) Forecast, by Application 2020 & 2033
- Table 46: Spain Cut-Resistant Gloves Volume (K) Forecast, by Application 2020 & 2033
- Table 47: Russia Cut-Resistant Gloves Revenue (billion) Forecast, by Application 2020 & 2033
- Table 48: Russia Cut-Resistant Gloves Volume (K) Forecast, by Application 2020 & 2033
- Table 49: Benelux Cut-Resistant Gloves Revenue (billion) Forecast, by Application 2020 & 2033
- Table 50: Benelux Cut-Resistant Gloves Volume (K) Forecast, by Application 2020 & 2033
- Table 51: Nordics Cut-Resistant Gloves Revenue (billion) Forecast, by Application 2020 & 2033
- Table 52: Nordics Cut-Resistant Gloves Volume (K) Forecast, by Application 2020 & 2033
- Table 53: Rest of Europe Cut-Resistant Gloves Revenue (billion) Forecast, by Application 2020 & 2033
- Table 54: Rest of Europe Cut-Resistant Gloves Volume (K) Forecast, by Application 2020 & 2033
- Table 55: Global Cut-Resistant Gloves Revenue billion Forecast, by Application 2020 & 2033
- Table 56: Global Cut-Resistant Gloves Volume K Forecast, by Application 2020 & 2033
- Table 57: Global Cut-Resistant Gloves Revenue billion Forecast, by Types 2020 & 2033
- Table 58: Global Cut-Resistant Gloves Volume K Forecast, by Types 2020 & 2033
- Table 59: Global Cut-Resistant Gloves Revenue billion Forecast, by Country 2020 & 2033
- Table 60: Global Cut-Resistant Gloves Volume K Forecast, by Country 2020 & 2033
- Table 61: Turkey Cut-Resistant Gloves Revenue (billion) Forecast, by Application 2020 & 2033
- Table 62: Turkey Cut-Resistant Gloves Volume (K) Forecast, by Application 2020 & 2033
- Table 63: Israel Cut-Resistant Gloves Revenue (billion) Forecast, by Application 2020 & 2033
- Table 64: Israel Cut-Resistant Gloves Volume (K) Forecast, by Application 2020 & 2033
- Table 65: GCC Cut-Resistant Gloves Revenue (billion) Forecast, by Application 2020 & 2033
- Table 66: GCC Cut-Resistant Gloves Volume (K) Forecast, by Application 2020 & 2033
- Table 67: North Africa Cut-Resistant Gloves Revenue (billion) Forecast, by Application 2020 & 2033
- Table 68: North Africa Cut-Resistant Gloves Volume (K) Forecast, by Application 2020 & 2033
- Table 69: South Africa Cut-Resistant Gloves Revenue (billion) Forecast, by Application 2020 & 2033
- Table 70: South Africa Cut-Resistant Gloves Volume (K) Forecast, by Application 2020 & 2033
- Table 71: Rest of Middle East & Africa Cut-Resistant Gloves Revenue (billion) Forecast, by Application 2020 & 2033
- Table 72: Rest of Middle East & Africa Cut-Resistant Gloves Volume (K) Forecast, by Application 2020 & 2033
- Table 73: Global Cut-Resistant Gloves Revenue billion Forecast, by Application 2020 & 2033
- Table 74: Global Cut-Resistant Gloves Volume K Forecast, by Application 2020 & 2033
- Table 75: Global Cut-Resistant Gloves Revenue billion Forecast, by Types 2020 & 2033
- Table 76: Global Cut-Resistant Gloves Volume K Forecast, by Types 2020 & 2033
- Table 77: Global Cut-Resistant Gloves Revenue billion Forecast, by Country 2020 & 2033
- Table 78: Global Cut-Resistant Gloves Volume K Forecast, by Country 2020 & 2033
- Table 79: China Cut-Resistant Gloves Revenue (billion) Forecast, by Application 2020 & 2033
- Table 80: China Cut-Resistant Gloves Volume (K) Forecast, by Application 2020 & 2033
- Table 81: India Cut-Resistant Gloves Revenue (billion) Forecast, by Application 2020 & 2033
- Table 82: India Cut-Resistant Gloves Volume (K) Forecast, by Application 2020 & 2033
- Table 83: Japan Cut-Resistant Gloves Revenue (billion) Forecast, by Application 2020 & 2033
- Table 84: Japan Cut-Resistant Gloves Volume (K) Forecast, by Application 2020 & 2033
- Table 85: South Korea Cut-Resistant Gloves Revenue (billion) Forecast, by Application 2020 & 2033
- Table 86: South Korea Cut-Resistant Gloves Volume (K) Forecast, by Application 2020 & 2033
- Table 87: ASEAN Cut-Resistant Gloves Revenue (billion) Forecast, by Application 2020 & 2033
- Table 88: ASEAN Cut-Resistant Gloves Volume (K) Forecast, by Application 2020 & 2033
- Table 89: Oceania Cut-Resistant Gloves Revenue (billion) Forecast, by Application 2020 & 2033
- Table 90: Oceania Cut-Resistant Gloves Volume (K) Forecast, by Application 2020 & 2033
- Table 91: Rest of Asia Pacific Cut-Resistant Gloves Revenue (billion) Forecast, by Application 2020 & 2033
- Table 92: Rest of Asia Pacific Cut-Resistant Gloves Volume (K) Forecast, by Application 2020 & 2033
Frequently Asked Questions
1. What is the projected Compound Annual Growth Rate (CAGR) of the Cut-Resistant Gloves?
The projected CAGR is approximately 11.41%.
2. Which companies are prominent players in the Cut-Resistant Gloves?
Key companies in the market include NoCry, DEXFIT, Stark, G & F, Dowellife, Seibertron, Superior Glove, Youngstown, Maxiflex, Mechanix Wear.
3. What are the main segments of the Cut-Resistant Gloves?
The market segments include Application, Types.
4. Can you provide details about the market size?
The market size is estimated to be USD 12.248 billion as of 2022.
5. What are some drivers contributing to market growth?
N/A
6. What are the notable trends driving market growth?
N/A
7. Are there any restraints impacting market growth?
N/A
8. Can you provide examples of recent developments in the market?
N/A
9. What pricing options are available for accessing the report?
Pricing options include single-user, multi-user, and enterprise licenses priced at USD 3350.00, USD 5025.00, and USD 6700.00 respectively.
10. Is the market size provided in terms of value or volume?
The market size is provided in terms of value, measured in billion and volume, measured in K.
11. Are there any specific market keywords associated with the report?
Yes, the market keyword associated with the report is "Cut-Resistant Gloves," which aids in identifying and referencing the specific market segment covered.
12. How do I determine which pricing option suits my needs best?
The pricing options vary based on user requirements and access needs. Individual users may opt for single-user licenses, while businesses requiring broader access may choose multi-user or enterprise licenses for cost-effective access to the report.
13. Are there any additional resources or data provided in the Cut-Resistant Gloves report?
While the report offers comprehensive insights, it's advisable to review the specific contents or supplementary materials provided to ascertain if additional resources or data are available.
14. How can I stay updated on further developments or reports in the Cut-Resistant Gloves?
To stay informed about further developments, trends, and reports in the Cut-Resistant Gloves, consider subscribing to industry newsletters, following relevant companies and organizations, or regularly checking reputable industry news sources and publications.
Methodology
Step 1 - Identification of Relevant Samples Size from Population Database


Step 2 - Approaches for Defining Global Market Size (Value, Volume* & Price*)

Note*: In applicable scenarios
Step 3 - Data Sources
Primary Research
- Web Analytics
- Survey Reports
- Research Institute
- Latest Research Reports
- Opinion Leaders
Secondary Research
- Annual Reports
- White Paper
- Latest Press Release
- Industry Association
- Paid Database
- Investor Presentations

Step 4 - Data Triangulation
Involves using different sources of information in order to increase the validity of a study
These sources are likely to be stakeholders in a program - participants, other researchers, program staff, other community members, and so on.
Then we put all data in single framework & apply various statistical tools to find out the dynamic on the market.
During the analysis stage, feedback from the stakeholder groups would be compared to determine areas of agreement as well as areas of divergence