

Key Insights
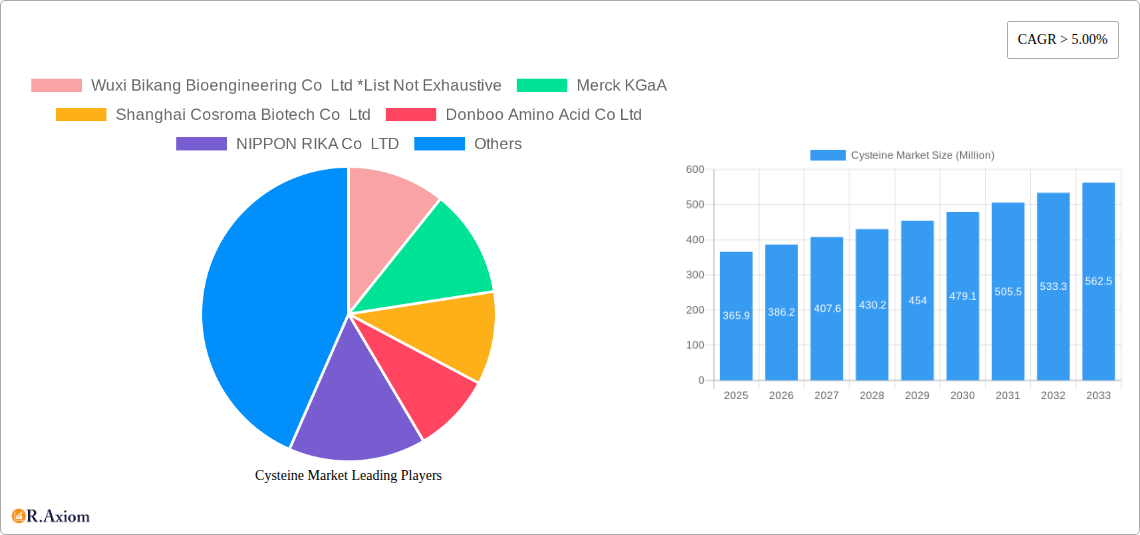
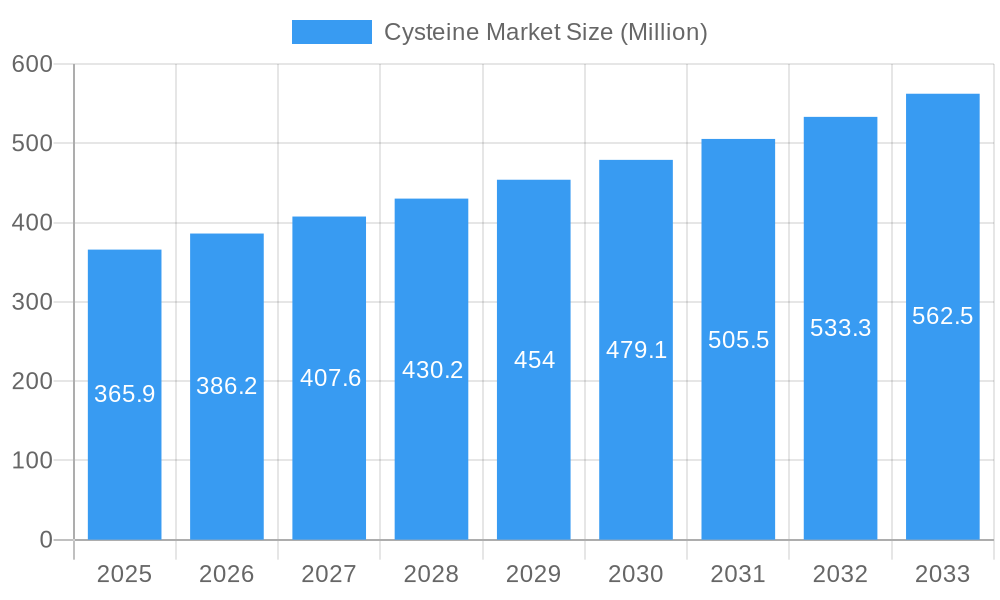
The global cysteine market, valued at $365.9 million in 2025, is projected to experience robust growth, exhibiting a Compound Annual Growth Rate (CAGR) exceeding 5% from 2025 to 2033. This expansion is driven by increasing demand across diverse sectors, primarily fueled by the pharmaceutical industry's reliance on cysteine for the production of human insulin and other crucial medications. The growing awareness of the benefits of cysteine as an anti-aging agent and its applications in animal feed are also contributing significantly to market growth. Furthermore, the rise in the consumption of processed foods and the increasing demand for food additives, especially flavor enhancers, are bolstering market expansion. The market's segmentation by production process (natural vs. synthetic) and application highlights the diverse avenues for cysteine utilization. Synthetic cysteine, due to its cost-effectiveness and scalability, is likely to hold a larger market share compared to natural cysteine. However, the increasing preference for natural ingredients in food and pharmaceuticals may drive growth in the natural cysteine segment. Geographical analysis indicates a significant market presence in the Asia-Pacific region, particularly in China and India, driven by robust pharmaceutical and food industries. North America and Europe are also expected to contribute substantially, owing to the strong presence of established pharmaceutical companies and increasing awareness of health and wellness. While challenges such as fluctuating raw material prices and stringent regulatory requirements may pose some constraints, the overall market outlook remains positive, driven by the diverse applications and growing demand for cysteine across various end-user industries.
Cysteine Market Market Size (In Million)
The competitive landscape includes both established multinational corporations like Merck KGaA and Ajinomoto Co Inc, and regional players such as Wuxi Bikang Bioengineering Co Ltd and Shanghai Cosroma Biotech Co Ltd. The presence of both large and small players indicates a competitive yet dynamic market. The continued innovation in production processes and the exploration of novel applications for cysteine will further shape the market landscape in the coming years. Strategic partnerships, mergers and acquisitions, and the introduction of new, cost-effective production technologies are likely to become increasingly important for companies seeking to gain a competitive edge in this growing market. The focus on sustainability and the development of eco-friendly production methods will also become a significant factor influencing market growth and shaping future competitive dynamics.
Cysteine Market Company Market Share
Cysteine Market: A Comprehensive Report (2019-2033)
This comprehensive report provides an in-depth analysis of the global cysteine market, encompassing historical data (2019-2024), the base year (2025), and a detailed forecast (2025-2033). The study meticulously examines market segmentation, competitive landscape, growth drivers, challenges, and emerging opportunities, offering actionable insights for industry stakeholders. The report utilizes a robust methodology incorporating primary and secondary research, ensuring accuracy and reliability of the presented data. The total market size is projected to reach xx Million by 2033, exhibiting a CAGR of xx% during the forecast period.
Cysteine Market Concentration & Innovation
The cysteine market exhibits a moderately concentrated structure, with key players holding significant market share. While precise market share figures for individual companies remain proprietary, Merck KGaA, Ajinomoto Co. Inc., and Wacker Chemie AG are recognized as prominent players. Market concentration is influenced by factors such as economies of scale in production, intellectual property rights around novel production processes, and established distribution networks. Innovation in the cysteine market is driven by the development of more efficient and sustainable production methods, including advancements in fermentation technology and the exploration of novel applications, particularly within the pharmaceutical and cosmetic sectors.
Regulatory frameworks, varying across regions, significantly impact market dynamics. Stringent regulations concerning food additives and pharmaceutical ingredients influence production processes and quality control. Substitutes for cysteine, while limited, exist in specific applications; however, cysteine’s unique properties in areas like food flavor enhancement and pharmaceutical manufacturing often make it irreplaceable. End-user trends, such as growing demand for healthier food and personalized medicine, are driving market growth.
Mergers and acquisitions (M&A) have played a significant role in shaping the market landscape. Notable examples include the 2021 acquisition of Sigma-Aldrich by Merck KGaA, which strengthened its position in the cysteine supply chain. While specific M&A deal values aren't publicly available for all transactions, these activities underscore the competitive intensity and strategic consolidation within the market. The average deal value for M&A activities within the industry between 2019 and 2024 was estimated at xx Million.
Cysteine Market Industry Trends & Insights
The global cysteine market is experiencing robust growth, fueled by increasing demand across diverse end-user industries. Key drivers include the expansion of the food and beverage sector, particularly in developing economies, escalating demand for cysteine in pharmaceutical applications (e.g., insulin production), and the rising adoption of cysteine in animal feed formulations to enhance nutritional value. Technological advancements in fermentation and synthetic production processes are further contributing to market expansion. These improvements translate to enhanced production efficiency, reduced costs, and a decreased environmental impact.
Consumer preferences for healthier and more functional foods are also driving market growth. This trend is reflected in the increasing use of cysteine as a flavor enhancer and nutritional supplement. However, competitive dynamics are intense, with established players and emerging companies vying for market share through price competitiveness, product differentiation, and strategic partnerships. The market is expected to witness continuous innovation in production technologies, application development, and supply chain optimization. Market penetration varies significantly across applications; for instance, the pharmaceutical segment exhibits higher penetration due to the crucial role of cysteine in insulin production. The CAGR for the cysteine market during the forecast period (2025-2033) is projected to be xx%, driven primarily by the pharmaceutical and food sectors.
Dominant Markets & Segments in Cysteine Market
The Asia-Pacific region currently holds a dominant position in the global cysteine market, driven by factors such as rapid economic growth, expanding food and pharmaceutical industries, and a large population base. China, in particular, plays a pivotal role owing to its sizable manufacturing sector and significant investments in the biotechnology industry.
- Key Drivers in Asia-Pacific:
- Robust economic growth fostering industrial expansion.
- Increasing disposable income driving demand for processed foods.
- Substantial investments in biotechnology and pharmaceutical research.
- Favorable government policies supporting the growth of the food and pharmaceutical industries.
Within the cysteine market segmentation:
- By Production Process: The synthetic production process dominates the market due to its higher production capacity and cost-effectiveness compared to natural extraction methods.
- By Application: The pharmaceutical industry represents the largest application segment due to cysteine's crucial role in insulin production and other pharmaceutical applications. Food and animal feed industries are substantial segments as well.
The dominance of specific segments is further analyzed in the detailed report, providing a comprehensive understanding of market dynamics, growth potential, and future outlook.
Cysteine Market Product Developments
Recent product developments in the cysteine market center on enhanced production technologies aiming for increased efficiency, reduced costs, and minimized environmental impact. Companies are actively investing in fermentation and synthetic production processes to improve yield and purity. Furthermore, the development of novel applications for cysteine, especially in the cosmetics and nutraceutical sectors, is gaining momentum. This reflects a growing demand for naturally derived and functional ingredients, further strengthening the market position of cysteine. Companies are also concentrating on developing formulations with improved stability and bioavailability to cater to diverse applications.
Report Scope & Segmentation Analysis
This report comprehensively segments the cysteine market across various parameters:
- Production Process: Natural and Synthetic, with growth projections indicating continued dominance of the synthetic segment. The natural segment is expected to exhibit moderate growth driven by increased demand for natural ingredients.
- Application: Conditioner, Flavor Enhancer, Reducing Agent, Production of Human Insulin, Other Applications (Anti-aging Agent), each exhibiting unique growth trajectories. Insulin production remains the largest application area.
- End-user Industry: Food, Pharmaceutical, Animal Feed, Other End-user Industries (Marine). The pharmaceutical sector is anticipated to maintain its leading position, followed by the food industry. The animal feed segment is showing promising growth potential.
Each segment’s market size, growth rate, and competitive landscape are analyzed in detail within the full report.
Key Drivers of Cysteine Market Growth
Several factors are driving the growth of the cysteine market:
- Expanding Pharmaceutical Industry: The increasing demand for insulin and other cysteine-based pharmaceuticals is a key driver.
- Growth in Food and Beverage Sector: The use of cysteine as a flavor enhancer and nutritional supplement is fueling market growth.
- Technological Advancements: Improved production methods, including fermentation, are increasing efficiency and reducing costs.
- Rising Demand for Animal Feed Additives: Cysteine's role in enhancing the nutritional value of animal feed is creating opportunities.
Challenges in the Cysteine Market Sector
The cysteine market faces several challenges:
- Price Volatility of Raw Materials: Fluctuations in the prices of raw materials used in cysteine production can impact profitability.
- Stringent Regulatory Compliance: Meeting stringent regulatory requirements for food and pharmaceutical applications can be costly.
- Intense Competition: The presence of numerous players, including both large established companies and smaller specialty chemical manufacturers creates a competitive environment. The impact of this is a compression of profit margins.
Emerging Opportunities in Cysteine Market
The cysteine market presents several emerging opportunities:
- Development of Novel Applications: Exploring new applications in cosmetics, nutraceuticals, and other sectors can unlock further growth.
- Focus on Sustainable Production: Adopting environmentally friendly and sustainable production methods can attract environmentally conscious consumers and manufacturers.
- Expansion into New Geographies: Targeting emerging markets with high growth potential can significantly boost revenue.
Leading Players in the Cysteine Market
- Wuxi Bikang Bioengineering Co Ltd
- Merck KGaA
- Shanghai Cosroma Biotech Co Ltd
- Donboo Amino Acid Co Ltd
- NIPPON RIKA Co LTD
- Ajinomoto Co Inc
- Wuhan Grand Hoyo Co Ltd
- Shine Star (Hubei) Biological Engineering Co Ltd
- Wacker Chemie AG
- CJ CHEILJEDANG CORP
Key Developments in Cysteine Market Industry
- 2022: Wacker Chemie AG announces plans to expand its cysteine production capacity in China.
- 2021: Merck KGaA acquires Sigma-Aldrich, strengthening its market position.
- 2020: Ajinomoto Co. Inc. develops a new fermentation process for cysteine production, enhancing efficiency and reducing environmental impact.
Strategic Outlook for Cysteine Market
The cysteine market is poised for continued growth driven by technological advancements, expanding end-user industries, and increasing demand for functional ingredients. Opportunities exist in developing sustainable production methods, exploring new applications, and expanding into emerging markets. Companies focusing on innovation, efficient production, and strategic partnerships will be best positioned to capture significant market share in the years to come.
Cysteine Market Segmentation
-
1. Production Process
- 1.1. Natural
- 1.2. Synthetic
-
2. Application
- 2.1. Conditioner
- 2.2. Flavor Enhancer
- 2.3. Reducing Agent
- 2.4. Production of Human Insulin
- 2.5. Other Applications (Anti-aging Agent)
-
3. End-user Industry
- 3.1. Food
- 3.2. Pharmaceutical
- 3.3. Animal Feed
- 3.4. Other End-user Industries (Marine)
Cysteine Market Segmentation By Geography
-
1. Asia Pacific
- 1.1. China
- 1.2. India
- 1.3. Japan
- 1.4. South Korea
- 1.5. ASEAN Countries
- 1.6. Rest of Asia Pacific
-
2. North America
- 2.1. United States
- 2.2. Canada
- 2.3. Mexico
-
3. Europe
- 3.1. Germany
- 3.2. United Kingdom
- 3.3. France
- 3.4. Italy
- 3.5. Russia
- 3.6. Nordic Countries
- 3.7. Rest of Europe
-
4. South America
- 4.1. Brazil
- 4.2. Argentina
- 4.3. Rest of South America
-
5. Middle East and Africa
- 5.1. GCC Countries
- 5.2. South Africa
- 5.3. Rest of Middle East and Africa
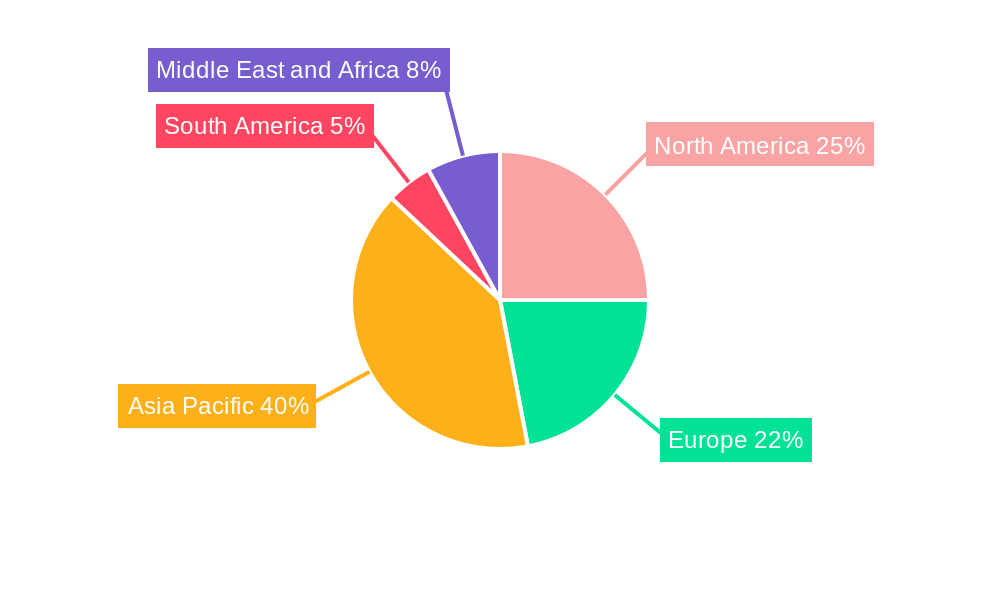
Cysteine Market Regional Market Share
Geographic Coverage of Cysteine Market
Cysteine Market REPORT HIGHLIGHTS
| Aspects | Details |
|---|---|
| Study Period | 2020-2034 |
| Base Year | 2025 |
| Estimated Year | 2026 |
| Forecast Period | 2026-2034 |
| Historical Period | 2020-2025 |
| Growth Rate | CAGR of > 5.00% from 2020-2034 |
| Segmentation |
|
Table of Contents
- 1. Introduction
- 1.1. Research Scope
- 1.2. Market Segmentation
- 1.3. Research Objective
- 1.4. Definitions and Assumptions
- 2. Executive Summary
- 2.1. Market Snapshot
- 3. Market Dynamics
- 3.1. Market Drivers
- 3.2. Market Restrains
- 3.3. Market Trends
- 3.4. Market Opportunities
- 4. Market Factor Analysis
- 4.1. Porters Five Forces
- 4.1.1. Bargaining Power of Suppliers
- 4.1.2. Bargaining Power of Buyers
- 4.1.3. Threat of New Entrants
- 4.1.4. Threat of Substitutes
- 4.1.5. Competitive Rivalry
- 4.2. PESTEL analysis
- 4.3. BCG Analysis
- 4.3.1. Stars (High Growth, High Market Share)
- 4.3.2. Cash Cows (Low Growth, High Market Share)
- 4.3.3. Question Mark (High Growth, Low Market Share)
- 4.3.4. Dogs (Low Growth, Low Market Share)
- 4.4. Ansoff Matrix Analysis
- 4.5. Supply Chain Analysis
- 4.6. Regulatory Landscape
- 4.7. Current Market Potential and Opportunity Assessment (TAM–SAM–SOM Framework)
- 4.8. RAX Analyst Note
- 4.1. Porters Five Forces
- 5. Market Analysis, Insights and Forecast 2021-2033
- 5.1. Market Analysis, Insights and Forecast - by Production Process
- 5.1.1. Natural
- 5.1.2. Synthetic
- 5.2. Market Analysis, Insights and Forecast - by Application
- 5.2.1. Conditioner
- 5.2.2. Flavor Enhancer
- 5.2.3. Reducing Agent
- 5.2.4. Production of Human Insulin
- 5.2.5. Other Applications (Anti-aging Agent)
- 5.3. Market Analysis, Insights and Forecast - by End-user Industry
- 5.3.1. Food
- 5.3.2. Pharmaceutical
- 5.3.3. Animal Feed
- 5.3.4. Other End-user Industries (Marine)
- 5.4. Market Analysis, Insights and Forecast - by Region
- 5.4.1. Asia Pacific
- 5.4.2. North America
- 5.4.3. Europe
- 5.4.4. South America
- 5.4.5. Middle East and Africa
- 5.1. Market Analysis, Insights and Forecast - by Production Process
- 6. Global Cysteine Market Analysis, Insights and Forecast, 2021-2033
- 6.1. Market Analysis, Insights and Forecast - by Production Process
- 6.1.1. Natural
- 6.1.2. Synthetic
- 6.2. Market Analysis, Insights and Forecast - by Application
- 6.2.1. Conditioner
- 6.2.2. Flavor Enhancer
- 6.2.3. Reducing Agent
- 6.2.4. Production of Human Insulin
- 6.2.5. Other Applications (Anti-aging Agent)
- 6.3. Market Analysis, Insights and Forecast - by End-user Industry
- 6.3.1. Food
- 6.3.2. Pharmaceutical
- 6.3.3. Animal Feed
- 6.3.4. Other End-user Industries (Marine)
- 6.1. Market Analysis, Insights and Forecast - by Production Process
- 7. Asia Pacific Cysteine Market Analysis, Insights and Forecast, 2020-2032
- 7.1. Market Analysis, Insights and Forecast - by Production Process
- 7.1.1. Natural
- 7.1.2. Synthetic
- 7.2. Market Analysis, Insights and Forecast - by Application
- 7.2.1. Conditioner
- 7.2.2. Flavor Enhancer
- 7.2.3. Reducing Agent
- 7.2.4. Production of Human Insulin
- 7.2.5. Other Applications (Anti-aging Agent)
- 7.3. Market Analysis, Insights and Forecast - by End-user Industry
- 7.3.1. Food
- 7.3.2. Pharmaceutical
- 7.3.3. Animal Feed
- 7.3.4. Other End-user Industries (Marine)
- 7.1. Market Analysis, Insights and Forecast - by Production Process
- 8. North America Cysteine Market Analysis, Insights and Forecast, 2020-2032
- 8.1. Market Analysis, Insights and Forecast - by Production Process
- 8.1.1. Natural
- 8.1.2. Synthetic
- 8.2. Market Analysis, Insights and Forecast - by Application
- 8.2.1. Conditioner
- 8.2.2. Flavor Enhancer
- 8.2.3. Reducing Agent
- 8.2.4. Production of Human Insulin
- 8.2.5. Other Applications (Anti-aging Agent)
- 8.3. Market Analysis, Insights and Forecast - by End-user Industry
- 8.3.1. Food
- 8.3.2. Pharmaceutical
- 8.3.3. Animal Feed
- 8.3.4. Other End-user Industries (Marine)
- 8.1. Market Analysis, Insights and Forecast - by Production Process
- 9. Europe Cysteine Market Analysis, Insights and Forecast, 2020-2032
- 9.1. Market Analysis, Insights and Forecast - by Production Process
- 9.1.1. Natural
- 9.1.2. Synthetic
- 9.2. Market Analysis, Insights and Forecast - by Application
- 9.2.1. Conditioner
- 9.2.2. Flavor Enhancer
- 9.2.3. Reducing Agent
- 9.2.4. Production of Human Insulin
- 9.2.5. Other Applications (Anti-aging Agent)
- 9.3. Market Analysis, Insights and Forecast - by End-user Industry
- 9.3.1. Food
- 9.3.2. Pharmaceutical
- 9.3.3. Animal Feed
- 9.3.4. Other End-user Industries (Marine)
- 9.1. Market Analysis, Insights and Forecast - by Production Process
- 10. South America Cysteine Market Analysis, Insights and Forecast, 2020-2032
- 10.1. Market Analysis, Insights and Forecast - by Production Process
- 10.1.1. Natural
- 10.1.2. Synthetic
- 10.2. Market Analysis, Insights and Forecast - by Application
- 10.2.1. Conditioner
- 10.2.2. Flavor Enhancer
- 10.2.3. Reducing Agent
- 10.2.4. Production of Human Insulin
- 10.2.5. Other Applications (Anti-aging Agent)
- 10.3. Market Analysis, Insights and Forecast - by End-user Industry
- 10.3.1. Food
- 10.3.2. Pharmaceutical
- 10.3.3. Animal Feed
- 10.3.4. Other End-user Industries (Marine)
- 10.1. Market Analysis, Insights and Forecast - by Production Process
- 11. Middle East and Africa Cysteine Market Analysis, Insights and Forecast, 2020-2032
- 11.1. Market Analysis, Insights and Forecast - by Production Process
- 11.1.1. Natural
- 11.1.2. Synthetic
- 11.2. Market Analysis, Insights and Forecast - by Application
- 11.2.1. Conditioner
- 11.2.2. Flavor Enhancer
- 11.2.3. Reducing Agent
- 11.2.4. Production of Human Insulin
- 11.2.5. Other Applications (Anti-aging Agent)
- 11.3. Market Analysis, Insights and Forecast - by End-user Industry
- 11.3.1. Food
- 11.3.2. Pharmaceutical
- 11.3.3. Animal Feed
- 11.3.4. Other End-user Industries (Marine)
- 11.1. Market Analysis, Insights and Forecast - by Production Process
- 12. Competitive Analysis
- 12.1. Company Profiles
- 12.1.1 Wuxi Bikang Bioengineering Co Ltd *List Not Exhaustive
- 12.1.1.1. Company Overview
- 12.1.1.2. Products
- 12.1.1.3. Company Financials
- 12.1.1.4. SWOT Analysis
- 12.1.2 Merck KGaA
- 12.1.2.1. Company Overview
- 12.1.2.2. Products
- 12.1.2.3. Company Financials
- 12.1.2.4. SWOT Analysis
- 12.1.3 Shanghai Cosroma Biotech Co Ltd
- 12.1.3.1. Company Overview
- 12.1.3.2. Products
- 12.1.3.3. Company Financials
- 12.1.3.4. SWOT Analysis
- 12.1.4 Donboo Amino Acid Co Ltd
- 12.1.4.1. Company Overview
- 12.1.4.2. Products
- 12.1.4.3. Company Financials
- 12.1.4.4. SWOT Analysis
- 12.1.5 NIPPON RIKA Co LTD
- 12.1.5.1. Company Overview
- 12.1.5.2. Products
- 12.1.5.3. Company Financials
- 12.1.5.4. SWOT Analysis
- 12.1.6 Ajinomoto Co Inc
- 12.1.6.1. Company Overview
- 12.1.6.2. Products
- 12.1.6.3. Company Financials
- 12.1.6.4. SWOT Analysis
- 12.1.7 Wuhan Grand Hoyo Co Ltd
- 12.1.7.1. Company Overview
- 12.1.7.2. Products
- 12.1.7.3. Company Financials
- 12.1.7.4. SWOT Analysis
- 12.1.8 Shine Star (Hubei) Biological Engineering Co Ltd
- 12.1.8.1. Company Overview
- 12.1.8.2. Products
- 12.1.8.3. Company Financials
- 12.1.8.4. SWOT Analysis
- 12.1.9 Wacker Chemie AG
- 12.1.9.1. Company Overview
- 12.1.9.2. Products
- 12.1.9.3. Company Financials
- 12.1.9.4. SWOT Analysis
- 12.1.10 CJ CHEILJEDANG CORP
- 12.1.10.1. Company Overview
- 12.1.10.2. Products
- 12.1.10.3. Company Financials
- 12.1.10.4. SWOT Analysis
- 12.1.1 Wuxi Bikang Bioengineering Co Ltd *List Not Exhaustive
- 12.2. Market Entropy
- 12.2.1 Company's Key Areas Served
- 12.2.2 Recent Developments
- 12.3. Company Market Share Analysis 2025
- 12.3.1 Top 5 Companies Market Share Analysis
- 12.3.2 Top 3 Companies Market Share Analysis
- 12.4. List of Potential Customers
- 13. Research Methodology
List of Figures
- Figure 1: Global Cysteine Market Revenue Breakdown (Million, %) by Region 2025 & 2033
- Figure 2: Global Cysteine Market Volume Breakdown (kilotons, %) by Region 2025 & 2033
- Figure 3: Asia Pacific Cysteine Market Revenue (Million), by Production Process 2025 & 2033
- Figure 4: Asia Pacific Cysteine Market Volume (kilotons), by Production Process 2025 & 2033
- Figure 5: Asia Pacific Cysteine Market Revenue Share (%), by Production Process 2025 & 2033
- Figure 6: Asia Pacific Cysteine Market Volume Share (%), by Production Process 2025 & 2033
- Figure 7: Asia Pacific Cysteine Market Revenue (Million), by Application 2025 & 2033
- Figure 8: Asia Pacific Cysteine Market Volume (kilotons), by Application 2025 & 2033
- Figure 9: Asia Pacific Cysteine Market Revenue Share (%), by Application 2025 & 2033
- Figure 10: Asia Pacific Cysteine Market Volume Share (%), by Application 2025 & 2033
- Figure 11: Asia Pacific Cysteine Market Revenue (Million), by End-user Industry 2025 & 2033
- Figure 12: Asia Pacific Cysteine Market Volume (kilotons), by End-user Industry 2025 & 2033
- Figure 13: Asia Pacific Cysteine Market Revenue Share (%), by End-user Industry 2025 & 2033
- Figure 14: Asia Pacific Cysteine Market Volume Share (%), by End-user Industry 2025 & 2033
- Figure 15: Asia Pacific Cysteine Market Revenue (Million), by Country 2025 & 2033
- Figure 16: Asia Pacific Cysteine Market Volume (kilotons), by Country 2025 & 2033
- Figure 17: Asia Pacific Cysteine Market Revenue Share (%), by Country 2025 & 2033
- Figure 18: Asia Pacific Cysteine Market Volume Share (%), by Country 2025 & 2033
- Figure 19: North America Cysteine Market Revenue (Million), by Production Process 2025 & 2033
- Figure 20: North America Cysteine Market Volume (kilotons), by Production Process 2025 & 2033
- Figure 21: North America Cysteine Market Revenue Share (%), by Production Process 2025 & 2033
- Figure 22: North America Cysteine Market Volume Share (%), by Production Process 2025 & 2033
- Figure 23: North America Cysteine Market Revenue (Million), by Application 2025 & 2033
- Figure 24: North America Cysteine Market Volume (kilotons), by Application 2025 & 2033
- Figure 25: North America Cysteine Market Revenue Share (%), by Application 2025 & 2033
- Figure 26: North America Cysteine Market Volume Share (%), by Application 2025 & 2033
- Figure 27: North America Cysteine Market Revenue (Million), by End-user Industry 2025 & 2033
- Figure 28: North America Cysteine Market Volume (kilotons), by End-user Industry 2025 & 2033
- Figure 29: North America Cysteine Market Revenue Share (%), by End-user Industry 2025 & 2033
- Figure 30: North America Cysteine Market Volume Share (%), by End-user Industry 2025 & 2033
- Figure 31: North America Cysteine Market Revenue (Million), by Country 2025 & 2033
- Figure 32: North America Cysteine Market Volume (kilotons), by Country 2025 & 2033
- Figure 33: North America Cysteine Market Revenue Share (%), by Country 2025 & 2033
- Figure 34: North America Cysteine Market Volume Share (%), by Country 2025 & 2033
- Figure 35: Europe Cysteine Market Revenue (Million), by Production Process 2025 & 2033
- Figure 36: Europe Cysteine Market Volume (kilotons), by Production Process 2025 & 2033
- Figure 37: Europe Cysteine Market Revenue Share (%), by Production Process 2025 & 2033
- Figure 38: Europe Cysteine Market Volume Share (%), by Production Process 2025 & 2033
- Figure 39: Europe Cysteine Market Revenue (Million), by Application 2025 & 2033
- Figure 40: Europe Cysteine Market Volume (kilotons), by Application 2025 & 2033
- Figure 41: Europe Cysteine Market Revenue Share (%), by Application 2025 & 2033
- Figure 42: Europe Cysteine Market Volume Share (%), by Application 2025 & 2033
- Figure 43: Europe Cysteine Market Revenue (Million), by End-user Industry 2025 & 2033
- Figure 44: Europe Cysteine Market Volume (kilotons), by End-user Industry 2025 & 2033
- Figure 45: Europe Cysteine Market Revenue Share (%), by End-user Industry 2025 & 2033
- Figure 46: Europe Cysteine Market Volume Share (%), by End-user Industry 2025 & 2033
- Figure 47: Europe Cysteine Market Revenue (Million), by Country 2025 & 2033
- Figure 48: Europe Cysteine Market Volume (kilotons), by Country 2025 & 2033
- Figure 49: Europe Cysteine Market Revenue Share (%), by Country 2025 & 2033
- Figure 50: Europe Cysteine Market Volume Share (%), by Country 2025 & 2033
- Figure 51: South America Cysteine Market Revenue (Million), by Production Process 2025 & 2033
- Figure 52: South America Cysteine Market Volume (kilotons), by Production Process 2025 & 2033
- Figure 53: South America Cysteine Market Revenue Share (%), by Production Process 2025 & 2033
- Figure 54: South America Cysteine Market Volume Share (%), by Production Process 2025 & 2033
- Figure 55: South America Cysteine Market Revenue (Million), by Application 2025 & 2033
- Figure 56: South America Cysteine Market Volume (kilotons), by Application 2025 & 2033
- Figure 57: South America Cysteine Market Revenue Share (%), by Application 2025 & 2033
- Figure 58: South America Cysteine Market Volume Share (%), by Application 2025 & 2033
- Figure 59: South America Cysteine Market Revenue (Million), by End-user Industry 2025 & 2033
- Figure 60: South America Cysteine Market Volume (kilotons), by End-user Industry 2025 & 2033
- Figure 61: South America Cysteine Market Revenue Share (%), by End-user Industry 2025 & 2033
- Figure 62: South America Cysteine Market Volume Share (%), by End-user Industry 2025 & 2033
- Figure 63: South America Cysteine Market Revenue (Million), by Country 2025 & 2033
- Figure 64: South America Cysteine Market Volume (kilotons), by Country 2025 & 2033
- Figure 65: South America Cysteine Market Revenue Share (%), by Country 2025 & 2033
- Figure 66: South America Cysteine Market Volume Share (%), by Country 2025 & 2033
- Figure 67: Middle East and Africa Cysteine Market Revenue (Million), by Production Process 2025 & 2033
- Figure 68: Middle East and Africa Cysteine Market Volume (kilotons), by Production Process 2025 & 2033
- Figure 69: Middle East and Africa Cysteine Market Revenue Share (%), by Production Process 2025 & 2033
- Figure 70: Middle East and Africa Cysteine Market Volume Share (%), by Production Process 2025 & 2033
- Figure 71: Middle East and Africa Cysteine Market Revenue (Million), by Application 2025 & 2033
- Figure 72: Middle East and Africa Cysteine Market Volume (kilotons), by Application 2025 & 2033
- Figure 73: Middle East and Africa Cysteine Market Revenue Share (%), by Application 2025 & 2033
- Figure 74: Middle East and Africa Cysteine Market Volume Share (%), by Application 2025 & 2033
- Figure 75: Middle East and Africa Cysteine Market Revenue (Million), by End-user Industry 2025 & 2033
- Figure 76: Middle East and Africa Cysteine Market Volume (kilotons), by End-user Industry 2025 & 2033
- Figure 77: Middle East and Africa Cysteine Market Revenue Share (%), by End-user Industry 2025 & 2033
- Figure 78: Middle East and Africa Cysteine Market Volume Share (%), by End-user Industry 2025 & 2033
- Figure 79: Middle East and Africa Cysteine Market Revenue (Million), by Country 2025 & 2033
- Figure 80: Middle East and Africa Cysteine Market Volume (kilotons), by Country 2025 & 2033
- Figure 81: Middle East and Africa Cysteine Market Revenue Share (%), by Country 2025 & 2033
- Figure 82: Middle East and Africa Cysteine Market Volume Share (%), by Country 2025 & 2033
List of Tables
- Table 1: Global Cysteine Market Revenue Million Forecast, by Production Process 2020 & 2033
- Table 2: Global Cysteine Market Volume kilotons Forecast, by Production Process 2020 & 2033
- Table 3: Global Cysteine Market Revenue Million Forecast, by Application 2020 & 2033
- Table 4: Global Cysteine Market Volume kilotons Forecast, by Application 2020 & 2033
- Table 5: Global Cysteine Market Revenue Million Forecast, by End-user Industry 2020 & 2033
- Table 6: Global Cysteine Market Volume kilotons Forecast, by End-user Industry 2020 & 2033
- Table 7: Global Cysteine Market Revenue Million Forecast, by Region 2020 & 2033
- Table 8: Global Cysteine Market Volume kilotons Forecast, by Region 2020 & 2033
- Table 9: Global Cysteine Market Revenue Million Forecast, by Production Process 2020 & 2033
- Table 10: Global Cysteine Market Volume kilotons Forecast, by Production Process 2020 & 2033
- Table 11: Global Cysteine Market Revenue Million Forecast, by Application 2020 & 2033
- Table 12: Global Cysteine Market Volume kilotons Forecast, by Application 2020 & 2033
- Table 13: Global Cysteine Market Revenue Million Forecast, by End-user Industry 2020 & 2033
- Table 14: Global Cysteine Market Volume kilotons Forecast, by End-user Industry 2020 & 2033
- Table 15: Global Cysteine Market Revenue Million Forecast, by Country 2020 & 2033
- Table 16: Global Cysteine Market Volume kilotons Forecast, by Country 2020 & 2033
- Table 17: China Cysteine Market Revenue (Million) Forecast, by Application 2020 & 2033
- Table 18: China Cysteine Market Volume (kilotons) Forecast, by Application 2020 & 2033
- Table 19: India Cysteine Market Revenue (Million) Forecast, by Application 2020 & 2033
- Table 20: India Cysteine Market Volume (kilotons) Forecast, by Application 2020 & 2033
- Table 21: Japan Cysteine Market Revenue (Million) Forecast, by Application 2020 & 2033
- Table 22: Japan Cysteine Market Volume (kilotons) Forecast, by Application 2020 & 2033
- Table 23: South Korea Cysteine Market Revenue (Million) Forecast, by Application 2020 & 2033
- Table 24: South Korea Cysteine Market Volume (kilotons) Forecast, by Application 2020 & 2033
- Table 25: ASEAN Countries Cysteine Market Revenue (Million) Forecast, by Application 2020 & 2033
- Table 26: ASEAN Countries Cysteine Market Volume (kilotons) Forecast, by Application 2020 & 2033
- Table 27: Rest of Asia Pacific Cysteine Market Revenue (Million) Forecast, by Application 2020 & 2033
- Table 28: Rest of Asia Pacific Cysteine Market Volume (kilotons) Forecast, by Application 2020 & 2033
- Table 29: Global Cysteine Market Revenue Million Forecast, by Production Process 2020 & 2033
- Table 30: Global Cysteine Market Volume kilotons Forecast, by Production Process 2020 & 2033
- Table 31: Global Cysteine Market Revenue Million Forecast, by Application 2020 & 2033
- Table 32: Global Cysteine Market Volume kilotons Forecast, by Application 2020 & 2033
- Table 33: Global Cysteine Market Revenue Million Forecast, by End-user Industry 2020 & 2033
- Table 34: Global Cysteine Market Volume kilotons Forecast, by End-user Industry 2020 & 2033
- Table 35: Global Cysteine Market Revenue Million Forecast, by Country 2020 & 2033
- Table 36: Global Cysteine Market Volume kilotons Forecast, by Country 2020 & 2033
- Table 37: United States Cysteine Market Revenue (Million) Forecast, by Application 2020 & 2033
- Table 38: United States Cysteine Market Volume (kilotons) Forecast, by Application 2020 & 2033
- Table 39: Canada Cysteine Market Revenue (Million) Forecast, by Application 2020 & 2033
- Table 40: Canada Cysteine Market Volume (kilotons) Forecast, by Application 2020 & 2033
- Table 41: Mexico Cysteine Market Revenue (Million) Forecast, by Application 2020 & 2033
- Table 42: Mexico Cysteine Market Volume (kilotons) Forecast, by Application 2020 & 2033
- Table 43: Global Cysteine Market Revenue Million Forecast, by Production Process 2020 & 2033
- Table 44: Global Cysteine Market Volume kilotons Forecast, by Production Process 2020 & 2033
- Table 45: Global Cysteine Market Revenue Million Forecast, by Application 2020 & 2033
- Table 46: Global Cysteine Market Volume kilotons Forecast, by Application 2020 & 2033
- Table 47: Global Cysteine Market Revenue Million Forecast, by End-user Industry 2020 & 2033
- Table 48: Global Cysteine Market Volume kilotons Forecast, by End-user Industry 2020 & 2033
- Table 49: Global Cysteine Market Revenue Million Forecast, by Country 2020 & 2033
- Table 50: Global Cysteine Market Volume kilotons Forecast, by Country 2020 & 2033
- Table 51: Germany Cysteine Market Revenue (Million) Forecast, by Application 2020 & 2033
- Table 52: Germany Cysteine Market Volume (kilotons) Forecast, by Application 2020 & 2033
- Table 53: United Kingdom Cysteine Market Revenue (Million) Forecast, by Application 2020 & 2033
- Table 54: United Kingdom Cysteine Market Volume (kilotons) Forecast, by Application 2020 & 2033
- Table 55: France Cysteine Market Revenue (Million) Forecast, by Application 2020 & 2033
- Table 56: France Cysteine Market Volume (kilotons) Forecast, by Application 2020 & 2033
- Table 57: Italy Cysteine Market Revenue (Million) Forecast, by Application 2020 & 2033
- Table 58: Italy Cysteine Market Volume (kilotons) Forecast, by Application 2020 & 2033
- Table 59: Russia Cysteine Market Revenue (Million) Forecast, by Application 2020 & 2033
- Table 60: Russia Cysteine Market Volume (kilotons) Forecast, by Application 2020 & 2033
- Table 61: Nordic Countries Cysteine Market Revenue (Million) Forecast, by Application 2020 & 2033
- Table 62: Nordic Countries Cysteine Market Volume (kilotons) Forecast, by Application 2020 & 2033
- Table 63: Rest of Europe Cysteine Market Revenue (Million) Forecast, by Application 2020 & 2033
- Table 64: Rest of Europe Cysteine Market Volume (kilotons) Forecast, by Application 2020 & 2033
- Table 65: Global Cysteine Market Revenue Million Forecast, by Production Process 2020 & 2033
- Table 66: Global Cysteine Market Volume kilotons Forecast, by Production Process 2020 & 2033
- Table 67: Global Cysteine Market Revenue Million Forecast, by Application 2020 & 2033
- Table 68: Global Cysteine Market Volume kilotons Forecast, by Application 2020 & 2033
- Table 69: Global Cysteine Market Revenue Million Forecast, by End-user Industry 2020 & 2033
- Table 70: Global Cysteine Market Volume kilotons Forecast, by End-user Industry 2020 & 2033
- Table 71: Global Cysteine Market Revenue Million Forecast, by Country 2020 & 2033
- Table 72: Global Cysteine Market Volume kilotons Forecast, by Country 2020 & 2033
- Table 73: Brazil Cysteine Market Revenue (Million) Forecast, by Application 2020 & 2033
- Table 74: Brazil Cysteine Market Volume (kilotons) Forecast, by Application 2020 & 2033
- Table 75: Argentina Cysteine Market Revenue (Million) Forecast, by Application 2020 & 2033
- Table 76: Argentina Cysteine Market Volume (kilotons) Forecast, by Application 2020 & 2033
- Table 77: Rest of South America Cysteine Market Revenue (Million) Forecast, by Application 2020 & 2033
- Table 78: Rest of South America Cysteine Market Volume (kilotons) Forecast, by Application 2020 & 2033
- Table 79: Global Cysteine Market Revenue Million Forecast, by Production Process 2020 & 2033
- Table 80: Global Cysteine Market Volume kilotons Forecast, by Production Process 2020 & 2033
- Table 81: Global Cysteine Market Revenue Million Forecast, by Application 2020 & 2033
- Table 82: Global Cysteine Market Volume kilotons Forecast, by Application 2020 & 2033
- Table 83: Global Cysteine Market Revenue Million Forecast, by End-user Industry 2020 & 2033
- Table 84: Global Cysteine Market Volume kilotons Forecast, by End-user Industry 2020 & 2033
- Table 85: Global Cysteine Market Revenue Million Forecast, by Country 2020 & 2033
- Table 86: Global Cysteine Market Volume kilotons Forecast, by Country 2020 & 2033
- Table 87: GCC Countries Cysteine Market Revenue (Million) Forecast, by Application 2020 & 2033
- Table 88: GCC Countries Cysteine Market Volume (kilotons) Forecast, by Application 2020 & 2033
- Table 89: South Africa Cysteine Market Revenue (Million) Forecast, by Application 2020 & 2033
- Table 90: South Africa Cysteine Market Volume (kilotons) Forecast, by Application 2020 & 2033
- Table 91: Rest of Middle East and Africa Cysteine Market Revenue (Million) Forecast, by Application 2020 & 2033
- Table 92: Rest of Middle East and Africa Cysteine Market Volume (kilotons) Forecast, by Application 2020 & 2033
Frequently Asked Questions
1. What is the projected Compound Annual Growth Rate (CAGR) of the Cysteine Market?
The projected CAGR is approximately > 5.00%.
2. Which companies are prominent players in the Cysteine Market?
Key companies in the market include Wuxi Bikang Bioengineering Co Ltd *List Not Exhaustive, Merck KGaA, Shanghai Cosroma Biotech Co Ltd, Donboo Amino Acid Co Ltd, NIPPON RIKA Co LTD, Ajinomoto Co Inc, Wuhan Grand Hoyo Co Ltd, Shine Star (Hubei) Biological Engineering Co Ltd, Wacker Chemie AG, CJ CHEILJEDANG CORP.
3. What are the main segments of the Cysteine Market?
The market segments include Production Process, Application, End-user Industry.
4. Can you provide details about the market size?
The market size is estimated to be USD 365.9 Million as of 2022.
5. What are some drivers contributing to market growth?
Increasing Demand from the Bakery Industry; Rising Demand from Pharmaceutical Industry.
6. What are the notable trends driving market growth?
Food Industry to Dominate the Market.
7. Are there any restraints impacting market growth?
Increasing Concerns Related to Animal-sourced Cysteine; Harmful Effects of Cysteine on Human Body.
8. Can you provide examples of recent developments in the market?
2022: Wacker Chemie AG announces plans to expand its cysteine production capacity in China
9. What pricing options are available for accessing the report?
Pricing options include single-user, multi-user, and enterprise licenses priced at USD 4750, USD 5250, and USD 8750 respectively.
10. Is the market size provided in terms of value or volume?
The market size is provided in terms of value, measured in Million and volume, measured in kilotons.
11. Are there any specific market keywords associated with the report?
Yes, the market keyword associated with the report is "Cysteine Market," which aids in identifying and referencing the specific market segment covered.
12. How do I determine which pricing option suits my needs best?
The pricing options vary based on user requirements and access needs. Individual users may opt for single-user licenses, while businesses requiring broader access may choose multi-user or enterprise licenses for cost-effective access to the report.
13. Are there any additional resources or data provided in the Cysteine Market report?
While the report offers comprehensive insights, it's advisable to review the specific contents or supplementary materials provided to ascertain if additional resources or data are available.
14. How can I stay updated on further developments or reports in the Cysteine Market?
To stay informed about further developments, trends, and reports in the Cysteine Market, consider subscribing to industry newsletters, following relevant companies and organizations, or regularly checking reputable industry news sources and publications.
Methodology
Step 1 - Identification of Relevant Samples Size from Population Database


Step 2 - Approaches for Defining Global Market Size (Value, Volume* & Price*)

Note*: In applicable scenarios
Step 3 - Data Sources
Primary Research
- Web Analytics
- Survey Reports
- Research Institute
- Latest Research Reports
- Opinion Leaders
Secondary Research
- Annual Reports
- White Paper
- Latest Press Release
- Industry Association
- Paid Database
- Investor Presentations

Step 4 - Data Triangulation
Involves using different sources of information in order to increase the validity of a study
These sources are likely to be stakeholders in a program - participants, other researchers, program staff, other community members, and so on.
Then we put all data in single framework & apply various statistical tools to find out the dynamic on the market.
During the analysis stage, feedback from the stakeholder groups would be compared to determine areas of agreement as well as areas of divergence