

Key Insights
The daily disposable contact lens market is experiencing robust growth, driven by increasing consumer preference for convenience, hygiene, and improved vision correction. The market's expansion is fueled by several factors, including rising disposable incomes in emerging economies, increased awareness of eye health, and technological advancements leading to more comfortable and effective lens designs. The segment benefits from a large and growing base of contact lens wearers, particularly among younger demographics who appreciate the hassle-free nature of daily disposables. While fluctuating economic conditions and potential material cost increases could pose challenges, the overall market outlook remains positive, particularly with ongoing innovation in lens materials and technologies aimed at enhancing comfort and addressing specific vision needs like astigmatism and presbyopia. Major players like Johnson & Johnson, Bausch & Lomb, and CooperVision are constantly innovating and expanding their product portfolios to cater to this growing demand, leading to a highly competitive yet dynamic market landscape. The market is segmented by lens type (e.g., spherical, toric, multifocal), material (e.g., silicone hydrogel, hydrogel), and distribution channel (e.g., online retailers, eye care professionals). Geographic expansion, particularly in Asia-Pacific and Latin America, presents significant growth opportunities for manufacturers.
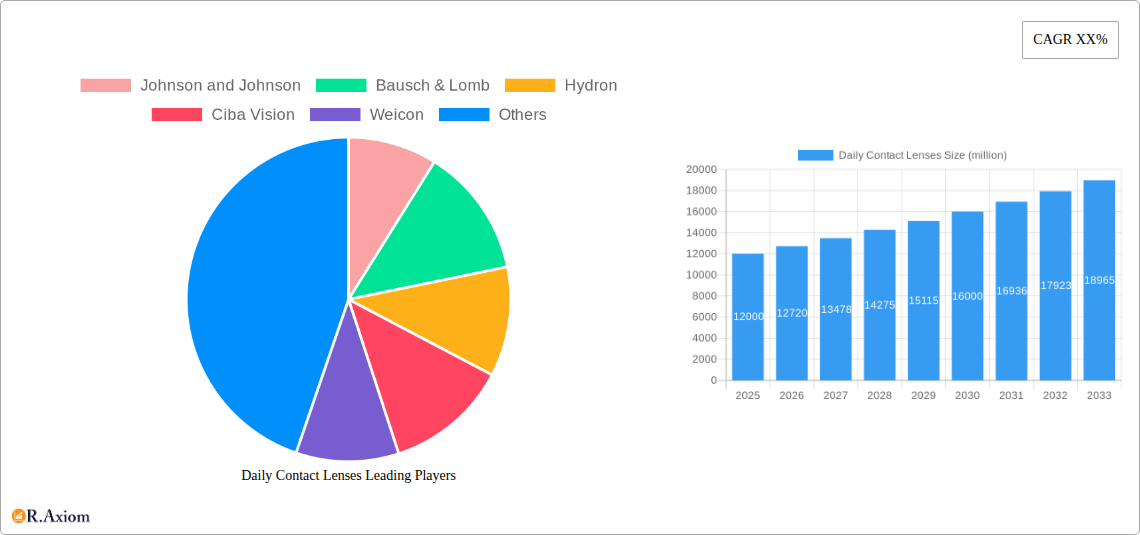
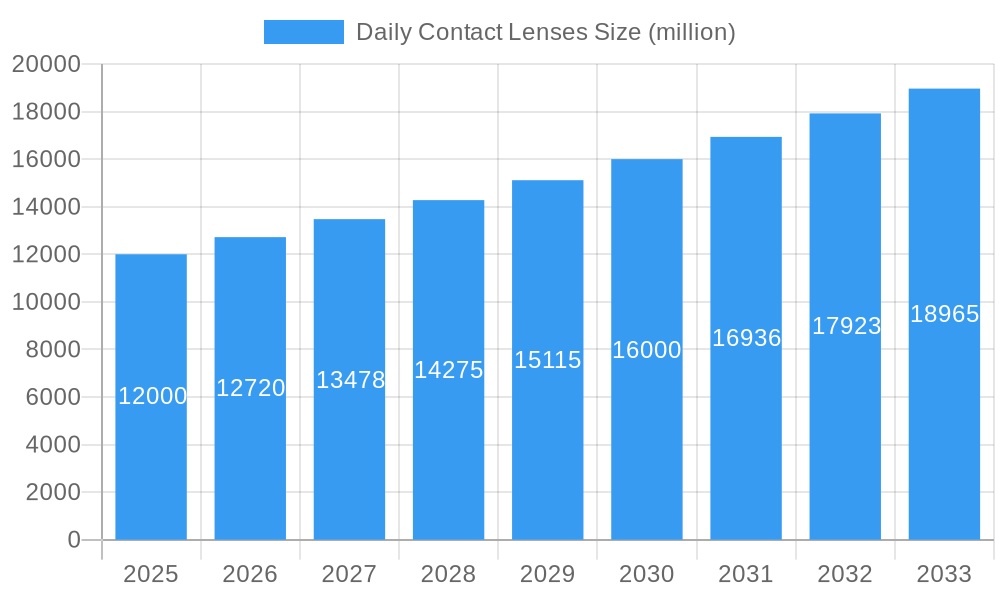
Daily Contact Lenses Market Size (In Billion)
The forecast period (2025-2033) predicts sustained expansion, fueled by continued technological advancements, increasing consumer awareness, and expanding distribution channels. Competition among key players will remain fierce, with a focus on product differentiation through enhanced comfort, improved vision correction, and innovative packaging. The market will likely see the rise of personalized lens options and potentially the integration of smart technology into contact lens design. Regulatory changes and public health initiatives concerning eye health will also play a role in shaping the market's trajectory. The historical period (2019-2024) suggests a consistently growing market, laying a solid foundation for continued expansion in the coming years. While precise figures are unavailable, a conservative estimation suggests significant market expansion.
Daily Contact Lenses Company Market Share
Daily Contact Lenses Market Report: 2019-2033
This comprehensive report provides a detailed analysis of the global daily contact lenses market, offering invaluable insights for industry stakeholders, investors, and businesses seeking to understand this dynamic sector. The report covers the period 2019-2033, with a focus on the 2025-2033 forecast period and includes detailed market sizing and segmentation. The report leverages extensive primary and secondary research to provide a comprehensive view of market trends, competitive landscape, and future growth potential. The global daily contact lenses market is projected to reach xx million by 2033, exhibiting a significant CAGR of xx% during the forecast period.
Daily Contact Lenses Market Concentration & Innovation
The daily contact lens market exhibits a moderately concentrated structure, with a few major players commanding a significant portion of the market share. Johnson & Johnson, Bausch & Lomb, and CooperVision are among the leading companies, consistently driving innovation and shaping market trends. However, smaller players and new entrants continue to emerge, contributing to a competitive and dynamic landscape.
Market Concentration: Johnson & Johnson holds an estimated xx% market share in 2025, followed by Bausch & Lomb with xx% and CooperVision with xx%. The remaining market share is distributed among other players, including Ciba Vision, Hydron, Weicon, Ocuius, Clearlab, and Neo Vision.
Innovation Drivers: Technological advancements in material science, lens design, and manufacturing processes are crucial drivers of innovation. The development of silicone hydrogel materials, offering improved oxygen permeability and comfort, has significantly impacted market growth. Furthermore, advancements in lens coatings and surface treatments enhance wearer experience.
Regulatory Framework: Stringent regulatory approvals and compliance requirements impact market dynamics. Changes in regulatory frameworks can influence product launches and market entry strategies.
Product Substitutes: Spectacles and other vision correction methods act as substitutes for daily contact lenses. However, the convenience and cosmetic advantages of daily contact lenses continue to fuel market growth.
End-User Trends: Increasing awareness of eye health and the rising preference for disposable contact lenses are key end-user trends driving market growth. The demand for comfortable, convenient, and technologically advanced lenses is significant.
M&A Activities: Mergers and acquisitions have played a vital role in shaping the competitive landscape. While precise M&A deal values for the period are not publicly available, consolidation within the industry is expected to continue, potentially leading to increased market concentration and further innovation. xx million in M&A activity is predicted for the forecast period.
Daily Contact Lenses Industry Trends & Insights
The daily contact lenses market is experiencing robust growth, fueled by several key factors. The increasing prevalence of refractive errors globally, coupled with rising disposable incomes and changing lifestyles, contributes to higher demand. The market is also witnessing a notable shift towards premium and technologically advanced lenses, driving premiumization.
The CAGR of the daily contact lenses market is projected to be xx% from 2025 to 2033. Market penetration is expected to increase by xx% during the forecast period, primarily driven by expanding awareness and the availability of advanced products in emerging economies. Technological disruptions, such as the introduction of smart contact lenses with embedded sensors and therapeutics, are poised to revolutionize the market, although these are still in early stages of development. Consumer preferences are shifting towards enhanced comfort, longer wear times, and improved vision correction, influencing product innovation and competition. Competitive dynamics are shaped by factors such as pricing strategies, product differentiation, and brand loyalty.
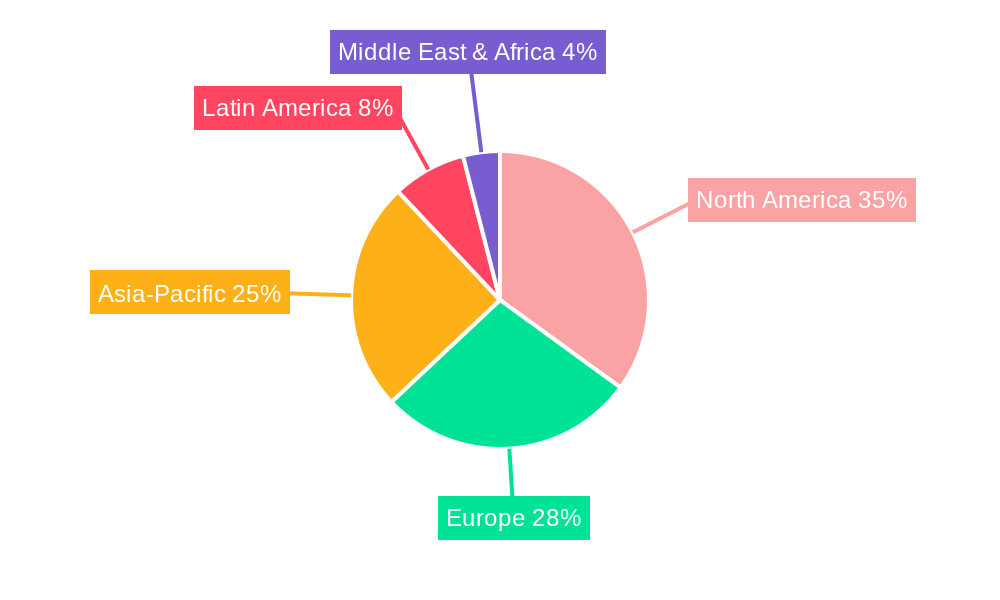
Dominant Markets & Segments in Daily Contact Lenses
The North American region holds a dominant position in the global daily contact lenses market, followed by Europe and Asia-Pacific. This dominance is attributed to factors such as high disposable incomes, advanced healthcare infrastructure, and a high prevalence of refractive errors.
Key Drivers of Regional Dominance:
- North America: High per capita income, advanced healthcare infrastructure, strong regulatory frameworks, and high adoption rates.
- Europe: Large and mature market, increasing awareness of eye health, presence of established players.
- Asia-Pacific: Rapidly expanding middle class, rising disposable incomes, increasing adoption rates, and significant growth potential.
The market is segmented by product type (silicone hydrogel, hydrogel), material (silicone hydrogel, hydrogel), application (vision correction, therapeutic), distribution channel (optical stores, online retailers), and end-user (adults, children). The silicone hydrogel segment is expected to exhibit significant growth due to its superior oxygen permeability and comfort.
Daily Contact Lenses Product Developments
Recent innovations in daily contact lenses focus on enhancing comfort, vision correction, and overall user experience. New materials with improved oxygen transmissibility and moisture retention provide a more comfortable wearing experience. Technological advancements in lens design and manufacturing processes improve clarity and vision quality. Moreover, the introduction of advanced coatings reduces deposits and improves the lifespan of the lenses. These innovations are crucial in attracting and retaining customers in a competitive market.
Report Scope & Segmentation Analysis
This report comprehensively analyzes the global daily contact lenses market, segmenting it by product type, material, application, distribution channel, and end-user. Growth projections for each segment are provided, taking into account the influence of various factors, including technological advancements, consumer preferences, and competitive dynamics. Market sizes for each segment are estimated for the historical period (2019-2024), base year (2025), and forecast period (2025-2033). Competitive dynamics within each segment are also assessed, highlighting key players and their respective market strategies.
Key Drivers of Daily Contact Lenses Growth
Several factors fuel the growth of the daily contact lenses market. Rising prevalence of refractive errors globally is a significant driver. Growing disposable incomes, particularly in emerging markets, are increasing the affordability of contact lenses. Technological advancements continue to improve lens comfort, vision quality, and overall user experience. Furthermore, increasing awareness about eye health and the convenience of daily disposable lenses contribute to growth.
Challenges in the Daily Contact Lenses Sector
Despite the growth potential, the daily contact lenses sector faces certain challenges. Regulatory hurdles and stringent approval processes can impede product launches and market expansion. Supply chain disruptions and fluctuations in raw material prices can impact manufacturing costs and profitability. Intense competition among established players and the emergence of new entrants create pressure on pricing and margins. These factors collectively influence market dynamics and growth trajectories.
Emerging Opportunities in Daily Contact Lenses
The daily contact lenses market presents numerous opportunities for growth. The expansion into emerging markets with a large unmet need for vision correction provides significant potential. The development of smart contact lenses with integrated sensors and therapeutic capabilities presents a revolutionary opportunity, though challenges in cost and regulatory approvals exist. Increased emphasis on personalized vision care and the growing adoption of online retail channels create additional growth opportunities.
Leading Players in the Daily Contact Lenses Market
- Johnson & Johnson
- Bausch & Lomb
- Hydron
- Ciba Vision (Part of Novartis)
- Weicon
- CooperVision
- Ocuius
- Clearlab
- Neo Vision
Key Developments in Daily Contact Lenses Industry
- 2022-Q4: Johnson & Johnson launched a new silicone hydrogel daily contact lens with enhanced comfort features.
- 2023-Q1: Bausch & Lomb announced a strategic partnership to expand its distribution network in Asia.
- 2023-Q2: CooperVision received FDA approval for a new daily disposable contact lens with improved UV protection.
- (Further developments will be added based on available data)
Strategic Outlook for Daily Contact Lenses Market
The future of the daily contact lenses market appears promising, with substantial growth potential driven by technological innovation, increasing consumer preference, and market expansion in developing countries. The ongoing development of advanced materials and lens designs will further enhance user comfort and vision quality. The emergence of smart contact lenses offers transformative possibilities, although technological maturity and regulatory approvals remain crucial factors. The market is set for continued expansion, driven by both organic growth and strategic acquisitions.
Daily Contact Lenses Segmentation
-
1. Application
- 1.1. Beauty Makeup
- 1.2. Vision Correction
-
2. Types
- 2.1. Corrective Glasses
- 2.2. Spectacles
- 2.3. Other
Daily Contact Lenses Segmentation By Geography
-
1. North America
- 1.1. United States
- 1.2. Canada
- 1.3. Mexico
-
2. South America
- 2.1. Brazil
- 2.2. Argentina
- 2.3. Rest of South America
-
3. Europe
- 3.1. United Kingdom
- 3.2. Germany
- 3.3. France
- 3.4. Italy
- 3.5. Spain
- 3.6. Russia
- 3.7. Benelux
- 3.8. Nordics
- 3.9. Rest of Europe
-
4. Middle East & Africa
- 4.1. Turkey
- 4.2. Israel
- 4.3. GCC
- 4.4. North Africa
- 4.5. South Africa
- 4.6. Rest of Middle East & Africa
-
5. Asia Pacific
- 5.1. China
- 5.2. India
- 5.3. Japan
- 5.4. South Korea
- 5.5. ASEAN
- 5.6. Oceania
- 5.7. Rest of Asia Pacific
Daily Contact Lenses Regional Market Share
Geographic Coverage of Daily Contact Lenses
Daily Contact Lenses REPORT HIGHLIGHTS
| Aspects | Details |
|---|---|
| Study Period | 2020-2034 |
| Base Year | 2025 |
| Estimated Year | 2026 |
| Forecast Period | 2026-2034 |
| Historical Period | 2020-2025 |
| Growth Rate | CAGR of 4.42% from 2020-2034 |
| Segmentation |
|
Table of Contents
- 1. Introduction
- 1.1. Research Scope
- 1.2. Market Segmentation
- 1.3. Research Methodology
- 1.4. Definitions and Assumptions
- 2. Executive Summary
- 2.1. Introduction
- 3. Market Dynamics
- 3.1. Introduction
- 3.2. Market Drivers
- 3.3. Market Restrains
- 3.4. Market Trends
- 4. Market Factor Analysis
- 4.1. Porters Five Forces
- 4.2. Supply/Value Chain
- 4.3. PESTEL analysis
- 4.4. Market Entropy
- 4.5. Patent/Trademark Analysis
- 5. Global Daily Contact Lenses Analysis, Insights and Forecast, 2020-2032
- 5.1. Market Analysis, Insights and Forecast - by Application
- 5.1.1. Beauty Makeup
- 5.1.2. Vision Correction
- 5.2. Market Analysis, Insights and Forecast - by Types
- 5.2.1. Corrective Glasses
- 5.2.2. Spectacles
- 5.2.3. Other
- 5.3. Market Analysis, Insights and Forecast - by Region
- 5.3.1. North America
- 5.3.2. South America
- 5.3.3. Europe
- 5.3.4. Middle East & Africa
- 5.3.5. Asia Pacific
- 5.1. Market Analysis, Insights and Forecast - by Application
- 6. North America Daily Contact Lenses Analysis, Insights and Forecast, 2020-2032
- 6.1. Market Analysis, Insights and Forecast - by Application
- 6.1.1. Beauty Makeup
- 6.1.2. Vision Correction
- 6.2. Market Analysis, Insights and Forecast - by Types
- 6.2.1. Corrective Glasses
- 6.2.2. Spectacles
- 6.2.3. Other
- 6.1. Market Analysis, Insights and Forecast - by Application
- 7. South America Daily Contact Lenses Analysis, Insights and Forecast, 2020-2032
- 7.1. Market Analysis, Insights and Forecast - by Application
- 7.1.1. Beauty Makeup
- 7.1.2. Vision Correction
- 7.2. Market Analysis, Insights and Forecast - by Types
- 7.2.1. Corrective Glasses
- 7.2.2. Spectacles
- 7.2.3. Other
- 7.1. Market Analysis, Insights and Forecast - by Application
- 8. Europe Daily Contact Lenses Analysis, Insights and Forecast, 2020-2032
- 8.1. Market Analysis, Insights and Forecast - by Application
- 8.1.1. Beauty Makeup
- 8.1.2. Vision Correction
- 8.2. Market Analysis, Insights and Forecast - by Types
- 8.2.1. Corrective Glasses
- 8.2.2. Spectacles
- 8.2.3. Other
- 8.1. Market Analysis, Insights and Forecast - by Application
- 9. Middle East & Africa Daily Contact Lenses Analysis, Insights and Forecast, 2020-2032
- 9.1. Market Analysis, Insights and Forecast - by Application
- 9.1.1. Beauty Makeup
- 9.1.2. Vision Correction
- 9.2. Market Analysis, Insights and Forecast - by Types
- 9.2.1. Corrective Glasses
- 9.2.2. Spectacles
- 9.2.3. Other
- 9.1. Market Analysis, Insights and Forecast - by Application
- 10. Asia Pacific Daily Contact Lenses Analysis, Insights and Forecast, 2020-2032
- 10.1. Market Analysis, Insights and Forecast - by Application
- 10.1.1. Beauty Makeup
- 10.1.2. Vision Correction
- 10.2. Market Analysis, Insights and Forecast - by Types
- 10.2.1. Corrective Glasses
- 10.2.2. Spectacles
- 10.2.3. Other
- 10.1. Market Analysis, Insights and Forecast - by Application
- 11. Competitive Analysis
- 11.1. Global Market Share Analysis 2025
- 11.2. Company Profiles
- 11.2.1 Johnson and Johnson
- 11.2.1.1. Overview
- 11.2.1.2. Products
- 11.2.1.3. SWOT Analysis
- 11.2.1.4. Recent Developments
- 11.2.1.5. Financials (Based on Availability)
- 11.2.2 Bausch & Lomb
- 11.2.2.1. Overview
- 11.2.2.2. Products
- 11.2.2.3. SWOT Analysis
- 11.2.2.4. Recent Developments
- 11.2.2.5. Financials (Based on Availability)
- 11.2.3 Hydron
- 11.2.3.1. Overview
- 11.2.3.2. Products
- 11.2.3.3. SWOT Analysis
- 11.2.3.4. Recent Developments
- 11.2.3.5. Financials (Based on Availability)
- 11.2.4 Ciba Vision
- 11.2.4.1. Overview
- 11.2.4.2. Products
- 11.2.4.3. SWOT Analysis
- 11.2.4.4. Recent Developments
- 11.2.4.5. Financials (Based on Availability)
- 11.2.5 Weicon
- 11.2.5.1. Overview
- 11.2.5.2. Products
- 11.2.5.3. SWOT Analysis
- 11.2.5.4. Recent Developments
- 11.2.5.5. Financials (Based on Availability)
- 11.2.6 Coopervision
- 11.2.6.1. Overview
- 11.2.6.2. Products
- 11.2.6.3. SWOT Analysis
- 11.2.6.4. Recent Developments
- 11.2.6.5. Financials (Based on Availability)
- 11.2.7 Ocuius
- 11.2.7.1. Overview
- 11.2.7.2. Products
- 11.2.7.3. SWOT Analysis
- 11.2.7.4. Recent Developments
- 11.2.7.5. Financials (Based on Availability)
- 11.2.8 Clearlab
- 11.2.8.1. Overview
- 11.2.8.2. Products
- 11.2.8.3. SWOT Analysis
- 11.2.8.4. Recent Developments
- 11.2.8.5. Financials (Based on Availability)
- 11.2.9 Neo Vision
- 11.2.9.1. Overview
- 11.2.9.2. Products
- 11.2.9.3. SWOT Analysis
- 11.2.9.4. Recent Developments
- 11.2.9.5. Financials (Based on Availability)
- 11.2.1 Johnson and Johnson
List of Figures
- Figure 1: Global Daily Contact Lenses Revenue Breakdown (undefined, %) by Region 2025 & 2033
- Figure 2: Global Daily Contact Lenses Volume Breakdown (K, %) by Region 2025 & 2033
- Figure 3: North America Daily Contact Lenses Revenue (undefined), by Application 2025 & 2033
- Figure 4: North America Daily Contact Lenses Volume (K), by Application 2025 & 2033
- Figure 5: North America Daily Contact Lenses Revenue Share (%), by Application 2025 & 2033
- Figure 6: North America Daily Contact Lenses Volume Share (%), by Application 2025 & 2033
- Figure 7: North America Daily Contact Lenses Revenue (undefined), by Types 2025 & 2033
- Figure 8: North America Daily Contact Lenses Volume (K), by Types 2025 & 2033
- Figure 9: North America Daily Contact Lenses Revenue Share (%), by Types 2025 & 2033
- Figure 10: North America Daily Contact Lenses Volume Share (%), by Types 2025 & 2033
- Figure 11: North America Daily Contact Lenses Revenue (undefined), by Country 2025 & 2033
- Figure 12: North America Daily Contact Lenses Volume (K), by Country 2025 & 2033
- Figure 13: North America Daily Contact Lenses Revenue Share (%), by Country 2025 & 2033
- Figure 14: North America Daily Contact Lenses Volume Share (%), by Country 2025 & 2033
- Figure 15: South America Daily Contact Lenses Revenue (undefined), by Application 2025 & 2033
- Figure 16: South America Daily Contact Lenses Volume (K), by Application 2025 & 2033
- Figure 17: South America Daily Contact Lenses Revenue Share (%), by Application 2025 & 2033
- Figure 18: South America Daily Contact Lenses Volume Share (%), by Application 2025 & 2033
- Figure 19: South America Daily Contact Lenses Revenue (undefined), by Types 2025 & 2033
- Figure 20: South America Daily Contact Lenses Volume (K), by Types 2025 & 2033
- Figure 21: South America Daily Contact Lenses Revenue Share (%), by Types 2025 & 2033
- Figure 22: South America Daily Contact Lenses Volume Share (%), by Types 2025 & 2033
- Figure 23: South America Daily Contact Lenses Revenue (undefined), by Country 2025 & 2033
- Figure 24: South America Daily Contact Lenses Volume (K), by Country 2025 & 2033
- Figure 25: South America Daily Contact Lenses Revenue Share (%), by Country 2025 & 2033
- Figure 26: South America Daily Contact Lenses Volume Share (%), by Country 2025 & 2033
- Figure 27: Europe Daily Contact Lenses Revenue (undefined), by Application 2025 & 2033
- Figure 28: Europe Daily Contact Lenses Volume (K), by Application 2025 & 2033
- Figure 29: Europe Daily Contact Lenses Revenue Share (%), by Application 2025 & 2033
- Figure 30: Europe Daily Contact Lenses Volume Share (%), by Application 2025 & 2033
- Figure 31: Europe Daily Contact Lenses Revenue (undefined), by Types 2025 & 2033
- Figure 32: Europe Daily Contact Lenses Volume (K), by Types 2025 & 2033
- Figure 33: Europe Daily Contact Lenses Revenue Share (%), by Types 2025 & 2033
- Figure 34: Europe Daily Contact Lenses Volume Share (%), by Types 2025 & 2033
- Figure 35: Europe Daily Contact Lenses Revenue (undefined), by Country 2025 & 2033
- Figure 36: Europe Daily Contact Lenses Volume (K), by Country 2025 & 2033
- Figure 37: Europe Daily Contact Lenses Revenue Share (%), by Country 2025 & 2033
- Figure 38: Europe Daily Contact Lenses Volume Share (%), by Country 2025 & 2033
- Figure 39: Middle East & Africa Daily Contact Lenses Revenue (undefined), by Application 2025 & 2033
- Figure 40: Middle East & Africa Daily Contact Lenses Volume (K), by Application 2025 & 2033
- Figure 41: Middle East & Africa Daily Contact Lenses Revenue Share (%), by Application 2025 & 2033
- Figure 42: Middle East & Africa Daily Contact Lenses Volume Share (%), by Application 2025 & 2033
- Figure 43: Middle East & Africa Daily Contact Lenses Revenue (undefined), by Types 2025 & 2033
- Figure 44: Middle East & Africa Daily Contact Lenses Volume (K), by Types 2025 & 2033
- Figure 45: Middle East & Africa Daily Contact Lenses Revenue Share (%), by Types 2025 & 2033
- Figure 46: Middle East & Africa Daily Contact Lenses Volume Share (%), by Types 2025 & 2033
- Figure 47: Middle East & Africa Daily Contact Lenses Revenue (undefined), by Country 2025 & 2033
- Figure 48: Middle East & Africa Daily Contact Lenses Volume (K), by Country 2025 & 2033
- Figure 49: Middle East & Africa Daily Contact Lenses Revenue Share (%), by Country 2025 & 2033
- Figure 50: Middle East & Africa Daily Contact Lenses Volume Share (%), by Country 2025 & 2033
- Figure 51: Asia Pacific Daily Contact Lenses Revenue (undefined), by Application 2025 & 2033
- Figure 52: Asia Pacific Daily Contact Lenses Volume (K), by Application 2025 & 2033
- Figure 53: Asia Pacific Daily Contact Lenses Revenue Share (%), by Application 2025 & 2033
- Figure 54: Asia Pacific Daily Contact Lenses Volume Share (%), by Application 2025 & 2033
- Figure 55: Asia Pacific Daily Contact Lenses Revenue (undefined), by Types 2025 & 2033
- Figure 56: Asia Pacific Daily Contact Lenses Volume (K), by Types 2025 & 2033
- Figure 57: Asia Pacific Daily Contact Lenses Revenue Share (%), by Types 2025 & 2033
- Figure 58: Asia Pacific Daily Contact Lenses Volume Share (%), by Types 2025 & 2033
- Figure 59: Asia Pacific Daily Contact Lenses Revenue (undefined), by Country 2025 & 2033
- Figure 60: Asia Pacific Daily Contact Lenses Volume (K), by Country 2025 & 2033
- Figure 61: Asia Pacific Daily Contact Lenses Revenue Share (%), by Country 2025 & 2033
- Figure 62: Asia Pacific Daily Contact Lenses Volume Share (%), by Country 2025 & 2033
List of Tables
- Table 1: Global Daily Contact Lenses Revenue undefined Forecast, by Application 2020 & 2033
- Table 2: Global Daily Contact Lenses Volume K Forecast, by Application 2020 & 2033
- Table 3: Global Daily Contact Lenses Revenue undefined Forecast, by Types 2020 & 2033
- Table 4: Global Daily Contact Lenses Volume K Forecast, by Types 2020 & 2033
- Table 5: Global Daily Contact Lenses Revenue undefined Forecast, by Region 2020 & 2033
- Table 6: Global Daily Contact Lenses Volume K Forecast, by Region 2020 & 2033
- Table 7: Global Daily Contact Lenses Revenue undefined Forecast, by Application 2020 & 2033
- Table 8: Global Daily Contact Lenses Volume K Forecast, by Application 2020 & 2033
- Table 9: Global Daily Contact Lenses Revenue undefined Forecast, by Types 2020 & 2033
- Table 10: Global Daily Contact Lenses Volume K Forecast, by Types 2020 & 2033
- Table 11: Global Daily Contact Lenses Revenue undefined Forecast, by Country 2020 & 2033
- Table 12: Global Daily Contact Lenses Volume K Forecast, by Country 2020 & 2033
- Table 13: United States Daily Contact Lenses Revenue (undefined) Forecast, by Application 2020 & 2033
- Table 14: United States Daily Contact Lenses Volume (K) Forecast, by Application 2020 & 2033
- Table 15: Canada Daily Contact Lenses Revenue (undefined) Forecast, by Application 2020 & 2033
- Table 16: Canada Daily Contact Lenses Volume (K) Forecast, by Application 2020 & 2033
- Table 17: Mexico Daily Contact Lenses Revenue (undefined) Forecast, by Application 2020 & 2033
- Table 18: Mexico Daily Contact Lenses Volume (K) Forecast, by Application 2020 & 2033
- Table 19: Global Daily Contact Lenses Revenue undefined Forecast, by Application 2020 & 2033
- Table 20: Global Daily Contact Lenses Volume K Forecast, by Application 2020 & 2033
- Table 21: Global Daily Contact Lenses Revenue undefined Forecast, by Types 2020 & 2033
- Table 22: Global Daily Contact Lenses Volume K Forecast, by Types 2020 & 2033
- Table 23: Global Daily Contact Lenses Revenue undefined Forecast, by Country 2020 & 2033
- Table 24: Global Daily Contact Lenses Volume K Forecast, by Country 2020 & 2033
- Table 25: Brazil Daily Contact Lenses Revenue (undefined) Forecast, by Application 2020 & 2033
- Table 26: Brazil Daily Contact Lenses Volume (K) Forecast, by Application 2020 & 2033
- Table 27: Argentina Daily Contact Lenses Revenue (undefined) Forecast, by Application 2020 & 2033
- Table 28: Argentina Daily Contact Lenses Volume (K) Forecast, by Application 2020 & 2033
- Table 29: Rest of South America Daily Contact Lenses Revenue (undefined) Forecast, by Application 2020 & 2033
- Table 30: Rest of South America Daily Contact Lenses Volume (K) Forecast, by Application 2020 & 2033
- Table 31: Global Daily Contact Lenses Revenue undefined Forecast, by Application 2020 & 2033
- Table 32: Global Daily Contact Lenses Volume K Forecast, by Application 2020 & 2033
- Table 33: Global Daily Contact Lenses Revenue undefined Forecast, by Types 2020 & 2033
- Table 34: Global Daily Contact Lenses Volume K Forecast, by Types 2020 & 2033
- Table 35: Global Daily Contact Lenses Revenue undefined Forecast, by Country 2020 & 2033
- Table 36: Global Daily Contact Lenses Volume K Forecast, by Country 2020 & 2033
- Table 37: United Kingdom Daily Contact Lenses Revenue (undefined) Forecast, by Application 2020 & 2033
- Table 38: United Kingdom Daily Contact Lenses Volume (K) Forecast, by Application 2020 & 2033
- Table 39: Germany Daily Contact Lenses Revenue (undefined) Forecast, by Application 2020 & 2033
- Table 40: Germany Daily Contact Lenses Volume (K) Forecast, by Application 2020 & 2033
- Table 41: France Daily Contact Lenses Revenue (undefined) Forecast, by Application 2020 & 2033
- Table 42: France Daily Contact Lenses Volume (K) Forecast, by Application 2020 & 2033
- Table 43: Italy Daily Contact Lenses Revenue (undefined) Forecast, by Application 2020 & 2033
- Table 44: Italy Daily Contact Lenses Volume (K) Forecast, by Application 2020 & 2033
- Table 45: Spain Daily Contact Lenses Revenue (undefined) Forecast, by Application 2020 & 2033
- Table 46: Spain Daily Contact Lenses Volume (K) Forecast, by Application 2020 & 2033
- Table 47: Russia Daily Contact Lenses Revenue (undefined) Forecast, by Application 2020 & 2033
- Table 48: Russia Daily Contact Lenses Volume (K) Forecast, by Application 2020 & 2033
- Table 49: Benelux Daily Contact Lenses Revenue (undefined) Forecast, by Application 2020 & 2033
- Table 50: Benelux Daily Contact Lenses Volume (K) Forecast, by Application 2020 & 2033
- Table 51: Nordics Daily Contact Lenses Revenue (undefined) Forecast, by Application 2020 & 2033
- Table 52: Nordics Daily Contact Lenses Volume (K) Forecast, by Application 2020 & 2033
- Table 53: Rest of Europe Daily Contact Lenses Revenue (undefined) Forecast, by Application 2020 & 2033
- Table 54: Rest of Europe Daily Contact Lenses Volume (K) Forecast, by Application 2020 & 2033
- Table 55: Global Daily Contact Lenses Revenue undefined Forecast, by Application 2020 & 2033
- Table 56: Global Daily Contact Lenses Volume K Forecast, by Application 2020 & 2033
- Table 57: Global Daily Contact Lenses Revenue undefined Forecast, by Types 2020 & 2033
- Table 58: Global Daily Contact Lenses Volume K Forecast, by Types 2020 & 2033
- Table 59: Global Daily Contact Lenses Revenue undefined Forecast, by Country 2020 & 2033
- Table 60: Global Daily Contact Lenses Volume K Forecast, by Country 2020 & 2033
- Table 61: Turkey Daily Contact Lenses Revenue (undefined) Forecast, by Application 2020 & 2033
- Table 62: Turkey Daily Contact Lenses Volume (K) Forecast, by Application 2020 & 2033
- Table 63: Israel Daily Contact Lenses Revenue (undefined) Forecast, by Application 2020 & 2033
- Table 64: Israel Daily Contact Lenses Volume (K) Forecast, by Application 2020 & 2033
- Table 65: GCC Daily Contact Lenses Revenue (undefined) Forecast, by Application 2020 & 2033
- Table 66: GCC Daily Contact Lenses Volume (K) Forecast, by Application 2020 & 2033
- Table 67: North Africa Daily Contact Lenses Revenue (undefined) Forecast, by Application 2020 & 2033
- Table 68: North Africa Daily Contact Lenses Volume (K) Forecast, by Application 2020 & 2033
- Table 69: South Africa Daily Contact Lenses Revenue (undefined) Forecast, by Application 2020 & 2033
- Table 70: South Africa Daily Contact Lenses Volume (K) Forecast, by Application 2020 & 2033
- Table 71: Rest of Middle East & Africa Daily Contact Lenses Revenue (undefined) Forecast, by Application 2020 & 2033
- Table 72: Rest of Middle East & Africa Daily Contact Lenses Volume (K) Forecast, by Application 2020 & 2033
- Table 73: Global Daily Contact Lenses Revenue undefined Forecast, by Application 2020 & 2033
- Table 74: Global Daily Contact Lenses Volume K Forecast, by Application 2020 & 2033
- Table 75: Global Daily Contact Lenses Revenue undefined Forecast, by Types 2020 & 2033
- Table 76: Global Daily Contact Lenses Volume K Forecast, by Types 2020 & 2033
- Table 77: Global Daily Contact Lenses Revenue undefined Forecast, by Country 2020 & 2033
- Table 78: Global Daily Contact Lenses Volume K Forecast, by Country 2020 & 2033
- Table 79: China Daily Contact Lenses Revenue (undefined) Forecast, by Application 2020 & 2033
- Table 80: China Daily Contact Lenses Volume (K) Forecast, by Application 2020 & 2033
- Table 81: India Daily Contact Lenses Revenue (undefined) Forecast, by Application 2020 & 2033
- Table 82: India Daily Contact Lenses Volume (K) Forecast, by Application 2020 & 2033
- Table 83: Japan Daily Contact Lenses Revenue (undefined) Forecast, by Application 2020 & 2033
- Table 84: Japan Daily Contact Lenses Volume (K) Forecast, by Application 2020 & 2033
- Table 85: South Korea Daily Contact Lenses Revenue (undefined) Forecast, by Application 2020 & 2033
- Table 86: South Korea Daily Contact Lenses Volume (K) Forecast, by Application 2020 & 2033
- Table 87: ASEAN Daily Contact Lenses Revenue (undefined) Forecast, by Application 2020 & 2033
- Table 88: ASEAN Daily Contact Lenses Volume (K) Forecast, by Application 2020 & 2033
- Table 89: Oceania Daily Contact Lenses Revenue (undefined) Forecast, by Application 2020 & 2033
- Table 90: Oceania Daily Contact Lenses Volume (K) Forecast, by Application 2020 & 2033
- Table 91: Rest of Asia Pacific Daily Contact Lenses Revenue (undefined) Forecast, by Application 2020 & 2033
- Table 92: Rest of Asia Pacific Daily Contact Lenses Volume (K) Forecast, by Application 2020 & 2033
Frequently Asked Questions
1. What is the projected Compound Annual Growth Rate (CAGR) of the Daily Contact Lenses?
The projected CAGR is approximately 4.42%.
2. Which companies are prominent players in the Daily Contact Lenses?
Key companies in the market include Johnson and Johnson, Bausch & Lomb, Hydron, Ciba Vision, Weicon, Coopervision, Ocuius, Clearlab, Neo Vision.
3. What are the main segments of the Daily Contact Lenses?
The market segments include Application, Types.
4. Can you provide details about the market size?
The market size is estimated to be USD XXX N/A as of 2022.
5. What are some drivers contributing to market growth?
N/A
6. What are the notable trends driving market growth?
N/A
7. Are there any restraints impacting market growth?
N/A
8. Can you provide examples of recent developments in the market?
N/A
9. What pricing options are available for accessing the report?
Pricing options include single-user, multi-user, and enterprise licenses priced at USD 3350.00, USD 5025.00, and USD 6700.00 respectively.
10. Is the market size provided in terms of value or volume?
The market size is provided in terms of value, measured in N/A and volume, measured in K.
11. Are there any specific market keywords associated with the report?
Yes, the market keyword associated with the report is "Daily Contact Lenses," which aids in identifying and referencing the specific market segment covered.
12. How do I determine which pricing option suits my needs best?
The pricing options vary based on user requirements and access needs. Individual users may opt for single-user licenses, while businesses requiring broader access may choose multi-user or enterprise licenses for cost-effective access to the report.
13. Are there any additional resources or data provided in the Daily Contact Lenses report?
While the report offers comprehensive insights, it's advisable to review the specific contents or supplementary materials provided to ascertain if additional resources or data are available.
14. How can I stay updated on further developments or reports in the Daily Contact Lenses?
To stay informed about further developments, trends, and reports in the Daily Contact Lenses, consider subscribing to industry newsletters, following relevant companies and organizations, or regularly checking reputable industry news sources and publications.
Methodology
Step 1 - Identification of Relevant Samples Size from Population Database


Step 2 - Approaches for Defining Global Market Size (Value, Volume* & Price*)

Note*: In applicable scenarios
Step 3 - Data Sources
Primary Research
- Web Analytics
- Survey Reports
- Research Institute
- Latest Research Reports
- Opinion Leaders
Secondary Research
- Annual Reports
- White Paper
- Latest Press Release
- Industry Association
- Paid Database
- Investor Presentations

Step 4 - Data Triangulation
Involves using different sources of information in order to increase the validity of a study
These sources are likely to be stakeholders in a program - participants, other researchers, program staff, other community members, and so on.
Then we put all data in single framework & apply various statistical tools to find out the dynamic on the market.
During the analysis stage, feedback from the stakeholder groups would be compared to determine areas of agreement as well as areas of divergence