

Key Insights
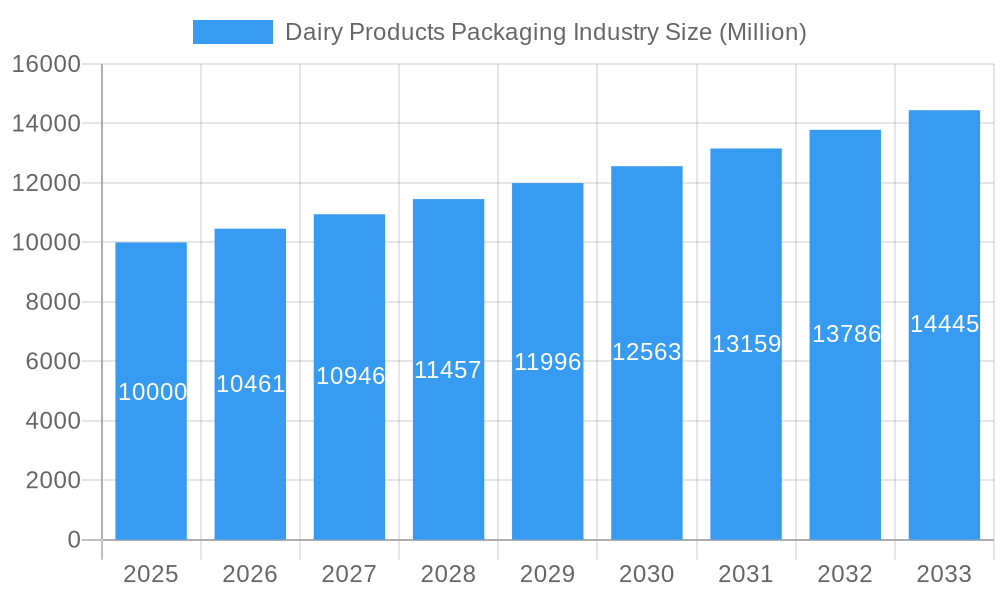
The dairy products packaging market is experiencing steady growth, driven by increasing demand for convenient and shelf-stable dairy products. A CAGR of 4.61% from 2019-2033 indicates a robust market trajectory, fueled by several key factors. The rising popularity of single-serve and ready-to-eat dairy products is a significant driver, demanding innovative packaging solutions that extend shelf life and maintain product quality. Consumer preference for sustainable and eco-friendly packaging is also impacting the market, leading to increased adoption of recyclable and biodegradable materials like paperboard and plant-based plastics. Furthermore, technological advancements in packaging materials and processes, such as aseptic packaging and modified atmosphere packaging (MAP), are enhancing product preservation and extending shelf life, contributing to market expansion. Segmentation reveals a diverse landscape, with plastic dominating the material segment due to its cost-effectiveness and versatility, while cartons and boxes lead the package type segment owing to their suitability for various dairy products. Key players like Amcor PLC, Berry Global Group Inc., and Sealed Air Corporation are actively shaping the market through strategic investments in research and development, focusing on enhancing material properties and expanding their product portfolio to cater to evolving consumer needs. Geographic distribution indicates strong market presence across North America and Europe, with significant growth potential in the Asia-Pacific region fueled by rising disposable incomes and changing consumption patterns.
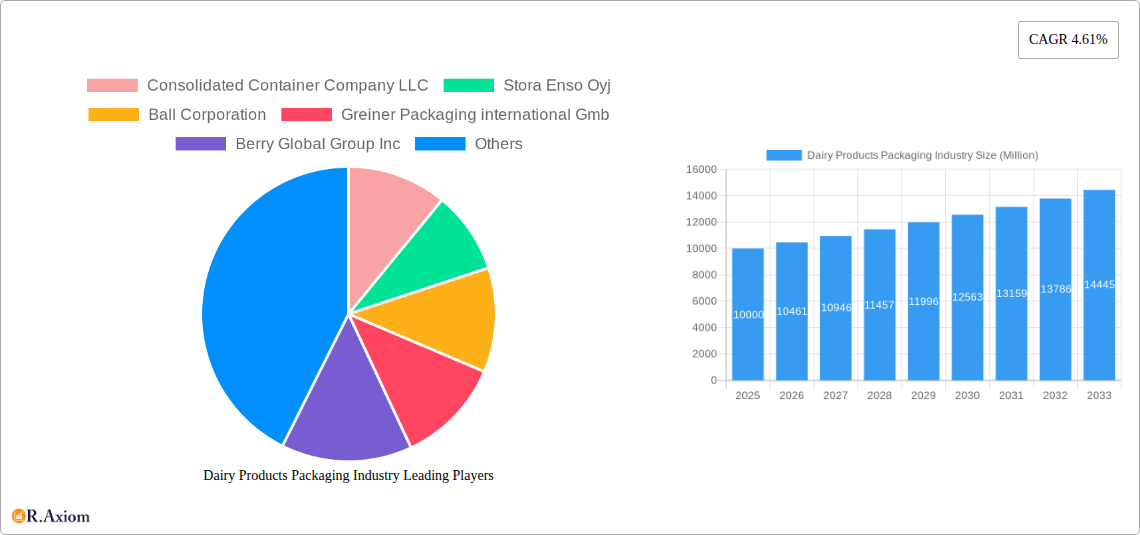
Dairy Products Packaging Industry Market Size (In Billion)
The competitive landscape is marked by both established multinational corporations and regional players. Companies are focusing on strategies such as mergers and acquisitions, collaborations, and product diversification to enhance their market position. Challenges include fluctuating raw material prices, stringent regulatory requirements regarding food safety and environmental sustainability, and the need to continuously innovate packaging solutions to meet the changing demands of consumers and address concerns about food waste. Future growth will depend heavily on successful adaptation to these challenges, with a continued focus on sustainable solutions and innovations that improve product quality, safety, and convenience. The market's trajectory suggests substantial potential for growth in the coming years, driven by a confluence of factors ranging from consumer preferences to technological advancements.
Dairy Products Packaging Industry Company Market Share
Dairy Products Packaging Industry: A Comprehensive Market Report (2019-2033)
This comprehensive report provides a detailed analysis of the Dairy Products Packaging Industry, offering invaluable insights for industry stakeholders, investors, and strategic decision-makers. Covering the period 2019-2033, with a base year of 2025, this report meticulously examines market dynamics, trends, and future projections. The report leverages rigorous research methodologies and incorporates current market data to deliver actionable intelligence. The study period covers 2019-2024 (historical period) and forecasts from 2025-2033 (forecast period), providing a holistic view of market evolution. Expected market size details will be included throughout the report.
Dairy Products Packaging Industry Market Concentration & Innovation
This section analyzes the competitive landscape of the dairy products packaging industry, focusing on market concentration, innovation drivers, regulatory frameworks, product substitutes, end-user trends, and mergers & acquisitions (M&A) activities. The report will delve into the market share held by key players such as Consolidated Container Company LLC, Stora Enso Oyj, Ball Corporation, Greiner Packaging International GmbH, Berry Global Group Inc, Huhtamaki Group, Winpak Ltd, Amcor PLC, International Paper Company, Sealed Air Corporation, and Saudi Basic Industries Corporation. We will assess the level of market concentration using metrics such as the Herfindahl-Hirschman Index (HHI) and identify potential trends towards consolidation or fragmentation.
The report will also analyze innovation drivers, including the growing demand for sustainable and eco-friendly packaging solutions, advancements in material science, and technological disruptions like automation and digitization. Furthermore, the report will explore the impact of regulatory frameworks, such as those related to food safety and environmental sustainability, on the industry's competitive dynamics. A detailed analysis of product substitutes, including alternative packaging materials and technologies, will also be provided. Finally, the report will examine end-user trends and their influence on packaging choices, along with an in-depth examination of M&A activities, including the value of completed deals and their impact on market concentration. XX Million is predicted to be the total value of M&A deals in the forecast period.
Dairy Products Packaging Industry Industry Trends & Insights
This section explores key trends shaping the dairy products packaging industry. We will analyze market growth drivers, including rising consumer demand for dairy products, changing consumer preferences toward convenience and sustainability, and the growing popularity of online grocery shopping. The report will also examine technological disruptions influencing packaging design, production, and distribution, highlighting the increasing adoption of automation, smart packaging technologies, and sustainable materials. We will assess the impact of consumer preferences on packaging choices, focusing on factors such as aesthetics, functionality, convenience, and environmental concerns. Furthermore, the report will delve into competitive dynamics, including pricing strategies, product differentiation, and marketing and distribution channels. Specific metrics like the compound annual growth rate (CAGR) and market penetration rates will be included. The anticipated CAGR for the industry during the forecast period is projected at xx%. The market penetration of sustainable packaging is expected to increase to xx% by 2033.
Dominant Markets & Segments in Dairy Products Packaging Industry
This section identifies the leading regional, country, and segmental markets within the dairy products packaging industry. Market dominance will be analyzed across various segments:
By Material: Plastic, Paper and Paperboard, Glass, Metal.
- Plastic: High demand due to versatility and cost-effectiveness, albeit with growing concerns about environmental impact. Growth is projected at xx Million over the forecast period.
- Paper and Paperboard: Increasing popularity due to renewability and recyclability, driven by sustainability initiatives. This segment is anticipated to reach xx Million by 2033.
- Glass: Premium segment for dairy products due to its perceived quality and barrier properties, but facing challenges due to weight and fragility. Growth will be relatively slower, reaching xx Million by 2033.
- Metal: Used for specific applications, offering good barrier properties but facing challenges with cost and recyclability. Expected growth: xx Million.
By Product: Milk, Cheese, Frozen Foods, Yogurt, Cultured Products.
- Milk: Largest segment, driven by high consumption rates globally. Expected value: xx Million in 2033.
- Cheese: Strong growth driven by increasing cheese consumption. Estimated market value: xx Million.
- Yogurt: Growing popularity of yogurt and its various forms drives significant demand. Value in 2033: xx Million.
- Frozen Foods: Demand influenced by convenience and preservation needs. Projected market size: xx Million.
- Cultured Products: Growth driven by health and wellness trends. Value in 2033: xx Million.
By Package Type: Bottles, Pouches, Cartons and Boxes, Bags and Wraps, Other Package Types.
- Bottles: Dominant in milk and cultured products. Projected market value: xx Million.
- Pouches: Increasing demand driven by flexible packaging and space-saving characteristics. Value in 2033: xx Million.
- Cartons and Boxes: Widely used for various dairy products, offering a balance of protection and convenience. Expected value: xx Million.
- Bags and Wraps: Used for cheese and other dairy products, offering flexibility and ease of use. Market value in 2033: xx Million.
- Other Package Types: Includes specialized packaging formats catering to specific needs. Market size in 2033: xx Million.
The report will detail key drivers for dominance in each segment, considering economic policies, infrastructure, and consumer preferences for each geographic location. The North American market is predicted to be the dominant region due to high dairy consumption and advanced packaging infrastructure.
Dairy Products Packaging Industry Product Developments
Recent product innovations are driving significant advancements in the dairy packaging market. The shift towards sustainable materials, such as plant-based plastics and recycled content, is prominent. Improved barrier properties and extended shelf life are key focal points, along with advancements in packaging design for enhanced convenience and consumer appeal. These developments are leading to the creation of more functional, aesthetically pleasing, and environmentally conscious dairy packaging solutions that better meet the evolving needs of both manufacturers and consumers.
Report Scope & Segmentation Analysis
This report provides a comprehensive analysis of the dairy products packaging industry, segmented by material (plastic, paper and paperboard, glass, metal), product (milk, cheese, frozen foods, yogurt, cultured products), and package type (bottles, pouches, cartons and boxes, bags and wraps, other). Each segment’s growth projections, market sizes, and competitive dynamics are thoroughly examined. The report provides detailed insights into the current market landscape and future trends, offering strategic direction for businesses within the industry.
Key Drivers of Dairy Products Packaging Industry Growth
Several key factors are driving the growth of the dairy products packaging industry. These include rising demand for dairy products due to population growth and changing dietary habits; the increasing adoption of sustainable and eco-friendly packaging options in response to environmental concerns; technological advancements leading to innovative packaging designs and materials; and regulatory changes promoting sustainability and food safety. Economic growth in emerging markets is another key driver, increasing the availability and demand for packaged dairy products.
Challenges in the Dairy Products Packaging Industry Sector
The dairy products packaging industry faces several challenges, including fluctuating raw material prices, stringent regulatory compliance requirements impacting production costs, and intense competition among packaging manufacturers. Supply chain disruptions and the need for continuous innovation to meet evolving consumer demands and environmental regulations present further obstacles. These challenges necessitate strategic planning and adaptability for industry players to maintain competitiveness and profitability. The estimated cost impact of these challenges on the industry is xx Million annually.
Emerging Opportunities in Dairy Products Packaging Industry
Several emerging opportunities are shaping the future of the dairy products packaging industry. The growing demand for sustainable and recyclable packaging presents significant opportunities for manufacturers offering environmentally friendly solutions. Advancements in smart packaging technologies, offering features like tamper evidence and enhanced traceability, are also creating new avenues for growth. Expansion into new geographic markets and the increasing integration of digital technologies in the packaging supply chain present further opportunities. These trends present opportunities for innovation and growth in the sector.
Leading Players in the Dairy Products Packaging Industry Market
Key Developments in Dairy Products Packaging Industry Industry
- May 2021: Stora Enso partnered with Pulpex to produce fiber-based bottles, offering a sustainable alternative to plastic.
- August 2021: Huhtamaki acquired Elif Holding A.S., expanding its presence in sustainable flexible packaging markets.
- September 2021: Greiner Packaging integrated chemically recycled polypropylene into its packaging for Emmi CAFFÈ LATTE.
Strategic Outlook for Dairy Products Packaging Industry Market
The dairy products packaging market is poised for significant growth driven by several key catalysts, including the increasing demand for sustainable packaging, ongoing technological advancements, and expanding global consumption of dairy products. Opportunities exist for companies that embrace innovation, sustainability, and efficient supply chain management. The market's future is bright, with potential for robust expansion and diversification.
Dairy Products Packaging Industry Segmentation
-
1. Material
- 1.1. Plastic
- 1.2. Paper and Paperboard
- 1.3. Glass
- 1.4. Metal
-
2. Product
- 2.1. Milk
- 2.2. Cheese
- 2.3. Frozen Foods
- 2.4. Yogurt
- 2.5. Cultured Products
-
3. Package Type
- 3.1. Bottles
- 3.2. Pouches
- 3.3. Cartons and Boxes
- 3.4. Bags and Wraps
- 3.5. Other Package Types
Dairy Products Packaging Industry Segmentation By Geography
- 1. North America
- 2. Europe
- 3. Asia Pacific
- 4. Latin America
- 5. Middle East and Africa
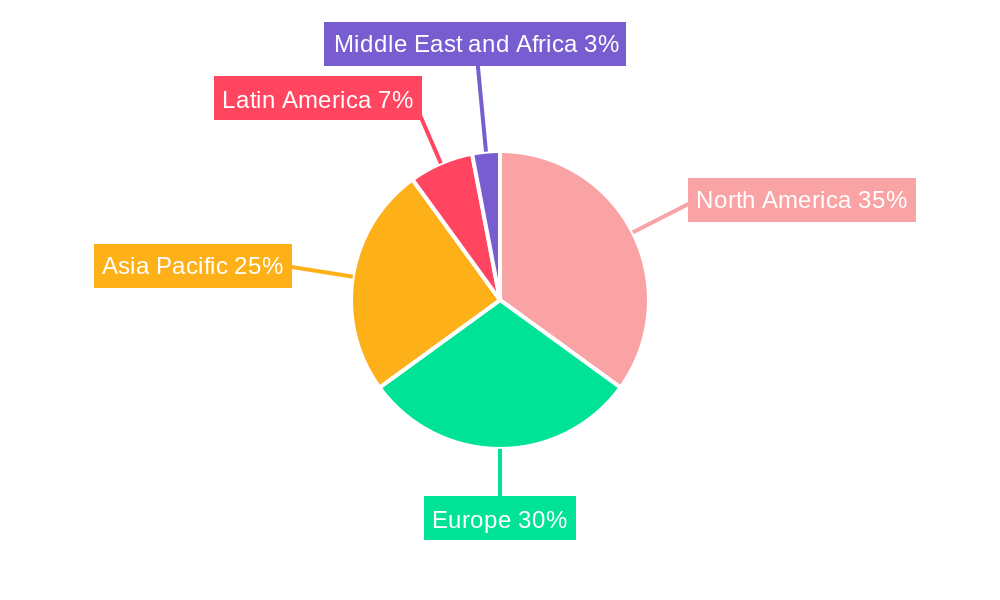
Dairy Products Packaging Industry Regional Market Share
Geographic Coverage of Dairy Products Packaging Industry
Dairy Products Packaging Industry REPORT HIGHLIGHTS
| Aspects | Details |
|---|---|
| Study Period | 2020-2034 |
| Base Year | 2025 |
| Estimated Year | 2026 |
| Forecast Period | 2026-2034 |
| Historical Period | 2020-2025 |
| Growth Rate | CAGR of 2.7% from 2020-2034 |
| Segmentation |
|
Table of Contents
- 1. Introduction
- 1.1. Research Scope
- 1.2. Market Segmentation
- 1.3. Research Objective
- 1.4. Definitions and Assumptions
- 2. Executive Summary
- 2.1. Market Snapshot
- 3. Market Dynamics
- 3.1. Market Drivers
- 3.2. Market Restrains
- 3.3. Market Trends
- 3.4. Market Opportunities
- 4. Market Factor Analysis
- 4.1. Porters Five Forces
- 4.1.1. Bargaining Power of Suppliers
- 4.1.2. Bargaining Power of Buyers
- 4.1.3. Threat of New Entrants
- 4.1.4. Threat of Substitutes
- 4.1.5. Competitive Rivalry
- 4.2. PESTEL analysis
- 4.3. BCG Analysis
- 4.3.1. Stars (High Growth, High Market Share)
- 4.3.2. Cash Cows (Low Growth, High Market Share)
- 4.3.3. Question Mark (High Growth, Low Market Share)
- 4.3.4. Dogs (Low Growth, Low Market Share)
- 4.4. Ansoff Matrix Analysis
- 4.5. Supply Chain Analysis
- 4.6. Regulatory Landscape
- 4.7. Current Market Potential and Opportunity Assessment (TAM–SAM–SOM Framework)
- 4.8. RAX Analyst Note
- 4.1. Porters Five Forces
- 5. Market Analysis, Insights and Forecast 2021-2033
- 5.1. Market Analysis, Insights and Forecast - by Material
- 5.1.1. Plastic
- 5.1.2. Paper and Paperboard
- 5.1.3. Glass
- 5.1.4. Metal
- 5.2. Market Analysis, Insights and Forecast - by Product
- 5.2.1. Milk
- 5.2.2. Cheese
- 5.2.3. Frozen Foods
- 5.2.4. Yogurt
- 5.2.5. Cultured Products
- 5.3. Market Analysis, Insights and Forecast - by Package Type
- 5.3.1. Bottles
- 5.3.2. Pouches
- 5.3.3. Cartons and Boxes
- 5.3.4. Bags and Wraps
- 5.3.5. Other Package Types
- 5.4. Market Analysis, Insights and Forecast - by Region
- 5.4.1. North America
- 5.4.2. Europe
- 5.4.3. Asia Pacific
- 5.4.4. Latin America
- 5.4.5. Middle East and Africa
- 5.1. Market Analysis, Insights and Forecast - by Material
- 6. Global Dairy Products Packaging Industry Analysis, Insights and Forecast, 2021-2033
- 6.1. Market Analysis, Insights and Forecast - by Material
- 6.1.1. Plastic
- 6.1.2. Paper and Paperboard
- 6.1.3. Glass
- 6.1.4. Metal
- 6.2. Market Analysis, Insights and Forecast - by Product
- 6.2.1. Milk
- 6.2.2. Cheese
- 6.2.3. Frozen Foods
- 6.2.4. Yogurt
- 6.2.5. Cultured Products
- 6.3. Market Analysis, Insights and Forecast - by Package Type
- 6.3.1. Bottles
- 6.3.2. Pouches
- 6.3.3. Cartons and Boxes
- 6.3.4. Bags and Wraps
- 6.3.5. Other Package Types
- 6.1. Market Analysis, Insights and Forecast - by Material
- 7. North America Dairy Products Packaging Industry Analysis, Insights and Forecast, 2020-2032
- 7.1. Market Analysis, Insights and Forecast - by Material
- 7.1.1. Plastic
- 7.1.2. Paper and Paperboard
- 7.1.3. Glass
- 7.1.4. Metal
- 7.2. Market Analysis, Insights and Forecast - by Product
- 7.2.1. Milk
- 7.2.2. Cheese
- 7.2.3. Frozen Foods
- 7.2.4. Yogurt
- 7.2.5. Cultured Products
- 7.3. Market Analysis, Insights and Forecast - by Package Type
- 7.3.1. Bottles
- 7.3.2. Pouches
- 7.3.3. Cartons and Boxes
- 7.3.4. Bags and Wraps
- 7.3.5. Other Package Types
- 7.1. Market Analysis, Insights and Forecast - by Material
- 8. Europe Dairy Products Packaging Industry Analysis, Insights and Forecast, 2020-2032
- 8.1. Market Analysis, Insights and Forecast - by Material
- 8.1.1. Plastic
- 8.1.2. Paper and Paperboard
- 8.1.3. Glass
- 8.1.4. Metal
- 8.2. Market Analysis, Insights and Forecast - by Product
- 8.2.1. Milk
- 8.2.2. Cheese
- 8.2.3. Frozen Foods
- 8.2.4. Yogurt
- 8.2.5. Cultured Products
- 8.3. Market Analysis, Insights and Forecast - by Package Type
- 8.3.1. Bottles
- 8.3.2. Pouches
- 8.3.3. Cartons and Boxes
- 8.3.4. Bags and Wraps
- 8.3.5. Other Package Types
- 8.1. Market Analysis, Insights and Forecast - by Material
- 9. Asia Pacific Dairy Products Packaging Industry Analysis, Insights and Forecast, 2020-2032
- 9.1. Market Analysis, Insights and Forecast - by Material
- 9.1.1. Plastic
- 9.1.2. Paper and Paperboard
- 9.1.3. Glass
- 9.1.4. Metal
- 9.2. Market Analysis, Insights and Forecast - by Product
- 9.2.1. Milk
- 9.2.2. Cheese
- 9.2.3. Frozen Foods
- 9.2.4. Yogurt
- 9.2.5. Cultured Products
- 9.3. Market Analysis, Insights and Forecast - by Package Type
- 9.3.1. Bottles
- 9.3.2. Pouches
- 9.3.3. Cartons and Boxes
- 9.3.4. Bags and Wraps
- 9.3.5. Other Package Types
- 9.1. Market Analysis, Insights and Forecast - by Material
- 10. Latin America Dairy Products Packaging Industry Analysis, Insights and Forecast, 2020-2032
- 10.1. Market Analysis, Insights and Forecast - by Material
- 10.1.1. Plastic
- 10.1.2. Paper and Paperboard
- 10.1.3. Glass
- 10.1.4. Metal
- 10.2. Market Analysis, Insights and Forecast - by Product
- 10.2.1. Milk
- 10.2.2. Cheese
- 10.2.3. Frozen Foods
- 10.2.4. Yogurt
- 10.2.5. Cultured Products
- 10.3. Market Analysis, Insights and Forecast - by Package Type
- 10.3.1. Bottles
- 10.3.2. Pouches
- 10.3.3. Cartons and Boxes
- 10.3.4. Bags and Wraps
- 10.3.5. Other Package Types
- 10.1. Market Analysis, Insights and Forecast - by Material
- 11. Middle East and Africa Dairy Products Packaging Industry Analysis, Insights and Forecast, 2020-2032
- 11.1. Market Analysis, Insights and Forecast - by Material
- 11.1.1. Plastic
- 11.1.2. Paper and Paperboard
- 11.1.3. Glass
- 11.1.4. Metal
- 11.2. Market Analysis, Insights and Forecast - by Product
- 11.2.1. Milk
- 11.2.2. Cheese
- 11.2.3. Frozen Foods
- 11.2.4. Yogurt
- 11.2.5. Cultured Products
- 11.3. Market Analysis, Insights and Forecast - by Package Type
- 11.3.1. Bottles
- 11.3.2. Pouches
- 11.3.3. Cartons and Boxes
- 11.3.4. Bags and Wraps
- 11.3.5. Other Package Types
- 11.1. Market Analysis, Insights and Forecast - by Material
- 12. Competitive Analysis
- 12.1. Company Profiles
- 12.1.1 Consolidated Container Company LLC
- 12.1.1.1. Company Overview
- 12.1.1.2. Products
- 12.1.1.3. Company Financials
- 12.1.1.4. SWOT Analysis
- 12.1.2 Stora Enso Oyj
- 12.1.2.1. Company Overview
- 12.1.2.2. Products
- 12.1.2.3. Company Financials
- 12.1.2.4. SWOT Analysis
- 12.1.3 Ball Corporation
- 12.1.3.1. Company Overview
- 12.1.3.2. Products
- 12.1.3.3. Company Financials
- 12.1.3.4. SWOT Analysis
- 12.1.4 Greiner Packaging international Gmb
- 12.1.4.1. Company Overview
- 12.1.4.2. Products
- 12.1.4.3. Company Financials
- 12.1.4.4. SWOT Analysis
- 12.1.5 Berry Global Group Inc
- 12.1.5.1. Company Overview
- 12.1.5.2. Products
- 12.1.5.3. Company Financials
- 12.1.5.4. SWOT Analysis
- 12.1.6 Huhtamaki Group
- 12.1.6.1. Company Overview
- 12.1.6.2. Products
- 12.1.6.3. Company Financials
- 12.1.6.4. SWOT Analysis
- 12.1.7 Winpak Ltd
- 12.1.7.1. Company Overview
- 12.1.7.2. Products
- 12.1.7.3. Company Financials
- 12.1.7.4. SWOT Analysis
- 12.1.8 Amcor PLC
- 12.1.8.1. Company Overview
- 12.1.8.2. Products
- 12.1.8.3. Company Financials
- 12.1.8.4. SWOT Analysis
- 12.1.9 International Paper Company
- 12.1.9.1. Company Overview
- 12.1.9.2. Products
- 12.1.9.3. Company Financials
- 12.1.9.4. SWOT Analysis
- 12.1.10 Sealed Air Corporation
- 12.1.10.1. Company Overview
- 12.1.10.2. Products
- 12.1.10.3. Company Financials
- 12.1.10.4. SWOT Analysis
- 12.1.11 Saudi Basic Industries Corporation
- 12.1.11.1. Company Overview
- 12.1.11.2. Products
- 12.1.11.3. Company Financials
- 12.1.11.4. SWOT Analysis
- 12.1.1 Consolidated Container Company LLC
- 12.2. Market Entropy
- 12.2.1 Company's Key Areas Served
- 12.2.2 Recent Developments
- 12.3. Company Market Share Analysis 2025
- 12.3.1 Top 5 Companies Market Share Analysis
- 12.3.2 Top 3 Companies Market Share Analysis
- 12.4. List of Potential Customers
- 13. Research Methodology
List of Figures
- Figure 1: Global Dairy Products Packaging Industry Revenue Breakdown (billion, %) by Region 2025 & 2033
- Figure 2: North America Dairy Products Packaging Industry Revenue (billion), by Material 2025 & 2033
- Figure 3: North America Dairy Products Packaging Industry Revenue Share (%), by Material 2025 & 2033
- Figure 4: North America Dairy Products Packaging Industry Revenue (billion), by Product 2025 & 2033
- Figure 5: North America Dairy Products Packaging Industry Revenue Share (%), by Product 2025 & 2033
- Figure 6: North America Dairy Products Packaging Industry Revenue (billion), by Package Type 2025 & 2033
- Figure 7: North America Dairy Products Packaging Industry Revenue Share (%), by Package Type 2025 & 2033
- Figure 8: North America Dairy Products Packaging Industry Revenue (billion), by Country 2025 & 2033
- Figure 9: North America Dairy Products Packaging Industry Revenue Share (%), by Country 2025 & 2033
- Figure 10: Europe Dairy Products Packaging Industry Revenue (billion), by Material 2025 & 2033
- Figure 11: Europe Dairy Products Packaging Industry Revenue Share (%), by Material 2025 & 2033
- Figure 12: Europe Dairy Products Packaging Industry Revenue (billion), by Product 2025 & 2033
- Figure 13: Europe Dairy Products Packaging Industry Revenue Share (%), by Product 2025 & 2033
- Figure 14: Europe Dairy Products Packaging Industry Revenue (billion), by Package Type 2025 & 2033
- Figure 15: Europe Dairy Products Packaging Industry Revenue Share (%), by Package Type 2025 & 2033
- Figure 16: Europe Dairy Products Packaging Industry Revenue (billion), by Country 2025 & 2033
- Figure 17: Europe Dairy Products Packaging Industry Revenue Share (%), by Country 2025 & 2033
- Figure 18: Asia Pacific Dairy Products Packaging Industry Revenue (billion), by Material 2025 & 2033
- Figure 19: Asia Pacific Dairy Products Packaging Industry Revenue Share (%), by Material 2025 & 2033
- Figure 20: Asia Pacific Dairy Products Packaging Industry Revenue (billion), by Product 2025 & 2033
- Figure 21: Asia Pacific Dairy Products Packaging Industry Revenue Share (%), by Product 2025 & 2033
- Figure 22: Asia Pacific Dairy Products Packaging Industry Revenue (billion), by Package Type 2025 & 2033
- Figure 23: Asia Pacific Dairy Products Packaging Industry Revenue Share (%), by Package Type 2025 & 2033
- Figure 24: Asia Pacific Dairy Products Packaging Industry Revenue (billion), by Country 2025 & 2033
- Figure 25: Asia Pacific Dairy Products Packaging Industry Revenue Share (%), by Country 2025 & 2033
- Figure 26: Latin America Dairy Products Packaging Industry Revenue (billion), by Material 2025 & 2033
- Figure 27: Latin America Dairy Products Packaging Industry Revenue Share (%), by Material 2025 & 2033
- Figure 28: Latin America Dairy Products Packaging Industry Revenue (billion), by Product 2025 & 2033
- Figure 29: Latin America Dairy Products Packaging Industry Revenue Share (%), by Product 2025 & 2033
- Figure 30: Latin America Dairy Products Packaging Industry Revenue (billion), by Package Type 2025 & 2033
- Figure 31: Latin America Dairy Products Packaging Industry Revenue Share (%), by Package Type 2025 & 2033
- Figure 32: Latin America Dairy Products Packaging Industry Revenue (billion), by Country 2025 & 2033
- Figure 33: Latin America Dairy Products Packaging Industry Revenue Share (%), by Country 2025 & 2033
- Figure 34: Middle East and Africa Dairy Products Packaging Industry Revenue (billion), by Material 2025 & 2033
- Figure 35: Middle East and Africa Dairy Products Packaging Industry Revenue Share (%), by Material 2025 & 2033
- Figure 36: Middle East and Africa Dairy Products Packaging Industry Revenue (billion), by Product 2025 & 2033
- Figure 37: Middle East and Africa Dairy Products Packaging Industry Revenue Share (%), by Product 2025 & 2033
- Figure 38: Middle East and Africa Dairy Products Packaging Industry Revenue (billion), by Package Type 2025 & 2033
- Figure 39: Middle East and Africa Dairy Products Packaging Industry Revenue Share (%), by Package Type 2025 & 2033
- Figure 40: Middle East and Africa Dairy Products Packaging Industry Revenue (billion), by Country 2025 & 2033
- Figure 41: Middle East and Africa Dairy Products Packaging Industry Revenue Share (%), by Country 2025 & 2033
List of Tables
- Table 1: Global Dairy Products Packaging Industry Revenue billion Forecast, by Material 2020 & 2033
- Table 2: Global Dairy Products Packaging Industry Revenue billion Forecast, by Product 2020 & 2033
- Table 3: Global Dairy Products Packaging Industry Revenue billion Forecast, by Package Type 2020 & 2033
- Table 4: Global Dairy Products Packaging Industry Revenue billion Forecast, by Region 2020 & 2033
- Table 5: Global Dairy Products Packaging Industry Revenue billion Forecast, by Material 2020 & 2033
- Table 6: Global Dairy Products Packaging Industry Revenue billion Forecast, by Product 2020 & 2033
- Table 7: Global Dairy Products Packaging Industry Revenue billion Forecast, by Package Type 2020 & 2033
- Table 8: Global Dairy Products Packaging Industry Revenue billion Forecast, by Country 2020 & 2033
- Table 9: Global Dairy Products Packaging Industry Revenue billion Forecast, by Material 2020 & 2033
- Table 10: Global Dairy Products Packaging Industry Revenue billion Forecast, by Product 2020 & 2033
- Table 11: Global Dairy Products Packaging Industry Revenue billion Forecast, by Package Type 2020 & 2033
- Table 12: Global Dairy Products Packaging Industry Revenue billion Forecast, by Country 2020 & 2033
- Table 13: Global Dairy Products Packaging Industry Revenue billion Forecast, by Material 2020 & 2033
- Table 14: Global Dairy Products Packaging Industry Revenue billion Forecast, by Product 2020 & 2033
- Table 15: Global Dairy Products Packaging Industry Revenue billion Forecast, by Package Type 2020 & 2033
- Table 16: Global Dairy Products Packaging Industry Revenue billion Forecast, by Country 2020 & 2033
- Table 17: Global Dairy Products Packaging Industry Revenue billion Forecast, by Material 2020 & 2033
- Table 18: Global Dairy Products Packaging Industry Revenue billion Forecast, by Product 2020 & 2033
- Table 19: Global Dairy Products Packaging Industry Revenue billion Forecast, by Package Type 2020 & 2033
- Table 20: Global Dairy Products Packaging Industry Revenue billion Forecast, by Country 2020 & 2033
- Table 21: Global Dairy Products Packaging Industry Revenue billion Forecast, by Material 2020 & 2033
- Table 22: Global Dairy Products Packaging Industry Revenue billion Forecast, by Product 2020 & 2033
- Table 23: Global Dairy Products Packaging Industry Revenue billion Forecast, by Package Type 2020 & 2033
- Table 24: Global Dairy Products Packaging Industry Revenue billion Forecast, by Country 2020 & 2033
Frequently Asked Questions
1. What is the projected Compound Annual Growth Rate (CAGR) of the Dairy Products Packaging Industry?
The projected CAGR is approximately 2.7%.
2. Which companies are prominent players in the Dairy Products Packaging Industry?
Key companies in the market include Consolidated Container Company LLC, Stora Enso Oyj, Ball Corporation, Greiner Packaging international Gmb, Berry Global Group Inc, Huhtamaki Group, Winpak Ltd, Amcor PLC, International Paper Company, Sealed Air Corporation, Saudi Basic Industries Corporation.
3. What are the main segments of the Dairy Products Packaging Industry?
The market segments include Material, Product, Package Type.
4. Can you provide details about the market size?
The market size is estimated to be USD 33.9 billion as of 2022.
5. What are some drivers contributing to market growth?
Increasing Consumer Preference Towards Protein-based Products; Increasing Adoption of Packages Incorporating Small Portion Size.
6. What are the notable trends driving market growth?
Milk Occupies the Largest Market Share.
7. Are there any restraints impacting market growth?
; Greenhouse Gas Emission due to Dairy Activities Leading to Legislative Issues.
8. Can you provide examples of recent developments in the market?
September 2021 - Greiner Packaging announced Emmi CAFFÈ LATTE, Europe's leading ready-to-drink iced coffee brand, will start incorporating its new chemically recycled polypropylene into packaging. Greiner Packaging makes these cups from chemically recycled material that comes from Borealis.
9. What pricing options are available for accessing the report?
Pricing options include single-user, multi-user, and enterprise licenses priced at USD 4750, USD 5250, and USD 8750 respectively.
10. Is the market size provided in terms of value or volume?
The market size is provided in terms of value, measured in billion.
11. Are there any specific market keywords associated with the report?
Yes, the market keyword associated with the report is "Dairy Products Packaging Industry," which aids in identifying and referencing the specific market segment covered.
12. How do I determine which pricing option suits my needs best?
The pricing options vary based on user requirements and access needs. Individual users may opt for single-user licenses, while businesses requiring broader access may choose multi-user or enterprise licenses for cost-effective access to the report.
13. Are there any additional resources or data provided in the Dairy Products Packaging Industry report?
While the report offers comprehensive insights, it's advisable to review the specific contents or supplementary materials provided to ascertain if additional resources or data are available.
14. How can I stay updated on further developments or reports in the Dairy Products Packaging Industry?
To stay informed about further developments, trends, and reports in the Dairy Products Packaging Industry, consider subscribing to industry newsletters, following relevant companies and organizations, or regularly checking reputable industry news sources and publications.
Methodology
Step 1 - Identification of Relevant Samples Size from Population Database


Step 2 - Approaches for Defining Global Market Size (Value, Volume* & Price*)

Note*: In applicable scenarios
Step 3 - Data Sources
Primary Research
- Web Analytics
- Survey Reports
- Research Institute
- Latest Research Reports
- Opinion Leaders
Secondary Research
- Annual Reports
- White Paper
- Latest Press Release
- Industry Association
- Paid Database
- Investor Presentations

Step 4 - Data Triangulation
Involves using different sources of information in order to increase the validity of a study
These sources are likely to be stakeholders in a program - participants, other researchers, program staff, other community members, and so on.
Then we put all data in single framework & apply various statistical tools to find out the dynamic on the market.
During the analysis stage, feedback from the stakeholder groups would be compared to determine areas of agreement as well as areas of divergence