Key Insights
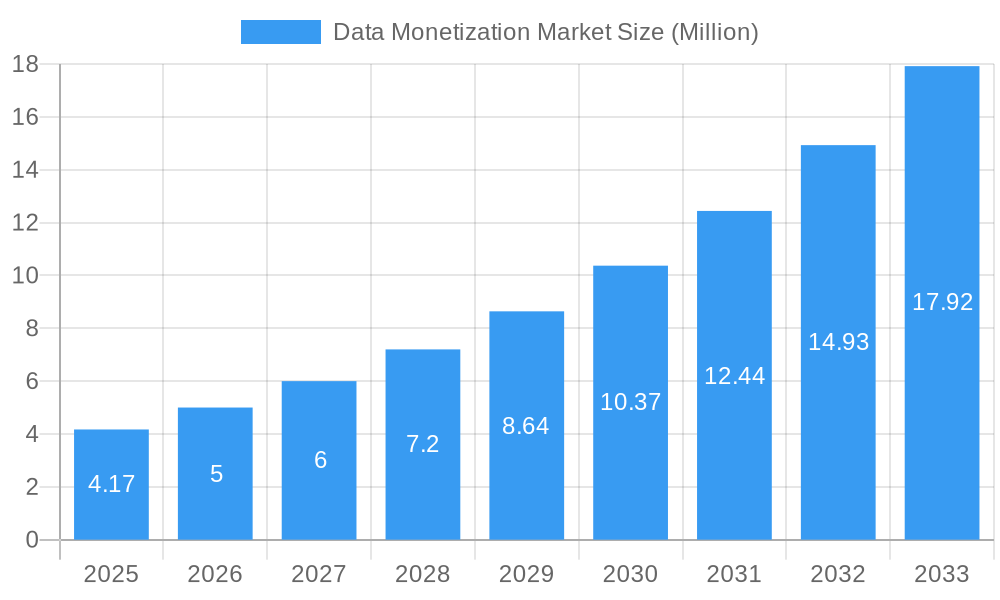
The global Data Monetization Market is experiencing robust expansion, projected to reach an estimated USD 4.17 million with an impressive Compound Annual Growth Rate (CAGR) of 19.94% during the forecast period of 2025-2033. This significant growth is primarily driven by the increasing volume of data generated across all sectors and the growing realization among organizations of its intrinsic value. Businesses are actively seeking innovative strategies to leverage their data assets, transforming them into new revenue streams through services, products, and enhanced operational efficiencies. The market is also propelled by advancements in data analytics, artificial intelligence, and machine learning, which enable more sophisticated methods of extracting insights and creating value from vast datasets. Furthermore, the escalating demand for personalized customer experiences and data-driven decision-making across industries like BFSI, Telecom and IT, Manufacturing, Healthcare, and Retail are acting as substantial catalysts for market growth. The adoption of data monetization strategies is no longer a niche concern but a strategic imperative for organizations aiming to maintain a competitive edge in today's data-centric economy.
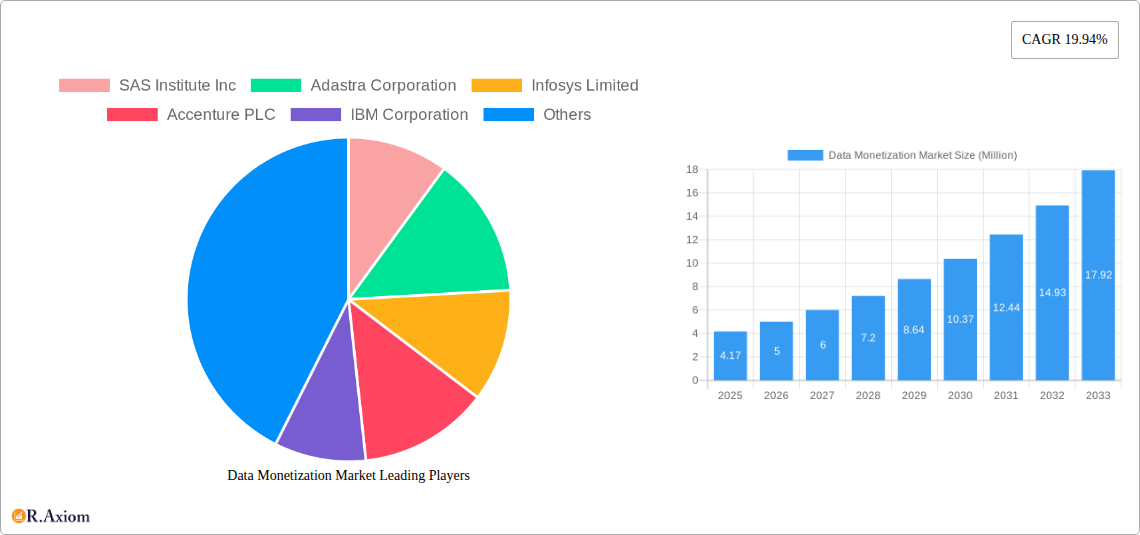
Data Monetization Market Market Size (In Million)
Several key trends are shaping the Data Monetization Market. The rise of data marketplaces and platforms is facilitating the secure and efficient exchange of data between organizations, fostering new business models and collaborative opportunities. As privacy concerns and regulations like GDPR and CCPA become more stringent, solutions focused on data anonymization, pseudonymization, and consent management are gaining prominence, ensuring ethical and compliant data monetization practices. Cloud adoption continues to be a major enabler, providing the scalable infrastructure required for data storage, processing, and analysis necessary for effective monetization. While the market is brimming with opportunities, certain restraints exist, such as data silos within organizations, the high cost of implementing advanced analytics tools, and a shortage of skilled data scientists and monetization strategists. Overcoming these challenges will be crucial for unlocking the full potential of data as a strategic asset, further accelerating the market's upward trajectory.
Data Monetization Market Company Market Share
This comprehensive report delivers an in-depth analysis of the global Data Monetization Market, projecting significant expansion and evolution between 2019 and 2033. With a base year of 2025, this study leverages historical data (2019-2024) to provide robust estimations and forecasts for the period 2025-2033. The market is experiencing a rapid transformation driven by the increasing value placed on data as a strategic asset across all industries. Stakeholders will gain actionable intelligence on market dynamics, competitive landscapes, and emerging opportunities.
Data Monetization Market Market Concentration & Innovation
The Data Monetization Market is characterized by a dynamic and evolving concentration of players, with innovation serving as a primary driver of growth and competitive advantage. While some large, established technology giants hold significant market share, the landscape also features agile startups and specialized solution providers. Regulatory frameworks are becoming increasingly crucial, influencing how data can be collected, utilized, and monetized ethically and compliantly. Product substitutes, such as traditional advertising or direct sales, are steadily being overshadowed by sophisticated data monetization strategies. End-user trends are shifting towards greater data ownership and personalized experiences, pushing companies to adopt advanced monetization models. Mergers and acquisitions (M&A) are frequent, as larger entities seek to acquire innovative technologies and expand their market reach. The overall M&A deal value is projected to reach hundreds of millions, reflecting the strategic importance of data monetization capabilities.
- Innovation Drivers: AI and machine learning for data analysis and prediction, blockchain for secure data sharing and monetization, and cloud-based platforms for scalable data management.
- Regulatory Frameworks: GDPR, CCPA, and emerging data privacy laws are shaping market practices and demanding transparent data handling.
- End-User Trends: Demand for personalized services, data privacy concerns, and a growing willingness to share data for tangible benefits.
- M&A Activity: Focus on acquiring companies with expertise in data analytics, AI-driven insights, and secure data marketplaces.
Data Monetization Market Industry Trends & Insights
The Data Monetization Market is poised for substantial growth, fueled by a confluence of technological advancements, evolving business strategies, and shifting consumer expectations. The core trend revolves around recognizing data not just as a byproduct of operations but as a valuable asset capable of generating revenue streams. The increasing adoption of digital technologies across industries has led to an exponential surge in data generation, creating a rich reservoir for monetization. Artificial intelligence (AI) and machine learning (ML) are pivotal in unlocking the latent value within this data, enabling advanced analytics, predictive modeling, and the creation of personalized customer experiences that can be directly monetized. The growth of the Internet of Things (IoT) is further amplifying data volumes, particularly in sectors like manufacturing and healthcare, opening up new avenues for data-driven services and insights.
Furthermore, the shift towards a data-centric economy is being accelerated by the development of robust data management platforms and secure data marketplaces. These platforms facilitate the exchange and monetization of data in a controlled and compliant manner, fostering collaboration and innovation. The rise of the API economy plays a critical role, allowing businesses to expose their data assets and analytical capabilities as services, thereby creating new B2B revenue opportunities. For instance, the Tecnotree partnership with BytePlus highlights the trend of CSPs transforming wholesale enterprise monetization through AI and API strategies, showcasing the growing importance of the B2B2X digital ecosystem.
The competitive dynamics within the Data Monetization Market are intensifying, with a clear distinction emerging between companies that can effectively leverage data for strategic advantage and those that lag behind. Differentiation is increasingly achieved through the ability to provide actionable insights, develop innovative data-driven products, and ensure data privacy and security. The market penetration of data monetization solutions is expected to grow significantly as more organizations understand the potential for increased revenue, improved operational efficiency, and enhanced customer engagement. The Compound Annual Growth Rate (CAGR) for the Data Monetization Market is projected to be robust, reflecting the increasing strategic imperative for businesses to capitalize on their data assets. The market is also seeing a rise in data-as-a-service (DaaS) models, where curated datasets are offered to businesses for a fee, catering to specific analytical needs. Consumer preferences are also evolving; individuals are becoming more aware of their data's value and are increasingly seeking transparent and beneficial data-sharing arrangements, as exemplified by Carv’s focus on empowering users with data ownership. This fundamental shift in consumer mindset is pushing the industry towards more ethical and value-exchange-based monetization strategies.
Dominant Markets & Segments in Data Monetization Market
The Data Monetization Market exhibits a clear dominance from certain regions and segments, driven by distinct economic policies, advanced infrastructure, and a strong propensity for technological adoption. The Telecom and IT sector is a leading end-user industry, capitalizing on the vast amounts of customer data generated through network operations, service usage, and digital interactions. These companies are adept at leveraging data for personalized service offerings, network optimization, and creating new revenue streams through data analytics and API monetization. The increasing deployment of 5G technology further amplifies the data generation capacity within this sector, creating fertile ground for innovative monetization strategies.
Large Enterprises represent a dominant segment in terms of market adoption and investment in data monetization solutions. Their extensive data repositories, established IT infrastructure, and the significant resources available for R&D and implementation make them early and aggressive adopters. They are particularly focused on using data monetization to gain competitive advantages, enhance customer relationships, and drive operational efficiencies. The BFSI sector also demonstrates substantial dominance, driven by the highly regulated nature of its operations and the immense value of financial and transactional data. Data monetization in BFSI is crucial for fraud detection, risk assessment, personalized financial advice, and developing innovative digital banking services.
- Leading Region/Country: North America and Europe currently lead the market due to their advanced technological infrastructure, strong regulatory frameworks that foster innovation (while ensuring privacy), and a high concentration of large enterprises across key sectors. Asia-Pacific is rapidly emerging as a significant growth region, driven by digital transformation initiatives and the proliferation of mobile data.
- Dominant End-User Industry: Telecom and IT
- Key Drivers: Massive data generation from network traffic and service subscriptions, increasing demand for personalized digital services, and the lucrative potential of API monetization for third-party developers.
- Dominance Analysis: Telecom operators possess a wealth of anonymized subscriber data and network performance data, which can be leveraged for market insights, targeted advertising, and improving service delivery. The rise of AI and 5G enables more sophisticated data analytics and the development of new data-driven business models.
- Dominant Organization Size: Large Enterprises
- Key Drivers: Availability of capital for investment in advanced data analytics and monetization platforms, the strategic importance of data for competitive differentiation, and the need to derive maximum ROI from existing data assets.
- Dominance Analysis: Large enterprises have the organizational capacity and the data volume to implement complex data monetization strategies, including data marketplaces, predictive analytics services, and data-driven product development. Their ability to integrate data monetization into their core business strategy provides a significant competitive edge.
- Dominant End-User Industry: BFSI
- Key Drivers: The critical need for advanced fraud detection and risk management, the growing demand for personalized financial products and advisory services, and the potential for creating new revenue streams through data-driven insights and partnerships.
- Dominance Analysis: The financial services sector handles sensitive and voluminous data, making sophisticated data monetization essential for security, compliance, and customer engagement. The ability to analyze customer behavior and market trends provides a significant advantage in product development and service delivery.
Data Monetization Market Product Developments
Product developments in the Data Monetization Market are rapidly advancing, focusing on creating secure, scalable, and AI-powered solutions. Innovations include sophisticated data governance platforms that ensure compliance with privacy regulations while enabling data sharing and monetization. AI-driven analytics engines are becoming central, offering predictive insights and enabling personalized customer experiences. Blockchain technology is increasingly being integrated to provide secure and transparent data transaction environments, empowering users with data ownership and monetization rights. Companies are also developing specialized data marketplaces and API management tools that simplify the process of data discovery, access, and revenue generation for businesses. These developments are crucial for enhancing data quality, unlocking new revenue streams, and gaining a competitive edge in an increasingly data-driven economy.
Report Scope & Segmentation Analysis
This report meticulously analyzes the Data Monetization Market across various critical segments, providing detailed insights into their individual growth trajectories and market potential.
- Organization Size:
- Small and Medium-sized Enterprises (SMEs): While historically lagging due to resource constraints, SMEs are increasingly adopting accessible data monetization solutions, cloud-based analytics, and specialized platforms to leverage their data for competitive advantage and revenue growth. Their market share is projected to increase as technology becomes more affordable and user-friendly.
- Large Enterprises: These organizations are the primary drivers of the current market, investing heavily in advanced data monetization strategies, proprietary analytics, and data marketplaces. They are expected to maintain a significant market share due to their extensive data volumes and strategic focus on data monetization.
- End-user Industry:
- BFSI: Dominant segment due to the high value of financial data for risk management, fraud detection, and personalized services. Strong growth is anticipated from predictive analytics and data-driven product development.
- Telecom and IT: A leading segment, benefiting from massive data generation and the opportunity for API monetization and personalized service offerings. The adoption of 5G is a key growth catalyst.
- Manufacturing: Growing adoption of IoT devices generates vast amounts of operational data, enabling predictive maintenance, supply chain optimization, and smart factory solutions.
- Healthcare: Increasing digitalization of patient records and medical devices is creating opportunities for data monetization in areas like personalized medicine, drug discovery, and population health management.
- Retail: Data monetization is crucial for personalized marketing, inventory management, customer behavior analysis, and optimizing the online and offline shopping experience.
- Other End-user Industries: This segment encompasses diverse sectors like media, government, and transportation, all of which are increasingly recognizing the value of their data for enhanced services and operational efficiency.
Key Drivers of Data Monetization Market Growth
The Data Monetization Market is experiencing robust growth driven by several interconnected factors. The exponential increase in data generation across all industries, propelled by digital transformation and the proliferation of connected devices, forms the foundational driver. Advanced analytical technologies, particularly AI and machine learning, are now capable of extracting actionable insights and predictive capabilities from this vast data reservoir, making it commercially viable. Businesses are increasingly viewing data as a strategic asset, recognizing its potential to create new revenue streams, enhance customer experiences, and gain a competitive edge. Regulatory shifts, while initially presenting challenges, are also fostering transparency and trust, ultimately supporting the ethical monetization of data. The growing demand for personalized products and services across various sectors compels organizations to leverage data to understand and cater to individual consumer needs.
Challenges in the Data Monetization Market Sector
Despite the immense growth potential, the Data Monetization Market faces several significant challenges. Data privacy concerns and evolving regulatory landscapes, such as GDPR and CCPA, necessitate complex compliance measures and can restrict the scope of data utilization. Ensuring data security against breaches and unauthorized access is paramount, requiring substantial investment in robust cybersecurity infrastructure. The technical complexity of data integration, management, and analysis can be a barrier, especially for smaller organizations lacking the necessary expertise and resources. Furthermore, a lack of clear data monetization strategies and business models can hinder successful implementation. Finally, overcoming organizational inertia and fostering a data-driven culture remains a challenge for many businesses.
Emerging Opportunities in Data Monetization Market
Emerging opportunities in the Data Monetization Market are vast and are being shaped by technological innovation and evolving consumer expectations. The rise of decentralized data ownership models, where individuals have greater control over their data and can monetize it directly, presents a significant shift. AI-powered data marketplaces that facilitate secure and efficient data exchange are gaining traction. The integration of data monetization strategies with emerging technologies like the metaverse and Web3 offers novel avenues for creating immersive and personalized experiences that can be monetized. Furthermore, the increasing demand for specialized, curated datasets for specific AI training and research purposes opens up niche monetization opportunities. The development of federated learning techniques allows for data analysis without centralizing sensitive data, addressing privacy concerns and unlocking new possibilities in sectors like healthcare.
Leading Players in the Data Monetization Market Market
- SAS Institute Inc
- Adastra Corporation
- Infosys Limited
- Accenture PLC
- IBM Corporation
- NetScout Systems Inc
- Dawex Systems SAS
- Ness Technologies Inc
- Google LLC (Alphabet Inc )
- Thales Group
- Cisco Systems Inc
- Openwave Mobility Inc (ENEA)
- SAP SE
- Emu Analytics Ltd
Key Developments in Data Monetization Market Industry
- April 2024: Carv, a data layer platform that lets web3 gaming apps, AI companies, and gamers control and monetize their data, raised a USD 10 million series A round led by Tribe Capital and IOSG Ventures. The company differentiates itself by empowering users with data ownership and monetization rights, which are expected to support the market growth during the forecast period.
- February 2024: Tecnotree, a digital platform and service leader for AI, 5G, and cloud-native technologies, partnered with BytePlus, the enterprise arm of Bytedance, to transform wholesale enterprise monetization through the Tecnotree Moments campaign management program for CSPs. This collaboration plans to work toward B2B2X digital ecosystem management, showcasing the growth opportunity of AI and API monetization strategies for CSPs across the world.
Strategic Outlook for Data Monetization Market Market
The strategic outlook for the Data Monetization Market is exceptionally positive, driven by the ongoing digital transformation and the increasing recognition of data as a core business asset. Key growth catalysts include the continued advancement of AI and machine learning capabilities, which are enabling more sophisticated data analysis and value extraction. The expansion of the API economy will further facilitate data sharing and the creation of new service-based revenue streams. As regulatory frameworks mature and consumer awareness around data privacy grows, there will be a greater emphasis on transparent and ethical data monetization practices, fostering trust and encouraging wider participation. The development of secure data marketplaces and decentralized data solutions will also play a crucial role in unlocking new opportunities and enabling a more equitable distribution of value derived from data. Companies that proactively invest in data governance, analytics infrastructure, and innovative monetization strategies will be well-positioned to thrive in this dynamic market.
Data Monetization Market Segmentation
-
1. Organization Size
- 1.1. Small and Medium-sized Enterprises
- 1.2. Large Enterprises
-
2. End-user Industry
- 2.1. BFSI
- 2.2. Telecom and IT
- 2.3. Manufacturing
- 2.4. Healthcare
- 2.5. Retail
- 2.6. Other End-user Industries
Data Monetization Market Segmentation By Geography
- 1. North America
- 2. Europe
- 3. Asia
- 4. Australia and New Zealand
- 5. Latin America
- 6. Middle East and Africa
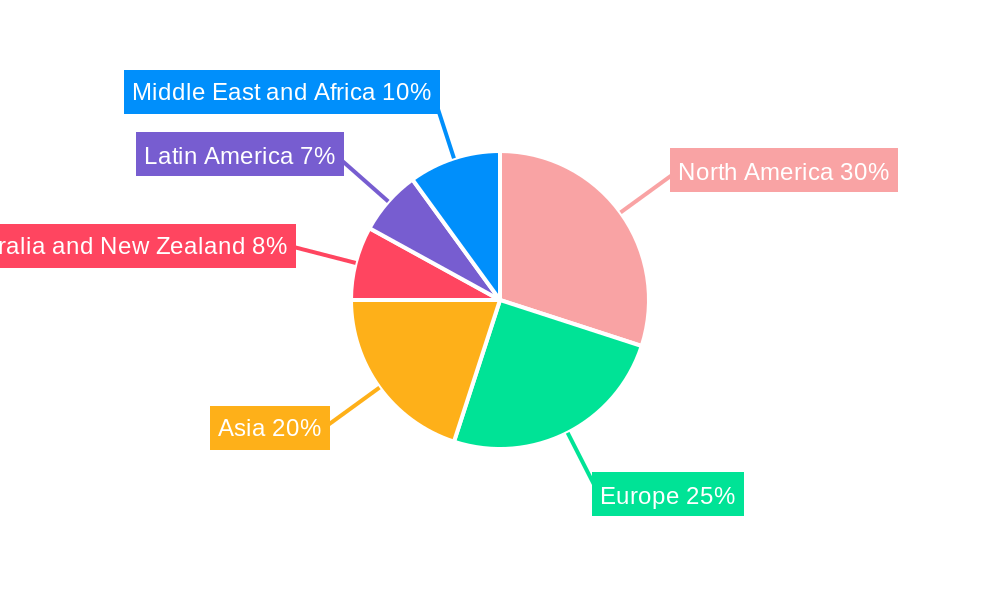
Data Monetization Market Regional Market Share
Geographic Coverage of Data Monetization Market
Data Monetization Market REPORT HIGHLIGHTS
| Aspects | Details |
|---|---|
| Study Period | 2020-2034 |
| Base Year | 2025 |
| Estimated Year | 2026 |
| Forecast Period | 2026-2034 |
| Historical Period | 2020-2025 |
| Growth Rate | CAGR of 19.94% from 2020-2034 |
| Segmentation |
|
Table of Contents
- 1. Introduction
- 1.1. Research Scope
- 1.2. Market Segmentation
- 1.3. Research Objective
- 1.4. Definitions and Assumptions
- 2. Executive Summary
- 2.1. Market Snapshot
- 3. Market Dynamics
- 3.1. Market Drivers
- 3.2. Market Restrains
- 3.3. Market Trends
- 3.4. Market Opportunities
- 4. Market Factor Analysis
- 4.1. Porters Five Forces
- 4.1.1. Bargaining Power of Suppliers
- 4.1.2. Bargaining Power of Buyers
- 4.1.3. Threat of New Entrants
- 4.1.4. Threat of Substitutes
- 4.1.5. Competitive Rivalry
- 4.2. PESTEL analysis
- 4.3. BCG Analysis
- 4.3.1. Stars (High Growth, High Market Share)
- 4.3.2. Cash Cows (Low Growth, High Market Share)
- 4.3.3. Question Mark (High Growth, Low Market Share)
- 4.3.4. Dogs (Low Growth, Low Market Share)
- 4.4. Ansoff Matrix Analysis
- 4.5. Supply Chain Analysis
- 4.6. Regulatory Landscape
- 4.7. Current Market Potential and Opportunity Assessment (TAM–SAM–SOM Framework)
- 4.8. RAX Analyst Note
- 4.1. Porters Five Forces
- 5. Market Analysis, Insights and Forecast 2021-2033
- 5.1. Market Analysis, Insights and Forecast - by Organization Size
- 5.1.1. Small and Medium-sized Enterprises
- 5.1.2. Large Enterprises
- 5.2. Market Analysis, Insights and Forecast - by End-user Industry
- 5.2.1. BFSI
- 5.2.2. Telecom and IT
- 5.2.3. Manufacturing
- 5.2.4. Healthcare
- 5.2.5. Retail
- 5.2.6. Other End-user Industries
- 5.3. Market Analysis, Insights and Forecast - by Region
- 5.3.1. North America
- 5.3.2. Europe
- 5.3.3. Asia
- 5.3.4. Australia and New Zealand
- 5.3.5. Latin America
- 5.3.6. Middle East and Africa
- 5.1. Market Analysis, Insights and Forecast - by Organization Size
- 6. Global Data Monetization Market Analysis, Insights and Forecast, 2021-2033
- 6.1. Market Analysis, Insights and Forecast - by Organization Size
- 6.1.1. Small and Medium-sized Enterprises
- 6.1.2. Large Enterprises
- 6.2. Market Analysis, Insights and Forecast - by End-user Industry
- 6.2.1. BFSI
- 6.2.2. Telecom and IT
- 6.2.3. Manufacturing
- 6.2.4. Healthcare
- 6.2.5. Retail
- 6.2.6. Other End-user Industries
- 6.1. Market Analysis, Insights and Forecast - by Organization Size
- 7. North America Data Monetization Market Analysis, Insights and Forecast, 2020-2032
- 7.1. Market Analysis, Insights and Forecast - by Organization Size
- 7.1.1. Small and Medium-sized Enterprises
- 7.1.2. Large Enterprises
- 7.2. Market Analysis, Insights and Forecast - by End-user Industry
- 7.2.1. BFSI
- 7.2.2. Telecom and IT
- 7.2.3. Manufacturing
- 7.2.4. Healthcare
- 7.2.5. Retail
- 7.2.6. Other End-user Industries
- 7.1. Market Analysis, Insights and Forecast - by Organization Size
- 8. Europe Data Monetization Market Analysis, Insights and Forecast, 2020-2032
- 8.1. Market Analysis, Insights and Forecast - by Organization Size
- 8.1.1. Small and Medium-sized Enterprises
- 8.1.2. Large Enterprises
- 8.2. Market Analysis, Insights and Forecast - by End-user Industry
- 8.2.1. BFSI
- 8.2.2. Telecom and IT
- 8.2.3. Manufacturing
- 8.2.4. Healthcare
- 8.2.5. Retail
- 8.2.6. Other End-user Industries
- 8.1. Market Analysis, Insights and Forecast - by Organization Size
- 9. Asia Data Monetization Market Analysis, Insights and Forecast, 2020-2032
- 9.1. Market Analysis, Insights and Forecast - by Organization Size
- 9.1.1. Small and Medium-sized Enterprises
- 9.1.2. Large Enterprises
- 9.2. Market Analysis, Insights and Forecast - by End-user Industry
- 9.2.1. BFSI
- 9.2.2. Telecom and IT
- 9.2.3. Manufacturing
- 9.2.4. Healthcare
- 9.2.5. Retail
- 9.2.6. Other End-user Industries
- 9.1. Market Analysis, Insights and Forecast - by Organization Size
- 10. Australia and New Zealand Data Monetization Market Analysis, Insights and Forecast, 2020-2032
- 10.1. Market Analysis, Insights and Forecast - by Organization Size
- 10.1.1. Small and Medium-sized Enterprises
- 10.1.2. Large Enterprises
- 10.2. Market Analysis, Insights and Forecast - by End-user Industry
- 10.2.1. BFSI
- 10.2.2. Telecom and IT
- 10.2.3. Manufacturing
- 10.2.4. Healthcare
- 10.2.5. Retail
- 10.2.6. Other End-user Industries
- 10.1. Market Analysis, Insights and Forecast - by Organization Size
- 11. Latin America Data Monetization Market Analysis, Insights and Forecast, 2020-2032
- 11.1. Market Analysis, Insights and Forecast - by Organization Size
- 11.1.1. Small and Medium-sized Enterprises
- 11.1.2. Large Enterprises
- 11.2. Market Analysis, Insights and Forecast - by End-user Industry
- 11.2.1. BFSI
- 11.2.2. Telecom and IT
- 11.2.3. Manufacturing
- 11.2.4. Healthcare
- 11.2.5. Retail
- 11.2.6. Other End-user Industries
- 11.1. Market Analysis, Insights and Forecast - by Organization Size
- 12. Middle East and Africa Data Monetization Market Analysis, Insights and Forecast, 2020-2032
- 12.1. Market Analysis, Insights and Forecast - by Organization Size
- 12.1.1. Small and Medium-sized Enterprises
- 12.1.2. Large Enterprises
- 12.2. Market Analysis, Insights and Forecast - by End-user Industry
- 12.2.1. BFSI
- 12.2.2. Telecom and IT
- 12.2.3. Manufacturing
- 12.2.4. Healthcare
- 12.2.5. Retail
- 12.2.6. Other End-user Industries
- 12.1. Market Analysis, Insights and Forecast - by Organization Size
- 13. Competitive Analysis
- 13.1. Company Profiles
- 13.1.1 SAS Institute Inc
- 13.1.1.1. Company Overview
- 13.1.1.2. Products
- 13.1.1.3. Company Financials
- 13.1.1.4. SWOT Analysis
- 13.1.2 Adastra Corporation
- 13.1.2.1. Company Overview
- 13.1.2.2. Products
- 13.1.2.3. Company Financials
- 13.1.2.4. SWOT Analysis
- 13.1.3 Infosys Limited
- 13.1.3.1. Company Overview
- 13.1.3.2. Products
- 13.1.3.3. Company Financials
- 13.1.3.4. SWOT Analysis
- 13.1.4 Accenture PLC
- 13.1.4.1. Company Overview
- 13.1.4.2. Products
- 13.1.4.3. Company Financials
- 13.1.4.4. SWOT Analysis
- 13.1.5 IBM Corporation
- 13.1.5.1. Company Overview
- 13.1.5.2. Products
- 13.1.5.3. Company Financials
- 13.1.5.4. SWOT Analysis
- 13.1.6 NetScout Systems Inc
- 13.1.6.1. Company Overview
- 13.1.6.2. Products
- 13.1.6.3. Company Financials
- 13.1.6.4. SWOT Analysis
- 13.1.7 Dawex Systems SAS
- 13.1.7.1. Company Overview
- 13.1.7.2. Products
- 13.1.7.3. Company Financials
- 13.1.7.4. SWOT Analysis
- 13.1.8 Ness Technologies Inc
- 13.1.8.1. Company Overview
- 13.1.8.2. Products
- 13.1.8.3. Company Financials
- 13.1.8.4. SWOT Analysis
- 13.1.9 Google LLC (Alphabet Inc )
- 13.1.9.1. Company Overview
- 13.1.9.2. Products
- 13.1.9.3. Company Financials
- 13.1.9.4. SWOT Analysis
- 13.1.10 Thales Group
- 13.1.10.1. Company Overview
- 13.1.10.2. Products
- 13.1.10.3. Company Financials
- 13.1.10.4. SWOT Analysis
- 13.1.11 Cisco Systems Inc
- 13.1.11.1. Company Overview
- 13.1.11.2. Products
- 13.1.11.3. Company Financials
- 13.1.11.4. SWOT Analysis
- 13.1.12 Openwave Mobility Inc (ENEA)
- 13.1.12.1. Company Overview
- 13.1.12.2. Products
- 13.1.12.3. Company Financials
- 13.1.12.4. SWOT Analysis
- 13.1.13 SAP SE
- 13.1.13.1. Company Overview
- 13.1.13.2. Products
- 13.1.13.3. Company Financials
- 13.1.13.4. SWOT Analysis
- 13.1.14 Emu Analytics Ltd
- 13.1.14.1. Company Overview
- 13.1.14.2. Products
- 13.1.14.3. Company Financials
- 13.1.14.4. SWOT Analysis
- 13.1.1 SAS Institute Inc
- 13.2. Market Entropy
- 13.2.1 Company's Key Areas Served
- 13.2.2 Recent Developments
- 13.3. Company Market Share Analysis 2025
- 13.3.1 Top 5 Companies Market Share Analysis
- 13.3.2 Top 3 Companies Market Share Analysis
- 13.4. List of Potential Customers
- 14. Research Methodology
List of Figures
- Figure 1: Global Data Monetization Market Revenue Breakdown (Million, %) by Region 2025 & 2033
- Figure 2: Global Data Monetization Market Volume Breakdown (K Unit, %) by Region 2025 & 2033
- Figure 3: North America Data Monetization Market Revenue (Million), by Organization Size 2025 & 2033
- Figure 4: North America Data Monetization Market Volume (K Unit), by Organization Size 2025 & 2033
- Figure 5: North America Data Monetization Market Revenue Share (%), by Organization Size 2025 & 2033
- Figure 6: North America Data Monetization Market Volume Share (%), by Organization Size 2025 & 2033
- Figure 7: North America Data Monetization Market Revenue (Million), by End-user Industry 2025 & 2033
- Figure 8: North America Data Monetization Market Volume (K Unit), by End-user Industry 2025 & 2033
- Figure 9: North America Data Monetization Market Revenue Share (%), by End-user Industry 2025 & 2033
- Figure 10: North America Data Monetization Market Volume Share (%), by End-user Industry 2025 & 2033
- Figure 11: North America Data Monetization Market Revenue (Million), by Country 2025 & 2033
- Figure 12: North America Data Monetization Market Volume (K Unit), by Country 2025 & 2033
- Figure 13: North America Data Monetization Market Revenue Share (%), by Country 2025 & 2033
- Figure 14: North America Data Monetization Market Volume Share (%), by Country 2025 & 2033
- Figure 15: Europe Data Monetization Market Revenue (Million), by Organization Size 2025 & 2033
- Figure 16: Europe Data Monetization Market Volume (K Unit), by Organization Size 2025 & 2033
- Figure 17: Europe Data Monetization Market Revenue Share (%), by Organization Size 2025 & 2033
- Figure 18: Europe Data Monetization Market Volume Share (%), by Organization Size 2025 & 2033
- Figure 19: Europe Data Monetization Market Revenue (Million), by End-user Industry 2025 & 2033
- Figure 20: Europe Data Monetization Market Volume (K Unit), by End-user Industry 2025 & 2033
- Figure 21: Europe Data Monetization Market Revenue Share (%), by End-user Industry 2025 & 2033
- Figure 22: Europe Data Monetization Market Volume Share (%), by End-user Industry 2025 & 2033
- Figure 23: Europe Data Monetization Market Revenue (Million), by Country 2025 & 2033
- Figure 24: Europe Data Monetization Market Volume (K Unit), by Country 2025 & 2033
- Figure 25: Europe Data Monetization Market Revenue Share (%), by Country 2025 & 2033
- Figure 26: Europe Data Monetization Market Volume Share (%), by Country 2025 & 2033
- Figure 27: Asia Data Monetization Market Revenue (Million), by Organization Size 2025 & 2033
- Figure 28: Asia Data Monetization Market Volume (K Unit), by Organization Size 2025 & 2033
- Figure 29: Asia Data Monetization Market Revenue Share (%), by Organization Size 2025 & 2033
- Figure 30: Asia Data Monetization Market Volume Share (%), by Organization Size 2025 & 2033
- Figure 31: Asia Data Monetization Market Revenue (Million), by End-user Industry 2025 & 2033
- Figure 32: Asia Data Monetization Market Volume (K Unit), by End-user Industry 2025 & 2033
- Figure 33: Asia Data Monetization Market Revenue Share (%), by End-user Industry 2025 & 2033
- Figure 34: Asia Data Monetization Market Volume Share (%), by End-user Industry 2025 & 2033
- Figure 35: Asia Data Monetization Market Revenue (Million), by Country 2025 & 2033
- Figure 36: Asia Data Monetization Market Volume (K Unit), by Country 2025 & 2033
- Figure 37: Asia Data Monetization Market Revenue Share (%), by Country 2025 & 2033
- Figure 38: Asia Data Monetization Market Volume Share (%), by Country 2025 & 2033
- Figure 39: Australia and New Zealand Data Monetization Market Revenue (Million), by Organization Size 2025 & 2033
- Figure 40: Australia and New Zealand Data Monetization Market Volume (K Unit), by Organization Size 2025 & 2033
- Figure 41: Australia and New Zealand Data Monetization Market Revenue Share (%), by Organization Size 2025 & 2033
- Figure 42: Australia and New Zealand Data Monetization Market Volume Share (%), by Organization Size 2025 & 2033
- Figure 43: Australia and New Zealand Data Monetization Market Revenue (Million), by End-user Industry 2025 & 2033
- Figure 44: Australia and New Zealand Data Monetization Market Volume (K Unit), by End-user Industry 2025 & 2033
- Figure 45: Australia and New Zealand Data Monetization Market Revenue Share (%), by End-user Industry 2025 & 2033
- Figure 46: Australia and New Zealand Data Monetization Market Volume Share (%), by End-user Industry 2025 & 2033
- Figure 47: Australia and New Zealand Data Monetization Market Revenue (Million), by Country 2025 & 2033
- Figure 48: Australia and New Zealand Data Monetization Market Volume (K Unit), by Country 2025 & 2033
- Figure 49: Australia and New Zealand Data Monetization Market Revenue Share (%), by Country 2025 & 2033
- Figure 50: Australia and New Zealand Data Monetization Market Volume Share (%), by Country 2025 & 2033
- Figure 51: Latin America Data Monetization Market Revenue (Million), by Organization Size 2025 & 2033
- Figure 52: Latin America Data Monetization Market Volume (K Unit), by Organization Size 2025 & 2033
- Figure 53: Latin America Data Monetization Market Revenue Share (%), by Organization Size 2025 & 2033
- Figure 54: Latin America Data Monetization Market Volume Share (%), by Organization Size 2025 & 2033
- Figure 55: Latin America Data Monetization Market Revenue (Million), by End-user Industry 2025 & 2033
- Figure 56: Latin America Data Monetization Market Volume (K Unit), by End-user Industry 2025 & 2033
- Figure 57: Latin America Data Monetization Market Revenue Share (%), by End-user Industry 2025 & 2033
- Figure 58: Latin America Data Monetization Market Volume Share (%), by End-user Industry 2025 & 2033
- Figure 59: Latin America Data Monetization Market Revenue (Million), by Country 2025 & 2033
- Figure 60: Latin America Data Monetization Market Volume (K Unit), by Country 2025 & 2033
- Figure 61: Latin America Data Monetization Market Revenue Share (%), by Country 2025 & 2033
- Figure 62: Latin America Data Monetization Market Volume Share (%), by Country 2025 & 2033
- Figure 63: Middle East and Africa Data Monetization Market Revenue (Million), by Organization Size 2025 & 2033
- Figure 64: Middle East and Africa Data Monetization Market Volume (K Unit), by Organization Size 2025 & 2033
- Figure 65: Middle East and Africa Data Monetization Market Revenue Share (%), by Organization Size 2025 & 2033
- Figure 66: Middle East and Africa Data Monetization Market Volume Share (%), by Organization Size 2025 & 2033
- Figure 67: Middle East and Africa Data Monetization Market Revenue (Million), by End-user Industry 2025 & 2033
- Figure 68: Middle East and Africa Data Monetization Market Volume (K Unit), by End-user Industry 2025 & 2033
- Figure 69: Middle East and Africa Data Monetization Market Revenue Share (%), by End-user Industry 2025 & 2033
- Figure 70: Middle East and Africa Data Monetization Market Volume Share (%), by End-user Industry 2025 & 2033
- Figure 71: Middle East and Africa Data Monetization Market Revenue (Million), by Country 2025 & 2033
- Figure 72: Middle East and Africa Data Monetization Market Volume (K Unit), by Country 2025 & 2033
- Figure 73: Middle East and Africa Data Monetization Market Revenue Share (%), by Country 2025 & 2033
- Figure 74: Middle East and Africa Data Monetization Market Volume Share (%), by Country 2025 & 2033
List of Tables
- Table 1: Global Data Monetization Market Revenue Million Forecast, by Organization Size 2020 & 2033
- Table 2: Global Data Monetization Market Volume K Unit Forecast, by Organization Size 2020 & 2033
- Table 3: Global Data Monetization Market Revenue Million Forecast, by End-user Industry 2020 & 2033
- Table 4: Global Data Monetization Market Volume K Unit Forecast, by End-user Industry 2020 & 2033
- Table 5: Global Data Monetization Market Revenue Million Forecast, by Region 2020 & 2033
- Table 6: Global Data Monetization Market Volume K Unit Forecast, by Region 2020 & 2033
- Table 7: Global Data Monetization Market Revenue Million Forecast, by Organization Size 2020 & 2033
- Table 8: Global Data Monetization Market Volume K Unit Forecast, by Organization Size 2020 & 2033
- Table 9: Global Data Monetization Market Revenue Million Forecast, by End-user Industry 2020 & 2033
- Table 10: Global Data Monetization Market Volume K Unit Forecast, by End-user Industry 2020 & 2033
- Table 11: Global Data Monetization Market Revenue Million Forecast, by Country 2020 & 2033
- Table 12: Global Data Monetization Market Volume K Unit Forecast, by Country 2020 & 2033
- Table 13: Global Data Monetization Market Revenue Million Forecast, by Organization Size 2020 & 2033
- Table 14: Global Data Monetization Market Volume K Unit Forecast, by Organization Size 2020 & 2033
- Table 15: Global Data Monetization Market Revenue Million Forecast, by End-user Industry 2020 & 2033
- Table 16: Global Data Monetization Market Volume K Unit Forecast, by End-user Industry 2020 & 2033
- Table 17: Global Data Monetization Market Revenue Million Forecast, by Country 2020 & 2033
- Table 18: Global Data Monetization Market Volume K Unit Forecast, by Country 2020 & 2033
- Table 19: Global Data Monetization Market Revenue Million Forecast, by Organization Size 2020 & 2033
- Table 20: Global Data Monetization Market Volume K Unit Forecast, by Organization Size 2020 & 2033
- Table 21: Global Data Monetization Market Revenue Million Forecast, by End-user Industry 2020 & 2033
- Table 22: Global Data Monetization Market Volume K Unit Forecast, by End-user Industry 2020 & 2033
- Table 23: Global Data Monetization Market Revenue Million Forecast, by Country 2020 & 2033
- Table 24: Global Data Monetization Market Volume K Unit Forecast, by Country 2020 & 2033
- Table 25: Global Data Monetization Market Revenue Million Forecast, by Organization Size 2020 & 2033
- Table 26: Global Data Monetization Market Volume K Unit Forecast, by Organization Size 2020 & 2033
- Table 27: Global Data Monetization Market Revenue Million Forecast, by End-user Industry 2020 & 2033
- Table 28: Global Data Monetization Market Volume K Unit Forecast, by End-user Industry 2020 & 2033
- Table 29: Global Data Monetization Market Revenue Million Forecast, by Country 2020 & 2033
- Table 30: Global Data Monetization Market Volume K Unit Forecast, by Country 2020 & 2033
- Table 31: Global Data Monetization Market Revenue Million Forecast, by Organization Size 2020 & 2033
- Table 32: Global Data Monetization Market Volume K Unit Forecast, by Organization Size 2020 & 2033
- Table 33: Global Data Monetization Market Revenue Million Forecast, by End-user Industry 2020 & 2033
- Table 34: Global Data Monetization Market Volume K Unit Forecast, by End-user Industry 2020 & 2033
- Table 35: Global Data Monetization Market Revenue Million Forecast, by Country 2020 & 2033
- Table 36: Global Data Monetization Market Volume K Unit Forecast, by Country 2020 & 2033
- Table 37: Global Data Monetization Market Revenue Million Forecast, by Organization Size 2020 & 2033
- Table 38: Global Data Monetization Market Volume K Unit Forecast, by Organization Size 2020 & 2033
- Table 39: Global Data Monetization Market Revenue Million Forecast, by End-user Industry 2020 & 2033
- Table 40: Global Data Monetization Market Volume K Unit Forecast, by End-user Industry 2020 & 2033
- Table 41: Global Data Monetization Market Revenue Million Forecast, by Country 2020 & 2033
- Table 42: Global Data Monetization Market Volume K Unit Forecast, by Country 2020 & 2033
Frequently Asked Questions
1. What is the projected Compound Annual Growth Rate (CAGR) of the Data Monetization Market?
The projected CAGR is approximately 19.94%.
2. Which companies are prominent players in the Data Monetization Market?
Key companies in the market include SAS Institute Inc, Adastra Corporation, Infosys Limited, Accenture PLC, IBM Corporation, NetScout Systems Inc, Dawex Systems SAS, Ness Technologies Inc, Google LLC (Alphabet Inc ), Thales Group, Cisco Systems Inc, Openwave Mobility Inc (ENEA), SAP SE, Emu Analytics Ltd.
3. What are the main segments of the Data Monetization Market?
The market segments include Organization Size, End-user Industry.
4. Can you provide details about the market size?
The market size is estimated to be USD 4.17 Million as of 2022.
5. What are some drivers contributing to market growth?
Rapid Adoption of Advanced Analytics and Visualization; Increasing Volume and Variety of Business Data.
6. What are the notable trends driving market growth?
Large Enterprises to Hold Major Market Share.
7. Are there any restraints impacting market growth?
Interoperability With Existing Systems; Varying Structure of Regulatory Policies.
8. Can you provide examples of recent developments in the market?
April 2024: Carv, a data layer platform that lets web3 gaming apps, AI companies, and gamers control and monetize their data, raised a USD 10 million series A round led by Tribe Capital and IOSG Ventures. The company differentiates itself by empowering users with data ownership and monetization rights, which are expected to support the market growth during the forecast period.
9. What pricing options are available for accessing the report?
Pricing options include single-user, multi-user, and enterprise licenses priced at USD 4750, USD 5250, and USD 8750 respectively.
10. Is the market size provided in terms of value or volume?
The market size is provided in terms of value, measured in Million and volume, measured in K Unit.
11. Are there any specific market keywords associated with the report?
Yes, the market keyword associated with the report is "Data Monetization Market," which aids in identifying and referencing the specific market segment covered.
12. How do I determine which pricing option suits my needs best?
The pricing options vary based on user requirements and access needs. Individual users may opt for single-user licenses, while businesses requiring broader access may choose multi-user or enterprise licenses for cost-effective access to the report.
13. Are there any additional resources or data provided in the Data Monetization Market report?
While the report offers comprehensive insights, it's advisable to review the specific contents or supplementary materials provided to ascertain if additional resources or data are available.
14. How can I stay updated on further developments or reports in the Data Monetization Market?
To stay informed about further developments, trends, and reports in the Data Monetization Market, consider subscribing to industry newsletters, following relevant companies and organizations, or regularly checking reputable industry news sources and publications.
Methodology
Step 1 - Identification of Relevant Samples Size from Population Database


Step 2 - Approaches for Defining Global Market Size (Value, Volume* & Price*)

Note*: In applicable scenarios
Step 3 - Data Sources
Primary Research
- Web Analytics
- Survey Reports
- Research Institute
- Latest Research Reports
- Opinion Leaders
Secondary Research
- Annual Reports
- White Paper
- Latest Press Release
- Industry Association
- Paid Database
- Investor Presentations

Step 4 - Data Triangulation
Involves using different sources of information in order to increase the validity of a study
These sources are likely to be stakeholders in a program - participants, other researchers, program staff, other community members, and so on.
Then we put all data in single framework & apply various statistical tools to find out the dynamic on the market.
During the analysis stage, feedback from the stakeholder groups would be compared to determine areas of agreement as well as areas of divergence

