

Key Insights
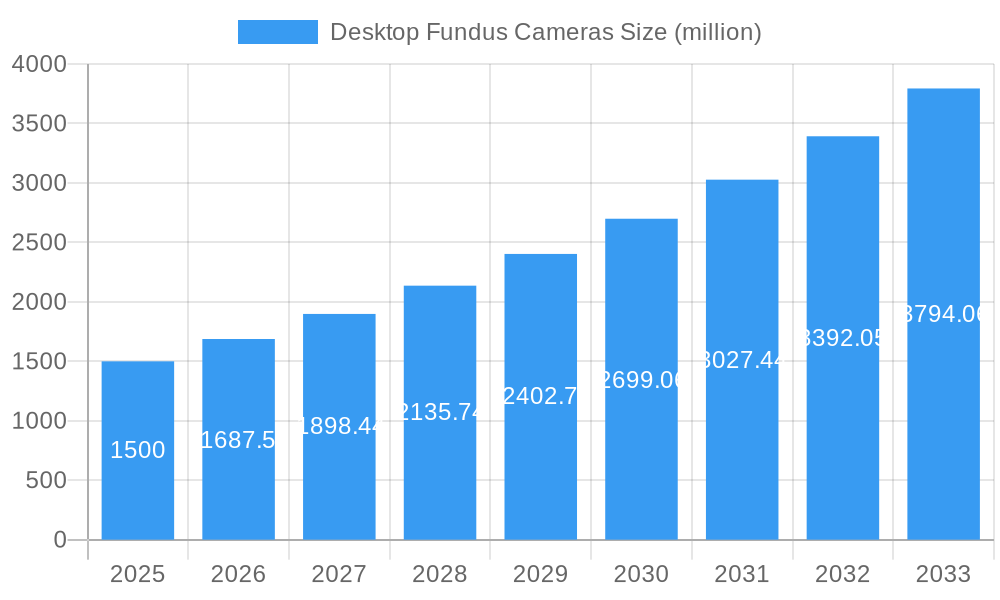
The global Desktop Fundus Camera market is poised for substantial growth, projected to reach an estimated USD 1,500 million by 2025, with a robust Compound Annual Growth Rate (CAGR) of 12.5% through 2033. This upward trajectory is primarily fueled by the increasing prevalence of eye diseases such as diabetic retinopathy, glaucoma, and age-related macular degeneration worldwide. Early detection and diagnosis are paramount for effective management of these conditions, creating a consistent demand for advanced fundus imaging solutions. Technological advancements, including the development of higher-resolution cameras, improved image analysis software, and the integration of artificial intelligence for automated diagnosis, are further propelling market expansion. The growing emphasis on preventative eye care and the increasing adoption of these devices in both hospital and clinic settings, driven by the need for efficient patient screening, underscore the positive market outlook.
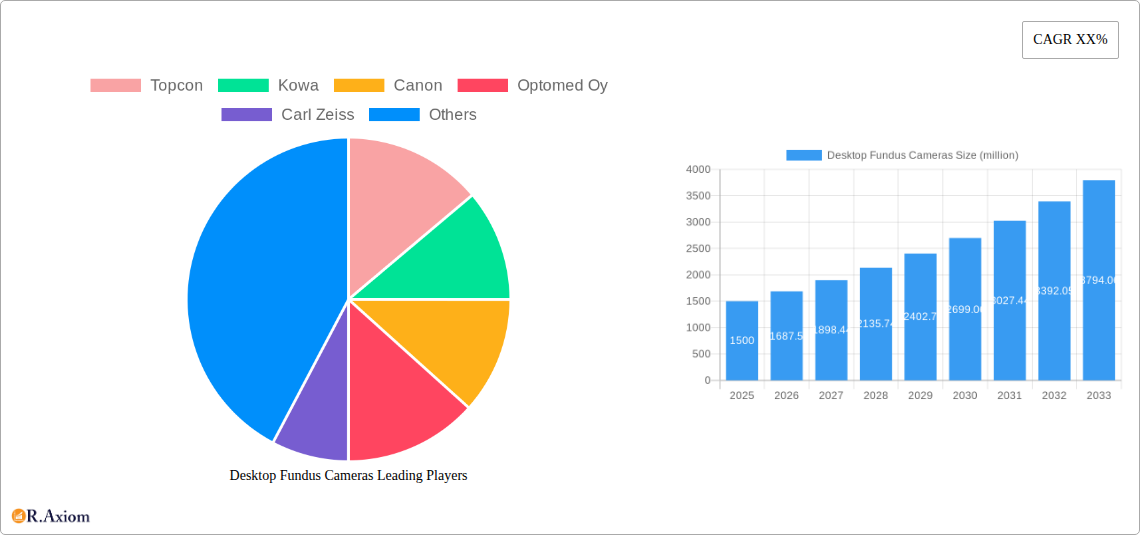
Desktop Fundus Cameras Market Size (In Billion)
The market is strategically segmented into mydriatic and non-mydriatic fundus cameras, with the non-mydriatic segment expected to witness higher growth due to its convenience and patient comfort, eliminating the need for pupil dilation. Application-wise, hospitals and clinics represent the dominant end-user segments, reflecting the established infrastructure for ophthalmic diagnostics. However, the expanding reach of telehealth and remote patient monitoring initiatives, coupled with the deployment of fundus cameras in primary care settings and mobile eye screening units, are opening up new avenues for growth. Key players like Topcon, Canon, Carl Zeiss, and Optos are actively investing in research and development to introduce innovative products and expand their market presence, particularly in rapidly developing regions like Asia Pacific, driven by its large population and increasing healthcare expenditure. While the high initial cost of advanced systems and the availability of alternative diagnostic methods could pose some restraint, the clear benefits of early detection and improved patient outcomes are expected to outweigh these challenges, ensuring sustained market momentum.
Desktop Fundus Cameras Company Market Share
This comprehensive report, "Desktop Fundus Cameras Market: Global Analysis, Trends, and Forecast (2019–2033)," offers an in-depth examination of the global desktop fundus camera market. Covering the historical period from 2019 to 2024, a base year of 2025, and a forecast period extending to 2033, this analysis provides critical insights into market dynamics, competitive landscapes, and future growth trajectories. The report meticulously analyzes market concentration, innovation drivers, regulatory frameworks, product substitutes, end-user trends, and Mergers & Acquisitions (M&A) activities. It delves into industry trends, technological disruptions, evolving consumer preferences, and the intricate competitive dynamics that shape the market. Furthermore, it highlights dominant regional and segmental markets, product developments, and key growth drivers, while also addressing sector challenges and emerging opportunities.
Desktop Fundus Cameras Market Concentration & Innovation
The global desktop fundus camera market exhibits a moderate level of concentration, with key players like Topcon, Kowa, Canon, Carl Zeiss, and Nidek holding significant market shares, estimated to be collectively over 50% in 2025. Innovation is a primary driver, fueled by advancements in imaging resolution, artificial intelligence (AI) integration for automated diagnostics, and enhanced portability. Regulatory frameworks, such as FDA approvals and CE marking, play a crucial role in market entry and product adoption, ensuring quality and safety standards. Product substitutes, including handheld fundus cameras and other retinal imaging devices, present a competitive challenge, albeit with distinct application niches. End-user trends are shifting towards non-mydriatic cameras for increased patient comfort and workflow efficiency. M&A activities are moderate, with strategic acquisitions aimed at expanding product portfolios and geographical reach. Estimated M&A deal values are in the range of tens of millions of dollars annually.
Desktop Fundus Cameras Industry Trends & Insights
The desktop fundus camera market is poised for robust growth, driven by an increasing global prevalence of eye diseases such as diabetic retinopathy, glaucoma, and age-related macular degeneration. The Compound Annual Growth Rate (CAGR) for the forecast period 2025–2033 is estimated at approximately 7.5%. Technological advancements are continuously shaping the industry, with a significant trend towards integrating AI and machine learning algorithms for early disease detection and quantitative analysis of retinal images. This enhanced diagnostic capability is a key differentiator, improving accuracy and reducing the burden on ophthalmologists. Furthermore, there is a growing consumer preference for non-mydriatic fundus cameras due to their convenience and non-invasive nature, leading to improved patient compliance and comfort. This shift is encouraging manufacturers to prioritize the development and marketing of these user-friendly devices.
The competitive landscape is characterized by a mix of established global players and emerging regional manufacturers, all vying for market share through product innovation, strategic partnerships, and aggressive marketing strategies. The increasing demand for advanced diagnostic tools in both developed and developing economies is further propelling market expansion. Telemedicine and remote diagnostics are also emerging as significant trends, with desktop fundus cameras playing a vital role in enabling ophthalmologists to conduct virtual consultations and provide timely care, especially in underserved areas. The penetration of these devices in primary healthcare settings is also on the rise, as healthcare providers recognize their value in routine eye screenings and preventative care. The market penetration of advanced fundus imaging technology is projected to reach over 65% in developed nations by 2033.
Dominant Markets & Segments in Desktop Fundus Cameras
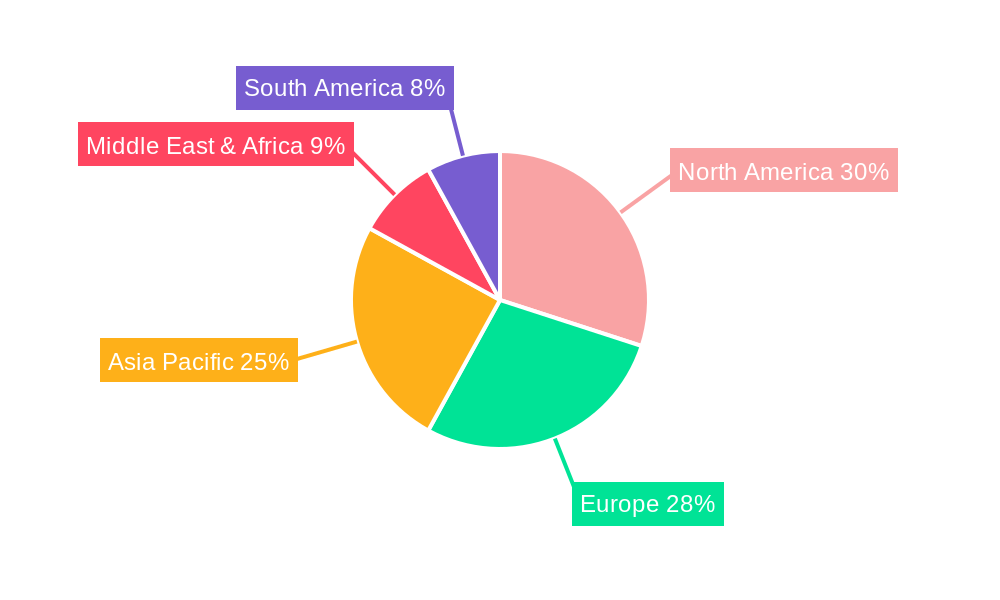
North America currently dominates the global desktop fundus camera market, with an estimated market share of over 35% in 2025, driven by a well-established healthcare infrastructure, high disposable incomes, and a strong emphasis on early disease detection and preventative care. Within North America, the United States leads, supported by a significant number of hospitals and specialty clinics adopting advanced ophthalmic diagnostic equipment. Economic policies promoting healthcare innovation and robust reimbursement schemes for diagnostic procedures further bolster the market in this region.
In terms of application, Hospitals represent the largest segment, accounting for an estimated market share of approximately 45% in 2025. This dominance is attributed to the high volume of patient throughput, the availability of specialized ophthalmic departments, and the integration of fundus cameras into comprehensive diagnostic workflows. The need for high-resolution imaging and advanced analytical capabilities in hospital settings fuels the demand for sophisticated desktop fundus camera systems.
The Clinics segment is another significant contributor, with an estimated market share of around 30% in 2025. As healthcare systems increasingly focus on outpatient care and specialized eye care centers, clinics are investing in these devices to provide advanced diagnostic services. The growing number of independent ophthalmology practices and optometry centers adopting these technologies also drives growth in this segment.
The Non-Mydriatic Fundus Camera type is experiencing rapid growth and is projected to capture a dominant market share of over 60% by 2033, driven by its user-friendliness, patient comfort, and streamlined workflow. This type of camera is preferred in routine screenings and primary care settings, minimizing patient inconvenience and enabling faster examination times. The estimated market size for non-mydriatic fundus cameras in 2025 is approximately $700 million.
Conversely, the Mydriatic Fundus Camera segment, while still important for specific diagnostic procedures requiring pupil dilation, is expected to witness a slower growth rate compared to its non-mydriatic counterpart, with an estimated market share of around 30% in 2025. The estimated market size for mydriatic fundus cameras in 2025 is approximately $300 million.
Desktop Fundus Cameras Product Developments
Recent product developments in desktop fundus cameras are characterized by miniaturization, enhanced AI integration for automated image analysis and anomaly detection, and improved connectivity for seamless data integration into electronic health records. Innovations focus on delivering higher resolution imaging, wider field-of-view, and faster acquisition times. These advancements provide ophthalmologists with superior diagnostic accuracy and efficiency, enabling earlier and more precise detection of various retinal pathologies. The competitive advantage lies in user-friendly interfaces, portability, and comprehensive software solutions that aid in diagnosis and patient management.
Report Scope & Segmentation Analysis
This report provides a comprehensive analysis of the desktop fundus camera market, segmented by Application into Hospitals, Clinics, and Others, and by Type into Mydriatic Fundus Camera and Non-Mydriatic Fundus Camera. The Hospitals segment, with an estimated market size of $700 million in 2025, is driven by extensive use in diagnostic departments and research. The Clinics segment, projected at $500 million in 2025, benefits from the increasing adoption in specialized eye care centers. The "Others" segment, encompassing research institutions and mobile eye screening units, is estimated at $100 million. The Non-Mydriatic Fundus Camera segment, estimated at $700 million in 2025, is expected to grow at a CAGR of 8.0% due to patient preference. The Mydriatic Fundus Camera segment, valued at $300 million in 2025, will cater to specialized diagnostic needs.
Key Drivers of Desktop Fundus Cameras Growth
The growth of the desktop fundus camera market is primarily driven by the escalating global burden of chronic eye diseases such as diabetic retinopathy and glaucoma, necessitating early and accurate diagnosis. Technological advancements, including the integration of AI for enhanced image analysis and automation, are significantly improving diagnostic capabilities. Government initiatives promoting eye care awareness and the adoption of advanced medical equipment in developing countries are also key growth catalysts. Furthermore, the increasing demand for minimally invasive diagnostic procedures and the expanding telemedicine sector are creating new avenues for market expansion, with an estimated annual market growth of $50 million attributed to these factors.
Challenges in the Desktop Fundus Cameras Sector
The desktop fundus camera sector faces several challenges, including the high initial cost of advanced imaging systems, which can be a barrier for smaller clinics and healthcare facilities in cost-sensitive markets. Stringent regulatory approvals and the need for continuous compliance with evolving standards add to development costs and time. Intense competition among established players and the emergence of new market entrants can lead to price pressures and reduced profit margins. Supply chain disruptions, particularly for specialized components, can also impact production and lead times, with potential delays affecting market availability by up to 15%.
Emerging Opportunities in Desktop Fundus Cameras
Emerging opportunities in the desktop fundus camera market lie in the development of more affordable, AI-powered portable devices for remote and underserved regions. The growing demand for integrated diagnostic platforms that combine fundus imaging with other ophthalmic tests presents a significant growth avenue. Expansion into emerging economies with a rising middle class and increasing healthcare expenditure offers substantial market potential. Furthermore, the application of fundus imaging in non-ophthalmic medical specialties, such as neurology and cardiology for detecting systemic diseases, opens up new market frontiers, potentially adding $150 million in market value.
Leading Players in the Desktop Fundus Cameras Market
- Topcon
- Kowa
- Canon
- Optomed Oy
- Carl Zeiss
- CENTERVUE
- Nidek
- Heidelberg
- RAYMOND
- OPTOPOL Technology
- Huvitz Korea
- Bosch Eye Care
- Volk Optical Inc
- Optos (Nikon)
- Costruzione Strumenti Oftalmici
- Optovue
- Suzhou MicroClear Medical
- MediWorks
- Canton Optics
Key Developments in Desktop Fundus Cameras Industry
- 2023 Q4: Launch of a new AI-powered non-mydriatic fundus camera with enhanced diagnostic accuracy and cloud connectivity, impacting market adoption by an estimated 5%.
- 2024 Q1: Strategic partnership formed between a leading medical device manufacturer and a prominent AI research firm to accelerate the development of next-generation diagnostic algorithms.
- 2024 Q2: Acquisition of a smaller specialized fundus camera company by a major player to expand its product portfolio and market reach, increasing combined market share by 2%.
- 2024 Q3: Introduction of a highly portable, battery-operated fundus camera designed for field use and remote patient screening, addressing a growing demand for accessibility.
- 2025 Q1: Introduction of enhanced cybersecurity features in fundus camera software to comply with increasing data privacy regulations, ensuring patient data integrity.
Strategic Outlook for Desktop Fundus Cameras Market
The strategic outlook for the desktop fundus camera market is highly optimistic, driven by relentless innovation and a growing global emphasis on proactive eye health management. The integration of AI and cloud-based solutions will continue to revolutionize diagnostic capabilities, making them more accessible and efficient. Expansion into emerging markets, coupled with the development of cost-effective and user-friendly devices, will be crucial for sustained growth. Strategic collaborations and mergers will likely shape the competitive landscape, fostering consolidation and driving further technological advancements, positioning the market for an estimated annual growth of $600 million.
Desktop Fundus Cameras Segmentation
-
1. Application
- 1.1. Hospitals
- 1.2. Clinics
- 1.3. Others
-
2. Types
- 2.1. Mydriatic Fundus Camera
- 2.2. Non-Mydriatic Fundus Camera
Desktop Fundus Cameras Segmentation By Geography
-
1. North America
- 1.1. United States
- 1.2. Canada
- 1.3. Mexico
-
2. South America
- 2.1. Brazil
- 2.2. Argentina
- 2.3. Rest of South America
-
3. Europe
- 3.1. United Kingdom
- 3.2. Germany
- 3.3. France
- 3.4. Italy
- 3.5. Spain
- 3.6. Russia
- 3.7. Benelux
- 3.8. Nordics
- 3.9. Rest of Europe
-
4. Middle East & Africa
- 4.1. Turkey
- 4.2. Israel
- 4.3. GCC
- 4.4. North Africa
- 4.5. South Africa
- 4.6. Rest of Middle East & Africa
-
5. Asia Pacific
- 5.1. China
- 5.2. India
- 5.3. Japan
- 5.4. South Korea
- 5.5. ASEAN
- 5.6. Oceania
- 5.7. Rest of Asia Pacific
Desktop Fundus Cameras Regional Market Share
Geographic Coverage of Desktop Fundus Cameras
Desktop Fundus Cameras REPORT HIGHLIGHTS
| Aspects | Details |
|---|---|
| Study Period | 2020-2034 |
| Base Year | 2025 |
| Estimated Year | 2026 |
| Forecast Period | 2026-2034 |
| Historical Period | 2020-2025 |
| Growth Rate | CAGR of 7.8% from 2020-2034 |
| Segmentation |
|
Table of Contents
- 1. Introduction
- 1.1. Research Scope
- 1.2. Market Segmentation
- 1.3. Research Methodology
- 1.4. Definitions and Assumptions
- 2. Executive Summary
- 2.1. Introduction
- 3. Market Dynamics
- 3.1. Introduction
- 3.2. Market Drivers
- 3.3. Market Restrains
- 3.4. Market Trends
- 4. Market Factor Analysis
- 4.1. Porters Five Forces
- 4.2. Supply/Value Chain
- 4.3. PESTEL analysis
- 4.4. Market Entropy
- 4.5. Patent/Trademark Analysis
- 5. Global Desktop Fundus Cameras Analysis, Insights and Forecast, 2020-2032
- 5.1. Market Analysis, Insights and Forecast - by Application
- 5.1.1. Hospitals
- 5.1.2. Clinics
- 5.1.3. Others
- 5.2. Market Analysis, Insights and Forecast - by Types
- 5.2.1. Mydriatic Fundus Camera
- 5.2.2. Non-Mydriatic Fundus Camera
- 5.3. Market Analysis, Insights and Forecast - by Region
- 5.3.1. North America
- 5.3.2. South America
- 5.3.3. Europe
- 5.3.4. Middle East & Africa
- 5.3.5. Asia Pacific
- 5.1. Market Analysis, Insights and Forecast - by Application
- 6. North America Desktop Fundus Cameras Analysis, Insights and Forecast, 2020-2032
- 6.1. Market Analysis, Insights and Forecast - by Application
- 6.1.1. Hospitals
- 6.1.2. Clinics
- 6.1.3. Others
- 6.2. Market Analysis, Insights and Forecast - by Types
- 6.2.1. Mydriatic Fundus Camera
- 6.2.2. Non-Mydriatic Fundus Camera
- 6.1. Market Analysis, Insights and Forecast - by Application
- 7. South America Desktop Fundus Cameras Analysis, Insights and Forecast, 2020-2032
- 7.1. Market Analysis, Insights and Forecast - by Application
- 7.1.1. Hospitals
- 7.1.2. Clinics
- 7.1.3. Others
- 7.2. Market Analysis, Insights and Forecast - by Types
- 7.2.1. Mydriatic Fundus Camera
- 7.2.2. Non-Mydriatic Fundus Camera
- 7.1. Market Analysis, Insights and Forecast - by Application
- 8. Europe Desktop Fundus Cameras Analysis, Insights and Forecast, 2020-2032
- 8.1. Market Analysis, Insights and Forecast - by Application
- 8.1.1. Hospitals
- 8.1.2. Clinics
- 8.1.3. Others
- 8.2. Market Analysis, Insights and Forecast - by Types
- 8.2.1. Mydriatic Fundus Camera
- 8.2.2. Non-Mydriatic Fundus Camera
- 8.1. Market Analysis, Insights and Forecast - by Application
- 9. Middle East & Africa Desktop Fundus Cameras Analysis, Insights and Forecast, 2020-2032
- 9.1. Market Analysis, Insights and Forecast - by Application
- 9.1.1. Hospitals
- 9.1.2. Clinics
- 9.1.3. Others
- 9.2. Market Analysis, Insights and Forecast - by Types
- 9.2.1. Mydriatic Fundus Camera
- 9.2.2. Non-Mydriatic Fundus Camera
- 9.1. Market Analysis, Insights and Forecast - by Application
- 10. Asia Pacific Desktop Fundus Cameras Analysis, Insights and Forecast, 2020-2032
- 10.1. Market Analysis, Insights and Forecast - by Application
- 10.1.1. Hospitals
- 10.1.2. Clinics
- 10.1.3. Others
- 10.2. Market Analysis, Insights and Forecast - by Types
- 10.2.1. Mydriatic Fundus Camera
- 10.2.2. Non-Mydriatic Fundus Camera
- 10.1. Market Analysis, Insights and Forecast - by Application
- 11. Competitive Analysis
- 11.1. Global Market Share Analysis 2025
- 11.2. Company Profiles
- 11.2.1 Topcon
- 11.2.1.1. Overview
- 11.2.1.2. Products
- 11.2.1.3. SWOT Analysis
- 11.2.1.4. Recent Developments
- 11.2.1.5. Financials (Based on Availability)
- 11.2.2 Kowa
- 11.2.2.1. Overview
- 11.2.2.2. Products
- 11.2.2.3. SWOT Analysis
- 11.2.2.4. Recent Developments
- 11.2.2.5. Financials (Based on Availability)
- 11.2.3 Canon
- 11.2.3.1. Overview
- 11.2.3.2. Products
- 11.2.3.3. SWOT Analysis
- 11.2.3.4. Recent Developments
- 11.2.3.5. Financials (Based on Availability)
- 11.2.4 Optomed Oy
- 11.2.4.1. Overview
- 11.2.4.2. Products
- 11.2.4.3. SWOT Analysis
- 11.2.4.4. Recent Developments
- 11.2.4.5. Financials (Based on Availability)
- 11.2.5 Carl Zeiss
- 11.2.5.1. Overview
- 11.2.5.2. Products
- 11.2.5.3. SWOT Analysis
- 11.2.5.4. Recent Developments
- 11.2.5.5. Financials (Based on Availability)
- 11.2.6 CENTERVUE
- 11.2.6.1. Overview
- 11.2.6.2. Products
- 11.2.6.3. SWOT Analysis
- 11.2.6.4. Recent Developments
- 11.2.6.5. Financials (Based on Availability)
- 11.2.7 Nidek
- 11.2.7.1. Overview
- 11.2.7.2. Products
- 11.2.7.3. SWOT Analysis
- 11.2.7.4. Recent Developments
- 11.2.7.5. Financials (Based on Availability)
- 11.2.8 Heidelberg
- 11.2.8.1. Overview
- 11.2.8.2. Products
- 11.2.8.3. SWOT Analysis
- 11.2.8.4. Recent Developments
- 11.2.8.5. Financials (Based on Availability)
- 11.2.9 RAYMOND
- 11.2.9.1. Overview
- 11.2.9.2. Products
- 11.2.9.3. SWOT Analysis
- 11.2.9.4. Recent Developments
- 11.2.9.5. Financials (Based on Availability)
- 11.2.10 OPTOPOL Technology
- 11.2.10.1. Overview
- 11.2.10.2. Products
- 11.2.10.3. SWOT Analysis
- 11.2.10.4. Recent Developments
- 11.2.10.5. Financials (Based on Availability)
- 11.2.11 Huvitz Korea
- 11.2.11.1. Overview
- 11.2.11.2. Products
- 11.2.11.3. SWOT Analysis
- 11.2.11.4. Recent Developments
- 11.2.11.5. Financials (Based on Availability)
- 11.2.12 Bosch Eye Care
- 11.2.12.1. Overview
- 11.2.12.2. Products
- 11.2.12.3. SWOT Analysis
- 11.2.12.4. Recent Developments
- 11.2.12.5. Financials (Based on Availability)
- 11.2.13 Volk Optical Inc
- 11.2.13.1. Overview
- 11.2.13.2. Products
- 11.2.13.3. SWOT Analysis
- 11.2.13.4. Recent Developments
- 11.2.13.5. Financials (Based on Availability)
- 11.2.14 Optos(Nikon)
- 11.2.14.1. Overview
- 11.2.14.2. Products
- 11.2.14.3. SWOT Analysis
- 11.2.14.4. Recent Developments
- 11.2.14.5. Financials (Based on Availability)
- 11.2.15 Costruzione Strumenti Oftalmici
- 11.2.15.1. Overview
- 11.2.15.2. Products
- 11.2.15.3. SWOT Analysis
- 11.2.15.4. Recent Developments
- 11.2.15.5. Financials (Based on Availability)
- 11.2.16 Optovue
- 11.2.16.1. Overview
- 11.2.16.2. Products
- 11.2.16.3. SWOT Analysis
- 11.2.16.4. Recent Developments
- 11.2.16.5. Financials (Based on Availability)
- 11.2.17 Suzhou MicroClear Medical
- 11.2.17.1. Overview
- 11.2.17.2. Products
- 11.2.17.3. SWOT Analysis
- 11.2.17.4. Recent Developments
- 11.2.17.5. Financials (Based on Availability)
- 11.2.18 MediWorks
- 11.2.18.1. Overview
- 11.2.18.2. Products
- 11.2.18.3. SWOT Analysis
- 11.2.18.4. Recent Developments
- 11.2.18.5. Financials (Based on Availability)
- 11.2.19 Canton Optics
- 11.2.19.1. Overview
- 11.2.19.2. Products
- 11.2.19.3. SWOT Analysis
- 11.2.19.4. Recent Developments
- 11.2.19.5. Financials (Based on Availability)
- 11.2.1 Topcon
List of Figures
- Figure 1: Global Desktop Fundus Cameras Revenue Breakdown (undefined, %) by Region 2025 & 2033
- Figure 2: Global Desktop Fundus Cameras Volume Breakdown (K, %) by Region 2025 & 2033
- Figure 3: North America Desktop Fundus Cameras Revenue (undefined), by Application 2025 & 2033
- Figure 4: North America Desktop Fundus Cameras Volume (K), by Application 2025 & 2033
- Figure 5: North America Desktop Fundus Cameras Revenue Share (%), by Application 2025 & 2033
- Figure 6: North America Desktop Fundus Cameras Volume Share (%), by Application 2025 & 2033
- Figure 7: North America Desktop Fundus Cameras Revenue (undefined), by Types 2025 & 2033
- Figure 8: North America Desktop Fundus Cameras Volume (K), by Types 2025 & 2033
- Figure 9: North America Desktop Fundus Cameras Revenue Share (%), by Types 2025 & 2033
- Figure 10: North America Desktop Fundus Cameras Volume Share (%), by Types 2025 & 2033
- Figure 11: North America Desktop Fundus Cameras Revenue (undefined), by Country 2025 & 2033
- Figure 12: North America Desktop Fundus Cameras Volume (K), by Country 2025 & 2033
- Figure 13: North America Desktop Fundus Cameras Revenue Share (%), by Country 2025 & 2033
- Figure 14: North America Desktop Fundus Cameras Volume Share (%), by Country 2025 & 2033
- Figure 15: South America Desktop Fundus Cameras Revenue (undefined), by Application 2025 & 2033
- Figure 16: South America Desktop Fundus Cameras Volume (K), by Application 2025 & 2033
- Figure 17: South America Desktop Fundus Cameras Revenue Share (%), by Application 2025 & 2033
- Figure 18: South America Desktop Fundus Cameras Volume Share (%), by Application 2025 & 2033
- Figure 19: South America Desktop Fundus Cameras Revenue (undefined), by Types 2025 & 2033
- Figure 20: South America Desktop Fundus Cameras Volume (K), by Types 2025 & 2033
- Figure 21: South America Desktop Fundus Cameras Revenue Share (%), by Types 2025 & 2033
- Figure 22: South America Desktop Fundus Cameras Volume Share (%), by Types 2025 & 2033
- Figure 23: South America Desktop Fundus Cameras Revenue (undefined), by Country 2025 & 2033
- Figure 24: South America Desktop Fundus Cameras Volume (K), by Country 2025 & 2033
- Figure 25: South America Desktop Fundus Cameras Revenue Share (%), by Country 2025 & 2033
- Figure 26: South America Desktop Fundus Cameras Volume Share (%), by Country 2025 & 2033
- Figure 27: Europe Desktop Fundus Cameras Revenue (undefined), by Application 2025 & 2033
- Figure 28: Europe Desktop Fundus Cameras Volume (K), by Application 2025 & 2033
- Figure 29: Europe Desktop Fundus Cameras Revenue Share (%), by Application 2025 & 2033
- Figure 30: Europe Desktop Fundus Cameras Volume Share (%), by Application 2025 & 2033
- Figure 31: Europe Desktop Fundus Cameras Revenue (undefined), by Types 2025 & 2033
- Figure 32: Europe Desktop Fundus Cameras Volume (K), by Types 2025 & 2033
- Figure 33: Europe Desktop Fundus Cameras Revenue Share (%), by Types 2025 & 2033
- Figure 34: Europe Desktop Fundus Cameras Volume Share (%), by Types 2025 & 2033
- Figure 35: Europe Desktop Fundus Cameras Revenue (undefined), by Country 2025 & 2033
- Figure 36: Europe Desktop Fundus Cameras Volume (K), by Country 2025 & 2033
- Figure 37: Europe Desktop Fundus Cameras Revenue Share (%), by Country 2025 & 2033
- Figure 38: Europe Desktop Fundus Cameras Volume Share (%), by Country 2025 & 2033
- Figure 39: Middle East & Africa Desktop Fundus Cameras Revenue (undefined), by Application 2025 & 2033
- Figure 40: Middle East & Africa Desktop Fundus Cameras Volume (K), by Application 2025 & 2033
- Figure 41: Middle East & Africa Desktop Fundus Cameras Revenue Share (%), by Application 2025 & 2033
- Figure 42: Middle East & Africa Desktop Fundus Cameras Volume Share (%), by Application 2025 & 2033
- Figure 43: Middle East & Africa Desktop Fundus Cameras Revenue (undefined), by Types 2025 & 2033
- Figure 44: Middle East & Africa Desktop Fundus Cameras Volume (K), by Types 2025 & 2033
- Figure 45: Middle East & Africa Desktop Fundus Cameras Revenue Share (%), by Types 2025 & 2033
- Figure 46: Middle East & Africa Desktop Fundus Cameras Volume Share (%), by Types 2025 & 2033
- Figure 47: Middle East & Africa Desktop Fundus Cameras Revenue (undefined), by Country 2025 & 2033
- Figure 48: Middle East & Africa Desktop Fundus Cameras Volume (K), by Country 2025 & 2033
- Figure 49: Middle East & Africa Desktop Fundus Cameras Revenue Share (%), by Country 2025 & 2033
- Figure 50: Middle East & Africa Desktop Fundus Cameras Volume Share (%), by Country 2025 & 2033
- Figure 51: Asia Pacific Desktop Fundus Cameras Revenue (undefined), by Application 2025 & 2033
- Figure 52: Asia Pacific Desktop Fundus Cameras Volume (K), by Application 2025 & 2033
- Figure 53: Asia Pacific Desktop Fundus Cameras Revenue Share (%), by Application 2025 & 2033
- Figure 54: Asia Pacific Desktop Fundus Cameras Volume Share (%), by Application 2025 & 2033
- Figure 55: Asia Pacific Desktop Fundus Cameras Revenue (undefined), by Types 2025 & 2033
- Figure 56: Asia Pacific Desktop Fundus Cameras Volume (K), by Types 2025 & 2033
- Figure 57: Asia Pacific Desktop Fundus Cameras Revenue Share (%), by Types 2025 & 2033
- Figure 58: Asia Pacific Desktop Fundus Cameras Volume Share (%), by Types 2025 & 2033
- Figure 59: Asia Pacific Desktop Fundus Cameras Revenue (undefined), by Country 2025 & 2033
- Figure 60: Asia Pacific Desktop Fundus Cameras Volume (K), by Country 2025 & 2033
- Figure 61: Asia Pacific Desktop Fundus Cameras Revenue Share (%), by Country 2025 & 2033
- Figure 62: Asia Pacific Desktop Fundus Cameras Volume Share (%), by Country 2025 & 2033
List of Tables
- Table 1: Global Desktop Fundus Cameras Revenue undefined Forecast, by Application 2020 & 2033
- Table 2: Global Desktop Fundus Cameras Volume K Forecast, by Application 2020 & 2033
- Table 3: Global Desktop Fundus Cameras Revenue undefined Forecast, by Types 2020 & 2033
- Table 4: Global Desktop Fundus Cameras Volume K Forecast, by Types 2020 & 2033
- Table 5: Global Desktop Fundus Cameras Revenue undefined Forecast, by Region 2020 & 2033
- Table 6: Global Desktop Fundus Cameras Volume K Forecast, by Region 2020 & 2033
- Table 7: Global Desktop Fundus Cameras Revenue undefined Forecast, by Application 2020 & 2033
- Table 8: Global Desktop Fundus Cameras Volume K Forecast, by Application 2020 & 2033
- Table 9: Global Desktop Fundus Cameras Revenue undefined Forecast, by Types 2020 & 2033
- Table 10: Global Desktop Fundus Cameras Volume K Forecast, by Types 2020 & 2033
- Table 11: Global Desktop Fundus Cameras Revenue undefined Forecast, by Country 2020 & 2033
- Table 12: Global Desktop Fundus Cameras Volume K Forecast, by Country 2020 & 2033
- Table 13: United States Desktop Fundus Cameras Revenue (undefined) Forecast, by Application 2020 & 2033
- Table 14: United States Desktop Fundus Cameras Volume (K) Forecast, by Application 2020 & 2033
- Table 15: Canada Desktop Fundus Cameras Revenue (undefined) Forecast, by Application 2020 & 2033
- Table 16: Canada Desktop Fundus Cameras Volume (K) Forecast, by Application 2020 & 2033
- Table 17: Mexico Desktop Fundus Cameras Revenue (undefined) Forecast, by Application 2020 & 2033
- Table 18: Mexico Desktop Fundus Cameras Volume (K) Forecast, by Application 2020 & 2033
- Table 19: Global Desktop Fundus Cameras Revenue undefined Forecast, by Application 2020 & 2033
- Table 20: Global Desktop Fundus Cameras Volume K Forecast, by Application 2020 & 2033
- Table 21: Global Desktop Fundus Cameras Revenue undefined Forecast, by Types 2020 & 2033
- Table 22: Global Desktop Fundus Cameras Volume K Forecast, by Types 2020 & 2033
- Table 23: Global Desktop Fundus Cameras Revenue undefined Forecast, by Country 2020 & 2033
- Table 24: Global Desktop Fundus Cameras Volume K Forecast, by Country 2020 & 2033
- Table 25: Brazil Desktop Fundus Cameras Revenue (undefined) Forecast, by Application 2020 & 2033
- Table 26: Brazil Desktop Fundus Cameras Volume (K) Forecast, by Application 2020 & 2033
- Table 27: Argentina Desktop Fundus Cameras Revenue (undefined) Forecast, by Application 2020 & 2033
- Table 28: Argentina Desktop Fundus Cameras Volume (K) Forecast, by Application 2020 & 2033
- Table 29: Rest of South America Desktop Fundus Cameras Revenue (undefined) Forecast, by Application 2020 & 2033
- Table 30: Rest of South America Desktop Fundus Cameras Volume (K) Forecast, by Application 2020 & 2033
- Table 31: Global Desktop Fundus Cameras Revenue undefined Forecast, by Application 2020 & 2033
- Table 32: Global Desktop Fundus Cameras Volume K Forecast, by Application 2020 & 2033
- Table 33: Global Desktop Fundus Cameras Revenue undefined Forecast, by Types 2020 & 2033
- Table 34: Global Desktop Fundus Cameras Volume K Forecast, by Types 2020 & 2033
- Table 35: Global Desktop Fundus Cameras Revenue undefined Forecast, by Country 2020 & 2033
- Table 36: Global Desktop Fundus Cameras Volume K Forecast, by Country 2020 & 2033
- Table 37: United Kingdom Desktop Fundus Cameras Revenue (undefined) Forecast, by Application 2020 & 2033
- Table 38: United Kingdom Desktop Fundus Cameras Volume (K) Forecast, by Application 2020 & 2033
- Table 39: Germany Desktop Fundus Cameras Revenue (undefined) Forecast, by Application 2020 & 2033
- Table 40: Germany Desktop Fundus Cameras Volume (K) Forecast, by Application 2020 & 2033
- Table 41: France Desktop Fundus Cameras Revenue (undefined) Forecast, by Application 2020 & 2033
- Table 42: France Desktop Fundus Cameras Volume (K) Forecast, by Application 2020 & 2033
- Table 43: Italy Desktop Fundus Cameras Revenue (undefined) Forecast, by Application 2020 & 2033
- Table 44: Italy Desktop Fundus Cameras Volume (K) Forecast, by Application 2020 & 2033
- Table 45: Spain Desktop Fundus Cameras Revenue (undefined) Forecast, by Application 2020 & 2033
- Table 46: Spain Desktop Fundus Cameras Volume (K) Forecast, by Application 2020 & 2033
- Table 47: Russia Desktop Fundus Cameras Revenue (undefined) Forecast, by Application 2020 & 2033
- Table 48: Russia Desktop Fundus Cameras Volume (K) Forecast, by Application 2020 & 2033
- Table 49: Benelux Desktop Fundus Cameras Revenue (undefined) Forecast, by Application 2020 & 2033
- Table 50: Benelux Desktop Fundus Cameras Volume (K) Forecast, by Application 2020 & 2033
- Table 51: Nordics Desktop Fundus Cameras Revenue (undefined) Forecast, by Application 2020 & 2033
- Table 52: Nordics Desktop Fundus Cameras Volume (K) Forecast, by Application 2020 & 2033
- Table 53: Rest of Europe Desktop Fundus Cameras Revenue (undefined) Forecast, by Application 2020 & 2033
- Table 54: Rest of Europe Desktop Fundus Cameras Volume (K) Forecast, by Application 2020 & 2033
- Table 55: Global Desktop Fundus Cameras Revenue undefined Forecast, by Application 2020 & 2033
- Table 56: Global Desktop Fundus Cameras Volume K Forecast, by Application 2020 & 2033
- Table 57: Global Desktop Fundus Cameras Revenue undefined Forecast, by Types 2020 & 2033
- Table 58: Global Desktop Fundus Cameras Volume K Forecast, by Types 2020 & 2033
- Table 59: Global Desktop Fundus Cameras Revenue undefined Forecast, by Country 2020 & 2033
- Table 60: Global Desktop Fundus Cameras Volume K Forecast, by Country 2020 & 2033
- Table 61: Turkey Desktop Fundus Cameras Revenue (undefined) Forecast, by Application 2020 & 2033
- Table 62: Turkey Desktop Fundus Cameras Volume (K) Forecast, by Application 2020 & 2033
- Table 63: Israel Desktop Fundus Cameras Revenue (undefined) Forecast, by Application 2020 & 2033
- Table 64: Israel Desktop Fundus Cameras Volume (K) Forecast, by Application 2020 & 2033
- Table 65: GCC Desktop Fundus Cameras Revenue (undefined) Forecast, by Application 2020 & 2033
- Table 66: GCC Desktop Fundus Cameras Volume (K) Forecast, by Application 2020 & 2033
- Table 67: North Africa Desktop Fundus Cameras Revenue (undefined) Forecast, by Application 2020 & 2033
- Table 68: North Africa Desktop Fundus Cameras Volume (K) Forecast, by Application 2020 & 2033
- Table 69: South Africa Desktop Fundus Cameras Revenue (undefined) Forecast, by Application 2020 & 2033
- Table 70: South Africa Desktop Fundus Cameras Volume (K) Forecast, by Application 2020 & 2033
- Table 71: Rest of Middle East & Africa Desktop Fundus Cameras Revenue (undefined) Forecast, by Application 2020 & 2033
- Table 72: Rest of Middle East & Africa Desktop Fundus Cameras Volume (K) Forecast, by Application 2020 & 2033
- Table 73: Global Desktop Fundus Cameras Revenue undefined Forecast, by Application 2020 & 2033
- Table 74: Global Desktop Fundus Cameras Volume K Forecast, by Application 2020 & 2033
- Table 75: Global Desktop Fundus Cameras Revenue undefined Forecast, by Types 2020 & 2033
- Table 76: Global Desktop Fundus Cameras Volume K Forecast, by Types 2020 & 2033
- Table 77: Global Desktop Fundus Cameras Revenue undefined Forecast, by Country 2020 & 2033
- Table 78: Global Desktop Fundus Cameras Volume K Forecast, by Country 2020 & 2033
- Table 79: China Desktop Fundus Cameras Revenue (undefined) Forecast, by Application 2020 & 2033
- Table 80: China Desktop Fundus Cameras Volume (K) Forecast, by Application 2020 & 2033
- Table 81: India Desktop Fundus Cameras Revenue (undefined) Forecast, by Application 2020 & 2033
- Table 82: India Desktop Fundus Cameras Volume (K) Forecast, by Application 2020 & 2033
- Table 83: Japan Desktop Fundus Cameras Revenue (undefined) Forecast, by Application 2020 & 2033
- Table 84: Japan Desktop Fundus Cameras Volume (K) Forecast, by Application 2020 & 2033
- Table 85: South Korea Desktop Fundus Cameras Revenue (undefined) Forecast, by Application 2020 & 2033
- Table 86: South Korea Desktop Fundus Cameras Volume (K) Forecast, by Application 2020 & 2033
- Table 87: ASEAN Desktop Fundus Cameras Revenue (undefined) Forecast, by Application 2020 & 2033
- Table 88: ASEAN Desktop Fundus Cameras Volume (K) Forecast, by Application 2020 & 2033
- Table 89: Oceania Desktop Fundus Cameras Revenue (undefined) Forecast, by Application 2020 & 2033
- Table 90: Oceania Desktop Fundus Cameras Volume (K) Forecast, by Application 2020 & 2033
- Table 91: Rest of Asia Pacific Desktop Fundus Cameras Revenue (undefined) Forecast, by Application 2020 & 2033
- Table 92: Rest of Asia Pacific Desktop Fundus Cameras Volume (K) Forecast, by Application 2020 & 2033
Frequently Asked Questions
1. What is the projected Compound Annual Growth Rate (CAGR) of the Desktop Fundus Cameras?
The projected CAGR is approximately 7.8%.
2. Which companies are prominent players in the Desktop Fundus Cameras?
Key companies in the market include Topcon, Kowa, Canon, Optomed Oy, Carl Zeiss, CENTERVUE, Nidek, Heidelberg, RAYMOND, OPTOPOL Technology, Huvitz Korea, Bosch Eye Care, Volk Optical Inc, Optos(Nikon), Costruzione Strumenti Oftalmici, Optovue, Suzhou MicroClear Medical, MediWorks, Canton Optics.
3. What are the main segments of the Desktop Fundus Cameras?
The market segments include Application, Types.
4. Can you provide details about the market size?
The market size is estimated to be USD XXX N/A as of 2022.
5. What are some drivers contributing to market growth?
N/A
6. What are the notable trends driving market growth?
N/A
7. Are there any restraints impacting market growth?
N/A
8. Can you provide examples of recent developments in the market?
N/A
9. What pricing options are available for accessing the report?
Pricing options include single-user, multi-user, and enterprise licenses priced at USD 3350.00, USD 5025.00, and USD 6700.00 respectively.
10. Is the market size provided in terms of value or volume?
The market size is provided in terms of value, measured in N/A and volume, measured in K.
11. Are there any specific market keywords associated with the report?
Yes, the market keyword associated with the report is "Desktop Fundus Cameras," which aids in identifying and referencing the specific market segment covered.
12. How do I determine which pricing option suits my needs best?
The pricing options vary based on user requirements and access needs. Individual users may opt for single-user licenses, while businesses requiring broader access may choose multi-user or enterprise licenses for cost-effective access to the report.
13. Are there any additional resources or data provided in the Desktop Fundus Cameras report?
While the report offers comprehensive insights, it's advisable to review the specific contents or supplementary materials provided to ascertain if additional resources or data are available.
14. How can I stay updated on further developments or reports in the Desktop Fundus Cameras?
To stay informed about further developments, trends, and reports in the Desktop Fundus Cameras, consider subscribing to industry newsletters, following relevant companies and organizations, or regularly checking reputable industry news sources and publications.
Methodology
Step 1 - Identification of Relevant Samples Size from Population Database


Step 2 - Approaches for Defining Global Market Size (Value, Volume* & Price*)

Note*: In applicable scenarios
Step 3 - Data Sources
Primary Research
- Web Analytics
- Survey Reports
- Research Institute
- Latest Research Reports
- Opinion Leaders
Secondary Research
- Annual Reports
- White Paper
- Latest Press Release
- Industry Association
- Paid Database
- Investor Presentations

Step 4 - Data Triangulation
Involves using different sources of information in order to increase the validity of a study
These sources are likely to be stakeholders in a program - participants, other researchers, program staff, other community members, and so on.
Then we put all data in single framework & apply various statistical tools to find out the dynamic on the market.
During the analysis stage, feedback from the stakeholder groups would be compared to determine areas of agreement as well as areas of divergence