

Key Insights
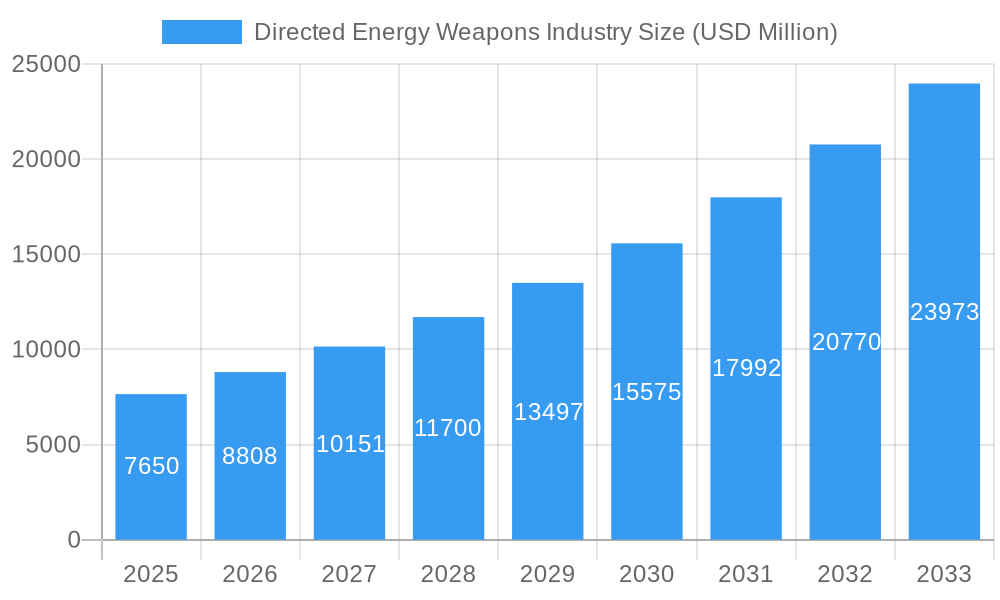
The Directed Energy Weapons (DEW) industry is poised for significant expansion, projected to reach a market size of $7.65 billion in 2025. This growth is driven by a robust compound annual growth rate (CAGR) of 14.96%, indicating a dynamic and rapidly evolving market landscape. The escalating geopolitical tensions, the increasing demand for advanced defense capabilities against emerging threats such as drones and hypersonic missiles, and substantial investments in research and development by leading defense contractors are primary catalysts for this surge. DEW systems offer unparalleled advantages in terms of precision, speed-of-light engagement, and reduced collateral damage, making them an increasingly attractive alternative to conventional weaponry for military and homeland security applications. Technological advancements in laser, microwave, and particle beam technologies are further fueling innovation and creating new market opportunities.
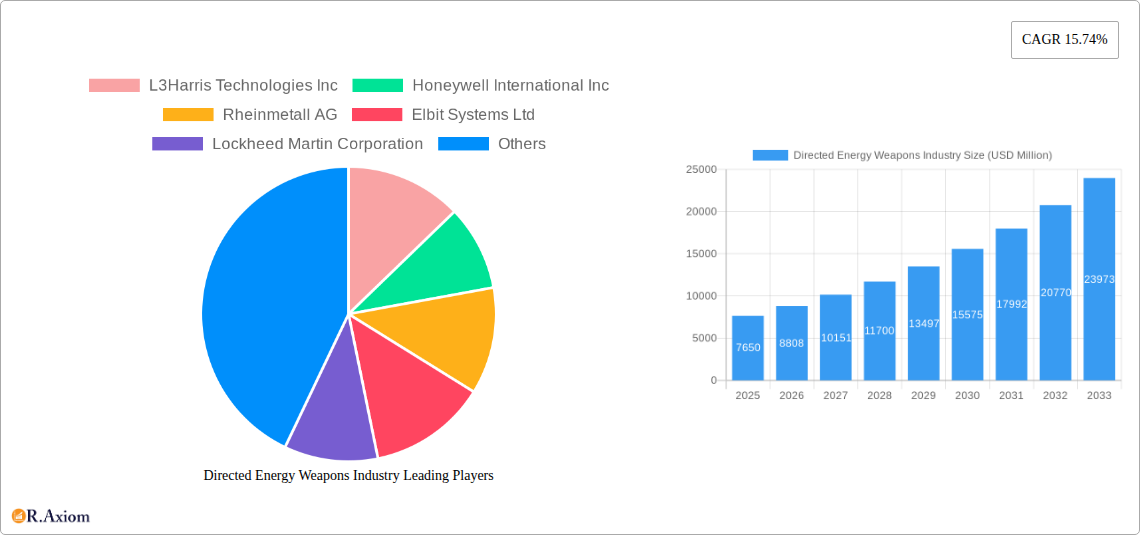
Directed Energy Weapons Industry Market Size (In Billion)
The market's trajectory is further shaped by evolving trends in modularity, miniaturization, and the integration of artificial intelligence for enhanced targeting and threat assessment. While the significant upfront investment in R&D and the complex regulatory framework surrounding the deployment of such advanced technologies present some restraints, the compelling operational benefits and the continuous pursuit of technological superiority by global powers are expected to outweigh these challenges. Key players like Lockheed Martin, RTX Corporation, and Northrop Grumman are actively investing in next-generation DEW systems, anticipating a substantial shift in defense procurement towards these sophisticated solutions. The market is segmented across production, consumption, imports, exports, and price trends, each offering unique insights into the global demand and supply dynamics of directed energy weapon systems.
Directed Energy Weapons Industry Company Market Share
Directed Energy Weapons Industry Market Concentration & Innovation
The directed energy weapons (DEW) industry is characterized by a moderate to high level of market concentration, with key players dominating advanced research, development, and production. Innovation is primarily driven by substantial government investment in defense modernization, pushing the boundaries of laser, microwave, and particle beam technologies. Regulatory frameworks, while essential for safety and international arms control, can influence development timelines and market access. Product substitutes, such as conventional kinetic weapons, remain a significant consideration, though DEWs offer distinct advantages in speed, precision, and cost-per-shot. End-user trends are leaning towards non-kinetic solutions for enhanced force protection and the neutralization of drones and electronic systems. Mergers and acquisitions (M&A) are active, with major defense contractors consolidating capabilities and acquiring specialized DEW expertise. Notable M&A activities have involved multi-billion dollar valuations, reflecting the strategic importance and future potential of this sector. Market share for leading companies, while often proprietary, is estimated to be significant, with a few entities holding a substantial portion of ongoing contracts and development programs.
Directed Energy Weapons Industry Industry Trends & Insights
The Directed Energy Weapons (DEW) industry is poised for substantial growth, fueled by an escalating global security landscape and the persistent threat of asymmetric warfare. Market penetration is increasing as military forces worldwide recognize the strategic advantages offered by DEWs, including their precision strike capabilities, near-light-speed engagement, and potential for deep magazine depth. The compound annual growth rate (CAGR) for this sector is projected to be robust, driven by continuous technological advancements and increasing adoption across various defense applications. Technological disruptions are at the forefront, with ongoing research and development focusing on enhancing power output, beam quality, range, and portability of DEW systems. This includes breakthroughs in solid-state lasers, advanced high-power microwave (HPM) emitters, and potentially directed energy particle beams. Consumer preferences, in this context referring to military end-users and defense procurement agencies, are shifting towards systems that offer cost-effectiveness, minimal collateral damage, and the ability to counter emerging threats like swarming drones and advanced electronic warfare capabilities. Competitive dynamics are intense, with established defense giants vying for dominance alongside agile, specialized DEW technology firms. The race to develop and deploy effective DEW platforms is a key feature of current global defense procurement strategies. The perceived effectiveness of DEWs in neutralizing targets with high accuracy and minimal logistical footprint is a significant market growth driver. Furthermore, the ongoing exploration of DEWs for non-military applications, such as industrial processing and medical technologies, hints at future diversification and market expansion. The integration of artificial intelligence and advanced sensor fusion with DEW systems is also a critical trend, enhancing target acquisition, tracking, and engagement effectiveness. The evolving threat environment, marked by the proliferation of sophisticated unmanned aerial systems (UAS) and electronic warfare capabilities, directly stimulates demand for DEW solutions. The industry's ability to adapt to these evolving threats and deliver reliable, field-deployable DEW systems will be paramount to its continued growth.
Dominant Markets & Segments in Directed Energy Weapons Industry
The North American region, particularly the United States, is the dominant market for directed energy weapons, driven by substantial government funding for research, development, and procurement. This dominance is evident across all key segments of the industry.
- Production Analysis: The US leads in the production of advanced DEW systems, with companies investing heavily in manufacturing capabilities and supply chain development. This includes the production of high-energy lasers and high-power microwave systems for various military platforms.
- Consumption Analysis: The US military is the largest consumer of DEWs, deploying them on naval vessels, ground vehicles, and aircraft for air and missile defense, counter-drone operations, and electronic warfare. The demand is driven by a need to counter evolving threats and maintain technological superiority.
- Import Market Analysis (Value & Volume): While the US is a primary producer, some specialized components or niche DEW technologies may be imported, though overall import values are likely overshadowed by domestic production and export figures. The focus is on indigenous development and manufacturing.
- Export Market Analysis (Value & Volume): The US is also a significant exporter of DEW technology and systems to allied nations. The value of these exports is substantial, reflecting the advanced capabilities and strategic importance of these weapons. Allies are increasingly seeking to procure DEW systems to enhance their own defense capabilities.
- Price Trend Analysis: Prices for DEW systems are historically high due to the cutting-edge nature of the technology and the specialized components involved. However, as production scales up and technologies mature, a trend towards cost reduction is anticipated, making them more accessible for broader deployment. Factors influencing price include system complexity, power output, and platform integration.
Key drivers for US dominance include robust defense budgets, a strong ecosystem of research institutions and private sector innovation, and a clear strategic imperative to maintain a technological edge. Economic policies that support defense industrial bases and R&D tax incentives further bolster this leadership. Infrastructure supporting advanced manufacturing and testing facilities plays a crucial role in sustaining production capabilities.
Directed Energy Weapons Industry Product Developments
Product innovation in the directed energy weapons industry is rapidly advancing. Developments are focused on enhancing power, efficiency, and portability of laser and microwave systems. Key applications include counter-unmanned aerial systems (C-UAS), missile defense, and electronic warfare. Competitive advantages stem from the ability to neutralize threats with speed, precision, and a virtually unlimited magazine depth, offering significant cost-per-shot benefits over traditional ordnance. Technological trends are pushing towards solid-state lasers with improved beam quality and HPM systems capable of disrupting enemy electronics with minimal collateral damage.
Directed Energy Weapons Industry Report Scope & Segmentation Analysis
This report provides a comprehensive analysis of the Directed Energy Weapons Industry, segmented by Production Analysis, Consumption Analysis, Import Market Analysis (Value & Volume), Export Market Analysis (Value & Volume), and Price Trend Analysis. Each segment is examined to provide insights into market sizes, growth projections, and competitive dynamics. Production analysis will delve into the manufacturing landscape and technological advancements. Consumption analysis will focus on end-user demand and deployment strategies. Import and export analyses will detail international trade flows and market penetration. Price trend analysis will track the evolution of DEW system costs.
Key Drivers of Directed Energy Weapons Industry Growth
The growth of the directed energy weapons industry is primarily driven by escalating global security threats, particularly the proliferation of unmanned aerial systems (UAS) and advanced electronic warfare capabilities. Increased defense modernization budgets worldwide are also a significant catalyst, with nations investing in next-generation weaponry. Technological advancements in laser and microwave technologies, leading to more powerful, efficient, and portable systems, are crucial enablers. Furthermore, the pursuit of cost-effective defense solutions, where DEWs offer a lower cost-per-shot compared to traditional munitions, fuels adoption. Government investment in research and development, coupled with favorable regulatory environments for defense innovation, further supports market expansion.
Challenges in the Directed Energy Weapons Industry Sector
Despite its promising growth, the directed energy weapons industry faces several challenges. High research and development costs and the lengthy timelines for system maturation are significant barriers. Regulatory hurdles, including export controls and the need for international agreements on the use of directed energy weapons, can slow down market adoption. Supply chain complexities for specialized components and the need for robust infrastructure to support deployment and maintenance also present challenges. Intense competition among established defense contractors and emerging technology firms can lead to pricing pressures and the need for continuous innovation to maintain market share.
Emerging Opportunities in Directed Energy Weapons Industry
Emerging opportunities in the directed energy weapons industry are abundant, driven by both defense and potential non-military applications. The rapidly evolving threat landscape, especially the pervasive use of drones, creates a sustained demand for advanced counter-drone DEW systems. Developments in miniaturization and increased power efficiency are opening avenues for integration onto smaller platforms like ground vehicles and potentially even individual soldier equipment. Beyond traditional military uses, there is growing interest in DEW applications for industrial processes, such as material cutting and welding, and in the medical field for targeted therapies. The expansion into new geographical markets seeking to upgrade their defense capabilities also represents a significant growth opportunity.
Leading Players in the Directed Energy Weapons Industry Market
- L3Harris Technologies Inc
- Honeywell International Inc
- Rheinmetall AG
- Elbit Systems Ltd
- Lockheed Martin Corporation
- MBDA
- Rafael Advanced Defense Systems Ltd
- RTX Corporation
- QinetiQ Group
- BAE Systems plc
- Northrop Grumman Corporation
- The Boeing Company
Key Developments in Directed Energy Weapons Industry Industry
- May 2022: Rheinmetall announced that it had successfully tested the laser weapon technology demonstrator version built on behalf of the German Bundeswehr forces.
- July 2021: The US Navy and Air Force Research Laboratory (AFRL) collaborated on a five-year development project to develop high-power microwave technology. It is capable of knocking out adversary electronics.
Strategic Outlook for Directed Energy Weapons Industry Market
The strategic outlook for the directed energy weapons industry is overwhelmingly positive, characterized by sustained growth and increasing strategic importance. The ongoing evolution of global security threats, particularly in the domain of unmanned aerial systems and electronic warfare, ensures a continuous demand for advanced DEW solutions. Significant investment in research and development by leading defense organizations will continue to drive technological breakthroughs, leading to more capable and versatile systems. As these technologies mature and economies of scale are achieved, cost efficiencies will emerge, further accelerating market penetration. The industry is well-positioned to capitalize on the global trend towards non-kinetic defense solutions, offering a compelling alternative or complement to traditional weaponry.
Directed Energy Weapons Industry Segmentation
- 1. Production Analysis
- 2. Consumption Analysis
- 3. Import Market Analysis (Value & Volume)
- 4. Export Market Analysis (Value & Volume)
- 5. Price Trend Analysis
Directed Energy Weapons Industry Segmentation By Geography
-
1. North America
- 1.1. United States
- 1.2. Canada
- 1.3. Mexico
-
2. South America
- 2.1. Brazil
- 2.2. Argentina
- 2.3. Rest of South America
-
3. Europe
- 3.1. United Kingdom
- 3.2. Germany
- 3.3. France
- 3.4. Italy
- 3.5. Spain
- 3.6. Russia
- 3.7. Benelux
- 3.8. Nordics
- 3.9. Rest of Europe
-
4. Middle East & Africa
- 4.1. Turkey
- 4.2. Israel
- 4.3. GCC
- 4.4. North Africa
- 4.5. South Africa
- 4.6. Rest of Middle East & Africa
-
5. Asia Pacific
- 5.1. China
- 5.2. India
- 5.3. Japan
- 5.4. South Korea
- 5.5. ASEAN
- 5.6. Oceania
- 5.7. Rest of Asia Pacific
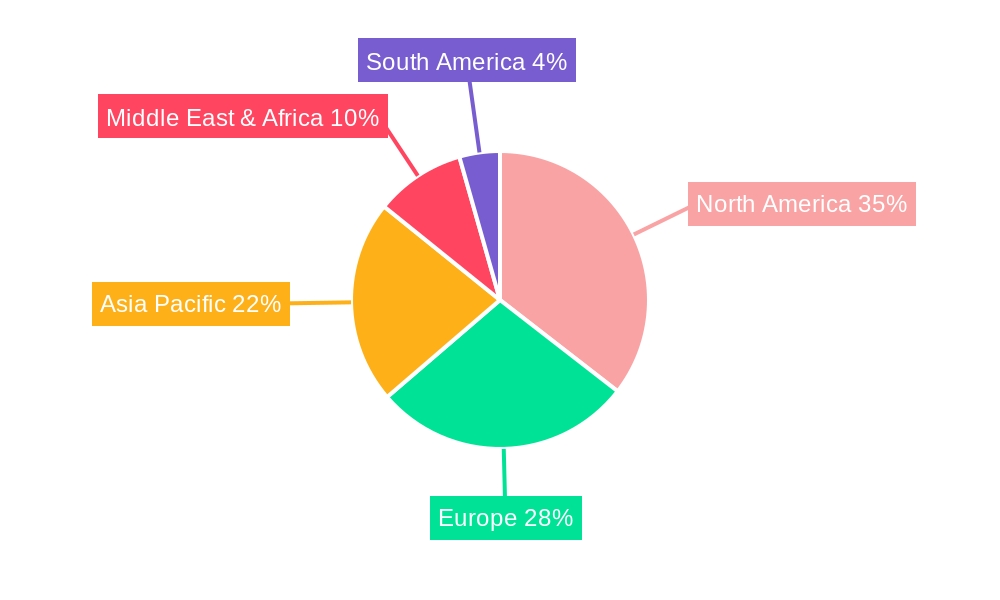
Directed Energy Weapons Industry Regional Market Share
Geographic Coverage of Directed Energy Weapons Industry
Directed Energy Weapons Industry REPORT HIGHLIGHTS
| Aspects | Details |
|---|---|
| Study Period | 2020-2034 |
| Base Year | 2025 |
| Estimated Year | 2026 |
| Forecast Period | 2026-2034 |
| Historical Period | 2020-2025 |
| Growth Rate | CAGR of 14.96% from 2020-2034 |
| Segmentation |
|
Table of Contents
- 1. Introduction
- 1.1. Research Scope
- 1.2. Market Segmentation
- 1.3. Research Objective
- 1.4. Definitions and Assumptions
- 2. Executive Summary
- 2.1. Market Snapshot
- 3. Market Dynamics
- 3.1. Market Drivers
- 3.2. Market Restrains
- 3.3. Market Trends
- 3.4. Market Opportunities
- 4. Market Factor Analysis
- 4.1. Porters Five Forces
- 4.1.1. Bargaining Power of Suppliers
- 4.1.2. Bargaining Power of Buyers
- 4.1.3. Threat of New Entrants
- 4.1.4. Threat of Substitutes
- 4.1.5. Competitive Rivalry
- 4.2. PESTEL analysis
- 4.3. BCG Analysis
- 4.3.1. Stars (High Growth, High Market Share)
- 4.3.2. Cash Cows (Low Growth, High Market Share)
- 4.3.3. Question Mark (High Growth, Low Market Share)
- 4.3.4. Dogs (Low Growth, Low Market Share)
- 4.4. Ansoff Matrix Analysis
- 4.5. Supply Chain Analysis
- 4.6. Regulatory Landscape
- 4.7. Current Market Potential and Opportunity Assessment (TAM–SAM–SOM Framework)
- 4.8. RAX Analyst Note
- 4.1. Porters Five Forces
- 5. Market Analysis, Insights and Forecast 2021-2033
- 5.1. Market Analysis, Insights and Forecast - by Production Analysis
- 5.2. Market Analysis, Insights and Forecast - by Consumption Analysis
- 5.3. Market Analysis, Insights and Forecast - by Import Market Analysis (Value & Volume)
- 5.4. Market Analysis, Insights and Forecast - by Export Market Analysis (Value & Volume)
- 5.5. Market Analysis, Insights and Forecast - by Price Trend Analysis
- 5.6. Market Analysis, Insights and Forecast - by Region
- 5.6.1. North America
- 5.6.2. South America
- 5.6.3. Europe
- 5.6.4. Middle East & Africa
- 5.6.5. Asia Pacific
- 6. Global Directed Energy Weapons Industry Analysis, Insights and Forecast, 2021-2033
- 6.1. Market Analysis, Insights and Forecast - by Production Analysis
- 6.2. Market Analysis, Insights and Forecast - by Consumption Analysis
- 6.3. Market Analysis, Insights and Forecast - by Import Market Analysis (Value & Volume)
- 6.4. Market Analysis, Insights and Forecast - by Export Market Analysis (Value & Volume)
- 6.5. Market Analysis, Insights and Forecast - by Price Trend Analysis
- 7. North America Directed Energy Weapons Industry Analysis, Insights and Forecast, 2020-2032
- 7.1. Market Analysis, Insights and Forecast - by Production Analysis
- 7.2. Market Analysis, Insights and Forecast - by Consumption Analysis
- 7.3. Market Analysis, Insights and Forecast - by Import Market Analysis (Value & Volume)
- 7.4. Market Analysis, Insights and Forecast - by Export Market Analysis (Value & Volume)
- 7.5. Market Analysis, Insights and Forecast - by Price Trend Analysis
- 8. South America Directed Energy Weapons Industry Analysis, Insights and Forecast, 2020-2032
- 8.1. Market Analysis, Insights and Forecast - by Production Analysis
- 8.2. Market Analysis, Insights and Forecast - by Consumption Analysis
- 8.3. Market Analysis, Insights and Forecast - by Import Market Analysis (Value & Volume)
- 8.4. Market Analysis, Insights and Forecast - by Export Market Analysis (Value & Volume)
- 8.5. Market Analysis, Insights and Forecast - by Price Trend Analysis
- 9. Europe Directed Energy Weapons Industry Analysis, Insights and Forecast, 2020-2032
- 9.1. Market Analysis, Insights and Forecast - by Production Analysis
- 9.2. Market Analysis, Insights and Forecast - by Consumption Analysis
- 9.3. Market Analysis, Insights and Forecast - by Import Market Analysis (Value & Volume)
- 9.4. Market Analysis, Insights and Forecast - by Export Market Analysis (Value & Volume)
- 9.5. Market Analysis, Insights and Forecast - by Price Trend Analysis
- 10. Middle East & Africa Directed Energy Weapons Industry Analysis, Insights and Forecast, 2020-2032
- 10.1. Market Analysis, Insights and Forecast - by Production Analysis
- 10.2. Market Analysis, Insights and Forecast - by Consumption Analysis
- 10.3. Market Analysis, Insights and Forecast - by Import Market Analysis (Value & Volume)
- 10.4. Market Analysis, Insights and Forecast - by Export Market Analysis (Value & Volume)
- 10.5. Market Analysis, Insights and Forecast - by Price Trend Analysis
- 11. Asia Pacific Directed Energy Weapons Industry Analysis, Insights and Forecast, 2020-2032
- 11.1. Market Analysis, Insights and Forecast - by Production Analysis
- 11.2. Market Analysis, Insights and Forecast - by Consumption Analysis
- 11.3. Market Analysis, Insights and Forecast - by Import Market Analysis (Value & Volume)
- 11.4. Market Analysis, Insights and Forecast - by Export Market Analysis (Value & Volume)
- 11.5. Market Analysis, Insights and Forecast - by Price Trend Analysis
- 12. Competitive Analysis
- 12.1. Company Profiles
- 12.1.1 L3Harris Technologies Inc
- 12.1.1.1. Company Overview
- 12.1.1.2. Products
- 12.1.1.3. Company Financials
- 12.1.1.4. SWOT Analysis
- 12.1.2 Honeywell International Inc
- 12.1.2.1. Company Overview
- 12.1.2.2. Products
- 12.1.2.3. Company Financials
- 12.1.2.4. SWOT Analysis
- 12.1.3 Rheinmetall AG
- 12.1.3.1. Company Overview
- 12.1.3.2. Products
- 12.1.3.3. Company Financials
- 12.1.3.4. SWOT Analysis
- 12.1.4 Elbit Systems Ltd
- 12.1.4.1. Company Overview
- 12.1.4.2. Products
- 12.1.4.3. Company Financials
- 12.1.4.4. SWOT Analysis
- 12.1.5 Lockheed Martin Corporation
- 12.1.5.1. Company Overview
- 12.1.5.2. Products
- 12.1.5.3. Company Financials
- 12.1.5.4. SWOT Analysis
- 12.1.6 MBDA
- 12.1.6.1. Company Overview
- 12.1.6.2. Products
- 12.1.6.3. Company Financials
- 12.1.6.4. SWOT Analysis
- 12.1.7 Rafael Advanced Defense Systems Ltd
- 12.1.7.1. Company Overview
- 12.1.7.2. Products
- 12.1.7.3. Company Financials
- 12.1.7.4. SWOT Analysis
- 12.1.8 RTX Corporation
- 12.1.8.1. Company Overview
- 12.1.8.2. Products
- 12.1.8.3. Company Financials
- 12.1.8.4. SWOT Analysis
- 12.1.9 QinetiQ Grou
- 12.1.9.1. Company Overview
- 12.1.9.2. Products
- 12.1.9.3. Company Financials
- 12.1.9.4. SWOT Analysis
- 12.1.10 BAE Systems plc
- 12.1.10.1. Company Overview
- 12.1.10.2. Products
- 12.1.10.3. Company Financials
- 12.1.10.4. SWOT Analysis
- 12.1.11 Northrop Grumman Corporation
- 12.1.11.1. Company Overview
- 12.1.11.2. Products
- 12.1.11.3. Company Financials
- 12.1.11.4. SWOT Analysis
- 12.1.12 The Boeing Company
- 12.1.12.1. Company Overview
- 12.1.12.2. Products
- 12.1.12.3. Company Financials
- 12.1.12.4. SWOT Analysis
- 12.1.1 L3Harris Technologies Inc
- 12.2. Market Entropy
- 12.2.1 Company's Key Areas Served
- 12.2.2 Recent Developments
- 12.3. Company Market Share Analysis 2025
- 12.3.1 Top 5 Companies Market Share Analysis
- 12.3.2 Top 3 Companies Market Share Analysis
- 12.4. List of Potential Customers
- 13. Research Methodology
List of Figures
- Figure 1: Global Directed Energy Weapons Industry Revenue Breakdown (undefined, %) by Region 2025 & 2033
- Figure 2: North America Directed Energy Weapons Industry Revenue (undefined), by Production Analysis 2025 & 2033
- Figure 3: North America Directed Energy Weapons Industry Revenue Share (%), by Production Analysis 2025 & 2033
- Figure 4: North America Directed Energy Weapons Industry Revenue (undefined), by Consumption Analysis 2025 & 2033
- Figure 5: North America Directed Energy Weapons Industry Revenue Share (%), by Consumption Analysis 2025 & 2033
- Figure 6: North America Directed Energy Weapons Industry Revenue (undefined), by Import Market Analysis (Value & Volume) 2025 & 2033
- Figure 7: North America Directed Energy Weapons Industry Revenue Share (%), by Import Market Analysis (Value & Volume) 2025 & 2033
- Figure 8: North America Directed Energy Weapons Industry Revenue (undefined), by Export Market Analysis (Value & Volume) 2025 & 2033
- Figure 9: North America Directed Energy Weapons Industry Revenue Share (%), by Export Market Analysis (Value & Volume) 2025 & 2033
- Figure 10: North America Directed Energy Weapons Industry Revenue (undefined), by Price Trend Analysis 2025 & 2033
- Figure 11: North America Directed Energy Weapons Industry Revenue Share (%), by Price Trend Analysis 2025 & 2033
- Figure 12: North America Directed Energy Weapons Industry Revenue (undefined), by Country 2025 & 2033
- Figure 13: North America Directed Energy Weapons Industry Revenue Share (%), by Country 2025 & 2033
- Figure 14: South America Directed Energy Weapons Industry Revenue (undefined), by Production Analysis 2025 & 2033
- Figure 15: South America Directed Energy Weapons Industry Revenue Share (%), by Production Analysis 2025 & 2033
- Figure 16: South America Directed Energy Weapons Industry Revenue (undefined), by Consumption Analysis 2025 & 2033
- Figure 17: South America Directed Energy Weapons Industry Revenue Share (%), by Consumption Analysis 2025 & 2033
- Figure 18: South America Directed Energy Weapons Industry Revenue (undefined), by Import Market Analysis (Value & Volume) 2025 & 2033
- Figure 19: South America Directed Energy Weapons Industry Revenue Share (%), by Import Market Analysis (Value & Volume) 2025 & 2033
- Figure 20: South America Directed Energy Weapons Industry Revenue (undefined), by Export Market Analysis (Value & Volume) 2025 & 2033
- Figure 21: South America Directed Energy Weapons Industry Revenue Share (%), by Export Market Analysis (Value & Volume) 2025 & 2033
- Figure 22: South America Directed Energy Weapons Industry Revenue (undefined), by Price Trend Analysis 2025 & 2033
- Figure 23: South America Directed Energy Weapons Industry Revenue Share (%), by Price Trend Analysis 2025 & 2033
- Figure 24: South America Directed Energy Weapons Industry Revenue (undefined), by Country 2025 & 2033
- Figure 25: South America Directed Energy Weapons Industry Revenue Share (%), by Country 2025 & 2033
- Figure 26: Europe Directed Energy Weapons Industry Revenue (undefined), by Production Analysis 2025 & 2033
- Figure 27: Europe Directed Energy Weapons Industry Revenue Share (%), by Production Analysis 2025 & 2033
- Figure 28: Europe Directed Energy Weapons Industry Revenue (undefined), by Consumption Analysis 2025 & 2033
- Figure 29: Europe Directed Energy Weapons Industry Revenue Share (%), by Consumption Analysis 2025 & 2033
- Figure 30: Europe Directed Energy Weapons Industry Revenue (undefined), by Import Market Analysis (Value & Volume) 2025 & 2033
- Figure 31: Europe Directed Energy Weapons Industry Revenue Share (%), by Import Market Analysis (Value & Volume) 2025 & 2033
- Figure 32: Europe Directed Energy Weapons Industry Revenue (undefined), by Export Market Analysis (Value & Volume) 2025 & 2033
- Figure 33: Europe Directed Energy Weapons Industry Revenue Share (%), by Export Market Analysis (Value & Volume) 2025 & 2033
- Figure 34: Europe Directed Energy Weapons Industry Revenue (undefined), by Price Trend Analysis 2025 & 2033
- Figure 35: Europe Directed Energy Weapons Industry Revenue Share (%), by Price Trend Analysis 2025 & 2033
- Figure 36: Europe Directed Energy Weapons Industry Revenue (undefined), by Country 2025 & 2033
- Figure 37: Europe Directed Energy Weapons Industry Revenue Share (%), by Country 2025 & 2033
- Figure 38: Middle East & Africa Directed Energy Weapons Industry Revenue (undefined), by Production Analysis 2025 & 2033
- Figure 39: Middle East & Africa Directed Energy Weapons Industry Revenue Share (%), by Production Analysis 2025 & 2033
- Figure 40: Middle East & Africa Directed Energy Weapons Industry Revenue (undefined), by Consumption Analysis 2025 & 2033
- Figure 41: Middle East & Africa Directed Energy Weapons Industry Revenue Share (%), by Consumption Analysis 2025 & 2033
- Figure 42: Middle East & Africa Directed Energy Weapons Industry Revenue (undefined), by Import Market Analysis (Value & Volume) 2025 & 2033
- Figure 43: Middle East & Africa Directed Energy Weapons Industry Revenue Share (%), by Import Market Analysis (Value & Volume) 2025 & 2033
- Figure 44: Middle East & Africa Directed Energy Weapons Industry Revenue (undefined), by Export Market Analysis (Value & Volume) 2025 & 2033
- Figure 45: Middle East & Africa Directed Energy Weapons Industry Revenue Share (%), by Export Market Analysis (Value & Volume) 2025 & 2033
- Figure 46: Middle East & Africa Directed Energy Weapons Industry Revenue (undefined), by Price Trend Analysis 2025 & 2033
- Figure 47: Middle East & Africa Directed Energy Weapons Industry Revenue Share (%), by Price Trend Analysis 2025 & 2033
- Figure 48: Middle East & Africa Directed Energy Weapons Industry Revenue (undefined), by Country 2025 & 2033
- Figure 49: Middle East & Africa Directed Energy Weapons Industry Revenue Share (%), by Country 2025 & 2033
- Figure 50: Asia Pacific Directed Energy Weapons Industry Revenue (undefined), by Production Analysis 2025 & 2033
- Figure 51: Asia Pacific Directed Energy Weapons Industry Revenue Share (%), by Production Analysis 2025 & 2033
- Figure 52: Asia Pacific Directed Energy Weapons Industry Revenue (undefined), by Consumption Analysis 2025 & 2033
- Figure 53: Asia Pacific Directed Energy Weapons Industry Revenue Share (%), by Consumption Analysis 2025 & 2033
- Figure 54: Asia Pacific Directed Energy Weapons Industry Revenue (undefined), by Import Market Analysis (Value & Volume) 2025 & 2033
- Figure 55: Asia Pacific Directed Energy Weapons Industry Revenue Share (%), by Import Market Analysis (Value & Volume) 2025 & 2033
- Figure 56: Asia Pacific Directed Energy Weapons Industry Revenue (undefined), by Export Market Analysis (Value & Volume) 2025 & 2033
- Figure 57: Asia Pacific Directed Energy Weapons Industry Revenue Share (%), by Export Market Analysis (Value & Volume) 2025 & 2033
- Figure 58: Asia Pacific Directed Energy Weapons Industry Revenue (undefined), by Price Trend Analysis 2025 & 2033
- Figure 59: Asia Pacific Directed Energy Weapons Industry Revenue Share (%), by Price Trend Analysis 2025 & 2033
- Figure 60: Asia Pacific Directed Energy Weapons Industry Revenue (undefined), by Country 2025 & 2033
- Figure 61: Asia Pacific Directed Energy Weapons Industry Revenue Share (%), by Country 2025 & 2033
List of Tables
- Table 1: Global Directed Energy Weapons Industry Revenue undefined Forecast, by Production Analysis 2020 & 2033
- Table 2: Global Directed Energy Weapons Industry Revenue undefined Forecast, by Consumption Analysis 2020 & 2033
- Table 3: Global Directed Energy Weapons Industry Revenue undefined Forecast, by Import Market Analysis (Value & Volume) 2020 & 2033
- Table 4: Global Directed Energy Weapons Industry Revenue undefined Forecast, by Export Market Analysis (Value & Volume) 2020 & 2033
- Table 5: Global Directed Energy Weapons Industry Revenue undefined Forecast, by Price Trend Analysis 2020 & 2033
- Table 6: Global Directed Energy Weapons Industry Revenue undefined Forecast, by Region 2020 & 2033
- Table 7: Global Directed Energy Weapons Industry Revenue undefined Forecast, by Production Analysis 2020 & 2033
- Table 8: Global Directed Energy Weapons Industry Revenue undefined Forecast, by Consumption Analysis 2020 & 2033
- Table 9: Global Directed Energy Weapons Industry Revenue undefined Forecast, by Import Market Analysis (Value & Volume) 2020 & 2033
- Table 10: Global Directed Energy Weapons Industry Revenue undefined Forecast, by Export Market Analysis (Value & Volume) 2020 & 2033
- Table 11: Global Directed Energy Weapons Industry Revenue undefined Forecast, by Price Trend Analysis 2020 & 2033
- Table 12: Global Directed Energy Weapons Industry Revenue undefined Forecast, by Country 2020 & 2033
- Table 13: United States Directed Energy Weapons Industry Revenue (undefined) Forecast, by Application 2020 & 2033
- Table 14: Canada Directed Energy Weapons Industry Revenue (undefined) Forecast, by Application 2020 & 2033
- Table 15: Mexico Directed Energy Weapons Industry Revenue (undefined) Forecast, by Application 2020 & 2033
- Table 16: Global Directed Energy Weapons Industry Revenue undefined Forecast, by Production Analysis 2020 & 2033
- Table 17: Global Directed Energy Weapons Industry Revenue undefined Forecast, by Consumption Analysis 2020 & 2033
- Table 18: Global Directed Energy Weapons Industry Revenue undefined Forecast, by Import Market Analysis (Value & Volume) 2020 & 2033
- Table 19: Global Directed Energy Weapons Industry Revenue undefined Forecast, by Export Market Analysis (Value & Volume) 2020 & 2033
- Table 20: Global Directed Energy Weapons Industry Revenue undefined Forecast, by Price Trend Analysis 2020 & 2033
- Table 21: Global Directed Energy Weapons Industry Revenue undefined Forecast, by Country 2020 & 2033
- Table 22: Brazil Directed Energy Weapons Industry Revenue (undefined) Forecast, by Application 2020 & 2033
- Table 23: Argentina Directed Energy Weapons Industry Revenue (undefined) Forecast, by Application 2020 & 2033
- Table 24: Rest of South America Directed Energy Weapons Industry Revenue (undefined) Forecast, by Application 2020 & 2033
- Table 25: Global Directed Energy Weapons Industry Revenue undefined Forecast, by Production Analysis 2020 & 2033
- Table 26: Global Directed Energy Weapons Industry Revenue undefined Forecast, by Consumption Analysis 2020 & 2033
- Table 27: Global Directed Energy Weapons Industry Revenue undefined Forecast, by Import Market Analysis (Value & Volume) 2020 & 2033
- Table 28: Global Directed Energy Weapons Industry Revenue undefined Forecast, by Export Market Analysis (Value & Volume) 2020 & 2033
- Table 29: Global Directed Energy Weapons Industry Revenue undefined Forecast, by Price Trend Analysis 2020 & 2033
- Table 30: Global Directed Energy Weapons Industry Revenue undefined Forecast, by Country 2020 & 2033
- Table 31: United Kingdom Directed Energy Weapons Industry Revenue (undefined) Forecast, by Application 2020 & 2033
- Table 32: Germany Directed Energy Weapons Industry Revenue (undefined) Forecast, by Application 2020 & 2033
- Table 33: France Directed Energy Weapons Industry Revenue (undefined) Forecast, by Application 2020 & 2033
- Table 34: Italy Directed Energy Weapons Industry Revenue (undefined) Forecast, by Application 2020 & 2033
- Table 35: Spain Directed Energy Weapons Industry Revenue (undefined) Forecast, by Application 2020 & 2033
- Table 36: Russia Directed Energy Weapons Industry Revenue (undefined) Forecast, by Application 2020 & 2033
- Table 37: Benelux Directed Energy Weapons Industry Revenue (undefined) Forecast, by Application 2020 & 2033
- Table 38: Nordics Directed Energy Weapons Industry Revenue (undefined) Forecast, by Application 2020 & 2033
- Table 39: Rest of Europe Directed Energy Weapons Industry Revenue (undefined) Forecast, by Application 2020 & 2033
- Table 40: Global Directed Energy Weapons Industry Revenue undefined Forecast, by Production Analysis 2020 & 2033
- Table 41: Global Directed Energy Weapons Industry Revenue undefined Forecast, by Consumption Analysis 2020 & 2033
- Table 42: Global Directed Energy Weapons Industry Revenue undefined Forecast, by Import Market Analysis (Value & Volume) 2020 & 2033
- Table 43: Global Directed Energy Weapons Industry Revenue undefined Forecast, by Export Market Analysis (Value & Volume) 2020 & 2033
- Table 44: Global Directed Energy Weapons Industry Revenue undefined Forecast, by Price Trend Analysis 2020 & 2033
- Table 45: Global Directed Energy Weapons Industry Revenue undefined Forecast, by Country 2020 & 2033
- Table 46: Turkey Directed Energy Weapons Industry Revenue (undefined) Forecast, by Application 2020 & 2033
- Table 47: Israel Directed Energy Weapons Industry Revenue (undefined) Forecast, by Application 2020 & 2033
- Table 48: GCC Directed Energy Weapons Industry Revenue (undefined) Forecast, by Application 2020 & 2033
- Table 49: North Africa Directed Energy Weapons Industry Revenue (undefined) Forecast, by Application 2020 & 2033
- Table 50: South Africa Directed Energy Weapons Industry Revenue (undefined) Forecast, by Application 2020 & 2033
- Table 51: Rest of Middle East & Africa Directed Energy Weapons Industry Revenue (undefined) Forecast, by Application 2020 & 2033
- Table 52: Global Directed Energy Weapons Industry Revenue undefined Forecast, by Production Analysis 2020 & 2033
- Table 53: Global Directed Energy Weapons Industry Revenue undefined Forecast, by Consumption Analysis 2020 & 2033
- Table 54: Global Directed Energy Weapons Industry Revenue undefined Forecast, by Import Market Analysis (Value & Volume) 2020 & 2033
- Table 55: Global Directed Energy Weapons Industry Revenue undefined Forecast, by Export Market Analysis (Value & Volume) 2020 & 2033
- Table 56: Global Directed Energy Weapons Industry Revenue undefined Forecast, by Price Trend Analysis 2020 & 2033
- Table 57: Global Directed Energy Weapons Industry Revenue undefined Forecast, by Country 2020 & 2033
- Table 58: China Directed Energy Weapons Industry Revenue (undefined) Forecast, by Application 2020 & 2033
- Table 59: India Directed Energy Weapons Industry Revenue (undefined) Forecast, by Application 2020 & 2033
- Table 60: Japan Directed Energy Weapons Industry Revenue (undefined) Forecast, by Application 2020 & 2033
- Table 61: South Korea Directed Energy Weapons Industry Revenue (undefined) Forecast, by Application 2020 & 2033
- Table 62: ASEAN Directed Energy Weapons Industry Revenue (undefined) Forecast, by Application 2020 & 2033
- Table 63: Oceania Directed Energy Weapons Industry Revenue (undefined) Forecast, by Application 2020 & 2033
- Table 64: Rest of Asia Pacific Directed Energy Weapons Industry Revenue (undefined) Forecast, by Application 2020 & 2033
Frequently Asked Questions
1. What is the projected Compound Annual Growth Rate (CAGR) of the Directed Energy Weapons Industry?
The projected CAGR is approximately 14.96%.
2. Which companies are prominent players in the Directed Energy Weapons Industry?
Key companies in the market include L3Harris Technologies Inc, Honeywell International Inc, Rheinmetall AG, Elbit Systems Ltd, Lockheed Martin Corporation, MBDA, Rafael Advanced Defense Systems Ltd, RTX Corporation, QinetiQ Grou, BAE Systems plc, Northrop Grumman Corporation, The Boeing Company.
3. What are the main segments of the Directed Energy Weapons Industry?
The market segments include Production Analysis, Consumption Analysis, Import Market Analysis (Value & Volume), Export Market Analysis (Value & Volume), Price Trend Analysis.
4. Can you provide details about the market size?
The market size is estimated to be USD XXX N/A as of 2022.
5. What are some drivers contributing to market growth?
Increase in Internet of Things (IoT) and Autonomous Systems; Rise in Demand for Military and Defense Satellite Communication Solutions.
6. What are the notable trends driving market growth?
Sea Segment Expected to WItness Rapid Growth.
7. Are there any restraints impacting market growth?
Cybersecurity Threats to Satellite Communication; Interference in Transmission of Data.
8. Can you provide examples of recent developments in the market?
May 2022: Rheinmetall announced that it had successfully tested the laser weapon technology demonstrator version built on behalf of the German Bundeswehr forces.
9. What pricing options are available for accessing the report?
Pricing options include single-user, multi-user, and enterprise licenses priced at USD 4750, USD 5250, and USD 8750 respectively.
10. Is the market size provided in terms of value or volume?
The market size is provided in terms of value, measured in N/A.
11. Are there any specific market keywords associated with the report?
Yes, the market keyword associated with the report is "Directed Energy Weapons Industry," which aids in identifying and referencing the specific market segment covered.
12. How do I determine which pricing option suits my needs best?
The pricing options vary based on user requirements and access needs. Individual users may opt for single-user licenses, while businesses requiring broader access may choose multi-user or enterprise licenses for cost-effective access to the report.
13. Are there any additional resources or data provided in the Directed Energy Weapons Industry report?
While the report offers comprehensive insights, it's advisable to review the specific contents or supplementary materials provided to ascertain if additional resources or data are available.
14. How can I stay updated on further developments or reports in the Directed Energy Weapons Industry?
To stay informed about further developments, trends, and reports in the Directed Energy Weapons Industry, consider subscribing to industry newsletters, following relevant companies and organizations, or regularly checking reputable industry news sources and publications.
Methodology
Step 1 - Identification of Relevant Samples Size from Population Database


Step 2 - Approaches for Defining Global Market Size (Value, Volume* & Price*)

Note*: In applicable scenarios
Step 3 - Data Sources
Primary Research
- Web Analytics
- Survey Reports
- Research Institute
- Latest Research Reports
- Opinion Leaders
Secondary Research
- Annual Reports
- White Paper
- Latest Press Release
- Industry Association
- Paid Database
- Investor Presentations

Step 4 - Data Triangulation
Involves using different sources of information in order to increase the validity of a study
These sources are likely to be stakeholders in a program - participants, other researchers, program staff, other community members, and so on.
Then we put all data in single framework & apply various statistical tools to find out the dynamic on the market.
During the analysis stage, feedback from the stakeholder groups would be compared to determine areas of agreement as well as areas of divergence