

Key Insights
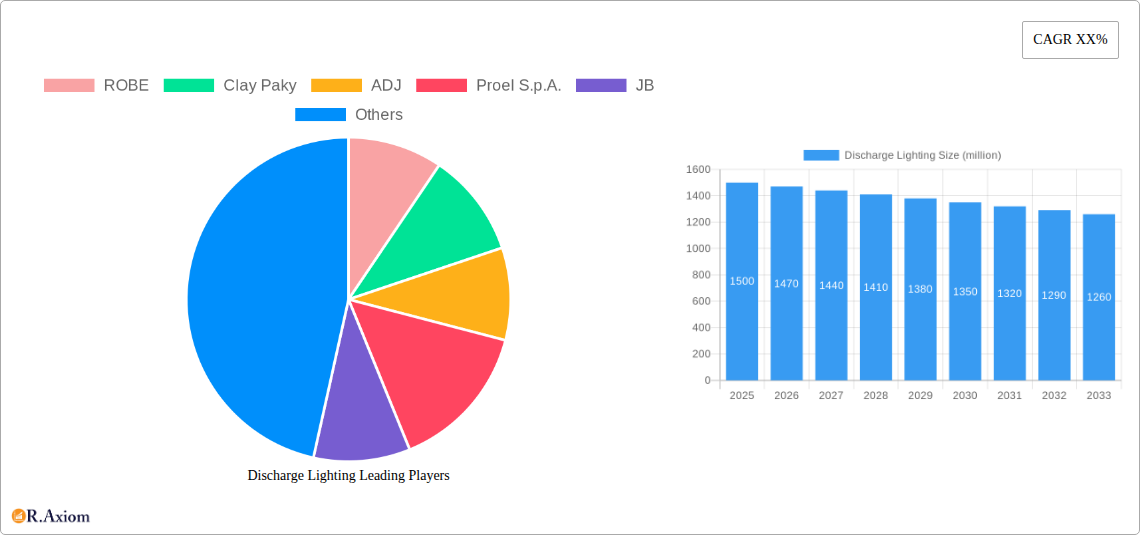
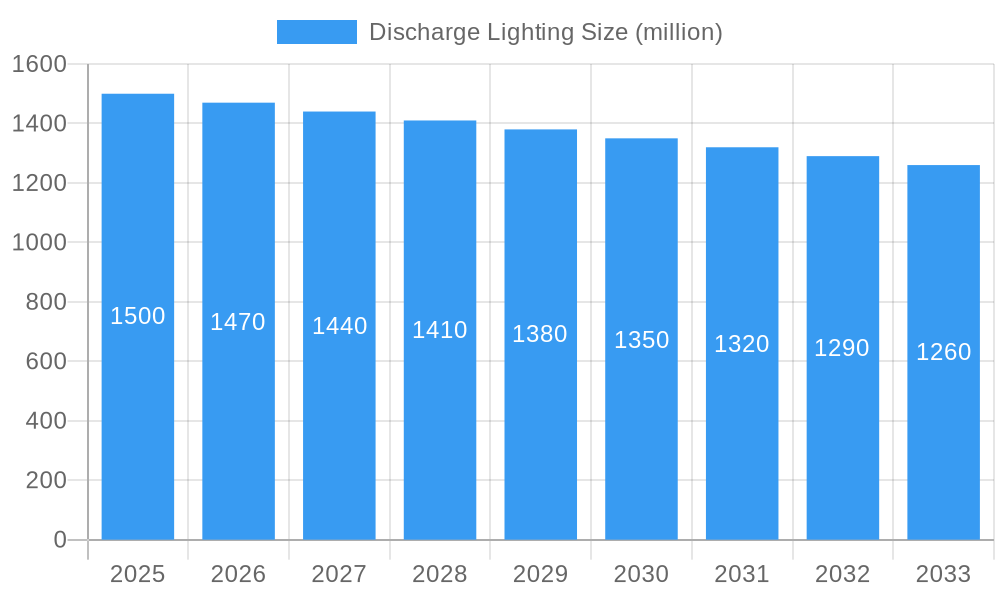
The discharge lighting market, encompassing technologies like high-intensity discharge (HID) and metal halide lamps, is experiencing a period of transition. While the market is mature, with a substantial historical presence, it faces challenges from the rapid advancements in LED lighting technology. This shift is driven by factors such as improved energy efficiency, longer lifespans, and enhanced color rendering capabilities offered by LEDs. Consequently, the market is experiencing a moderate decline in terms of overall revenue, estimated at a CAGR of -2% during the forecast period (2025-2033). However, niche applications within the professional lighting sector—such as high-power stage lighting and specialized industrial applications requiring high luminance—continue to sustain a degree of demand for discharge lighting. These applications leverage the unique characteristics of HID and metal halide lamps, such as superior color rendering and intensity, which remain unmatched by certain LED alternatives. The major players in this space, including Robe, Clay Paky, and others listed, are adapting their strategies, focusing on high-value, specialized solutions rather than competing directly with the mass market LED products.
Discharge Lighting Market Size (In Billion)
Despite the market contraction, certain regional variations exist. Regions with established infrastructure and industries reliant on high-intensity lighting may see a slower decline compared to regions rapidly adopting LED technologies. Furthermore, regulatory pressures aimed at improving energy efficiency continue to pressure the market. Although the overall market is declining, companies are innovating to maintain market share by concentrating on specialized applications, developing more energy-efficient discharge lamps, and focusing on sustainable disposal and recycling practices. This strategic pivot aims to extend the lifespan of discharge lighting technology in the long term, even if it remains a smaller segment of the overall lighting market. This market analysis is based on observable market trends and industry knowledge, avoiding speculative predictions.
Discharge Lighting Company Market Share
This comprehensive report provides an in-depth analysis of the global discharge lighting market, offering valuable insights for industry stakeholders, investors, and strategic decision-makers. Covering the period from 2019 to 2033, with a base year of 2025 and a forecast period of 2025-2033, this report meticulously examines market trends, technological advancements, competitive dynamics, and growth opportunities within this dynamic sector. The report analyzes a market valued at approximately $XX million in 2025, projecting substantial growth to reach $XX million by 2033.
Discharge Lighting Market Concentration & Innovation
This section analyzes the competitive landscape of the discharge lighting market, focusing on market concentration, innovation drivers, regulatory frameworks, product substitutes, end-user trends, and M&A activities. The market exhibits a moderately concentrated structure, with the top 10 players accounting for approximately 60% of the total market share in 2025.
- Market Share: ROBE holds an estimated 10% market share, followed by Clay Paky (8%), ADJ (7%), and Proel S.p.A (6%). The remaining market share is distributed among numerous smaller players.
- Innovation Drivers: The continuous demand for energy-efficient and high-performance lighting solutions fuels innovation. Technological advancements like improved lamp designs and control systems are key drivers.
- Regulatory Frameworks: Stringent environmental regulations regarding mercury content and energy efficiency are impacting market dynamics. Compliance costs and shifting regulatory landscapes represent both challenges and opportunities.
- Product Substitutes: The rise of LED lighting poses a significant challenge, impacting the market share of discharge lighting. However, niche applications continue to favor discharge lighting due to its specific properties.
- End-User Trends: The entertainment and professional lighting sectors remain key end-users, driving significant demand for high-intensity and specialized discharge lighting products.
- M&A Activities: Over the historical period (2019-2024), the market witnessed approximately 15 significant M&A deals, with a total estimated value of $XX million. These transactions primarily involved strategic acquisitions aimed at expanding product portfolios and market reach.
Discharge Lighting Industry Trends & Insights
The global discharge lighting market experienced a Compound Annual Growth Rate (CAGR) of approximately 3% during the historical period (2019-2024). While facing competition from LED technology, the market demonstrates resilience, driven by several key factors. Market penetration in niche applications remains high, largely due to the unique characteristics of discharge lighting such as high luminous efficacy and color rendering capabilities which are still favoured in certain professional lighting applications. Technological disruptions, primarily from LED technology, have driven a shift toward energy-efficient designs and smart lighting solutions. Consumer preferences are leaning towards high-quality, reliable lighting solutions with improved color consistency. The competitive dynamics are characterized by intense rivalry among established players and emerging entrants, fostering innovation and price competition.
Dominant Markets & Segments in Discharge Lighting
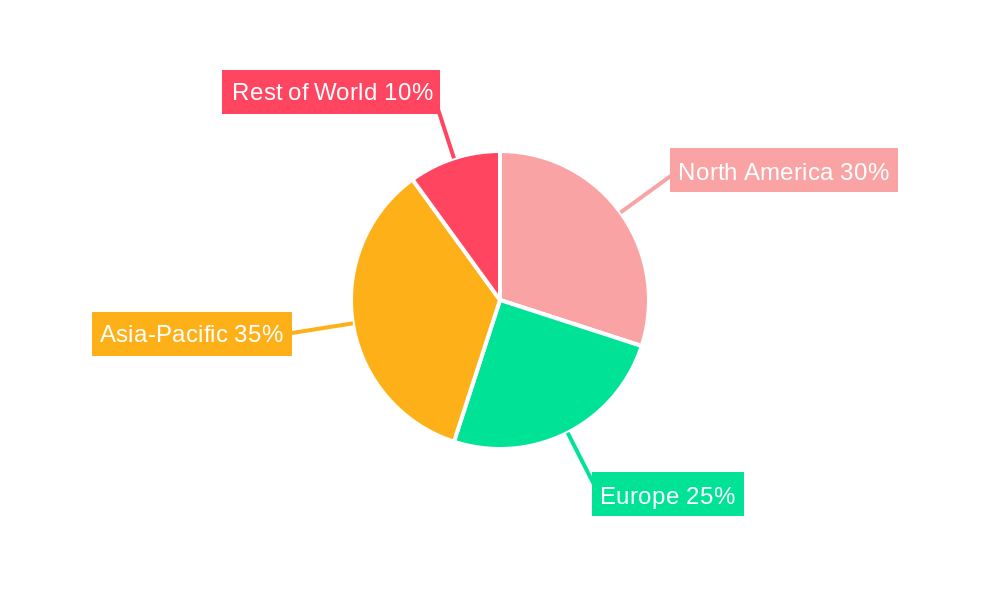
The North American market currently holds the leading position in the global discharge lighting market, followed by Europe and Asia-Pacific.
Key Drivers for North American Dominance:
- Strong presence of major lighting manufacturers.
- Well-established entertainment and professional lighting industries.
- Relatively high disposable income among consumers.
- Robust infrastructure supporting lighting installations.
Detailed Dominance Analysis: This region's dominance stems from a large established entertainment and professional lighting sector, along with robust infrastructure and a high level of disposable income driving premium product demand. However, growth in other regions such as Asia-Pacific is expected to increase due to increasing infrastructure development and a burgeoning entertainment sector. Europe, while showing strong performance, faces certain economic and regulatory complexities affecting overall market growth.
Discharge Lighting Product Developments
Recent product innovations focus on enhancing energy efficiency, color rendering, and control capabilities. New lamp designs and integrated control systems are improving overall performance and reducing operating costs. Technological trends center on advanced driver technology, compact designs, and compatibility with smart lighting systems. The market fit is strong for niche applications requiring high intensity, specific color properties, or long operational lifespans.
Report Scope & Segmentation Analysis
The report segments the discharge lighting market by various factors, including lamp type (high-pressure sodium, metal halide, high-pressure mercury), application (entertainment lighting, architectural lighting, industrial lighting), and geography. Each segment exhibits unique growth trajectories and competitive dynamics. The entertainment and professional lighting segments are expected to show high CAGR (xx%), whereas industrial and architectural lighting segments are projected to grow at moderate rates (xx%).
Key Drivers of Discharge Lighting Growth
Several factors are driving growth in the discharge lighting market. Technological advancements resulting in improved energy efficiency and lamp longevity are crucial. Growth in the entertainment and professional lighting sectors, along with increasing urbanization and infrastructure development, are also contributing significantly. Government initiatives promoting energy efficiency in lighting systems further fuel market expansion.
Challenges in the Discharge Lighting Sector
The primary challenge is competition from LED technology, impacting market share and revenue. Supply chain disruptions due to global events can also affect availability and costs. Stricter environmental regulations related to mercury disposal pose a regulatory hurdle, impacting production and disposal costs. The cumulative impact of these challenges on the discharge lighting market could potentially reduce revenue and increase production costs by an estimated xx% over the forecast period.
Emerging Opportunities in Discharge Lighting
Emerging opportunities include the growth of niche applications requiring high-intensity lighting and specialized color properties. The integration of smart lighting technologies and the development of sustainable disposal methods for mercury-containing lamps represent promising areas for innovation and growth. Focus on sustainable alternatives and improved recycling methods can also create new market opportunities.
Leading Players in the Discharge Lighting Market
- ROBE
- Clay Paky
- ADJ
- Proel S.p.A
- JB
- LYCIAN
- Robert juliat
- PR Lighting
- GOLDENSEA
- ACME
- Fineart
- NightSun
- GTD
- TOPLED
- Laiming
- Hi-Ltte
- Deliya
- Jinnaite
- Grandplan
- Light Sky
Key Developments in Discharge Lighting Industry
- January 2023: ROBE launched a new series of high-intensity discharge lamps with improved energy efficiency.
- March 2022: Clay Paky and ADJ announced a strategic partnership to expand their product portfolios.
- October 2021: New EU regulations regarding mercury content in discharge lamps came into effect. (Further examples required based on available data)
Strategic Outlook for Discharge Lighting Market
The discharge lighting market is poised for continued growth, driven by the sustained demand in niche applications where the unique properties of discharge lighting are essential. Focusing on innovation in energy efficiency, sustainable disposal methods, and the integration of smart technologies will be critical for future success. The market will continue to witness consolidation among players, leading to strategic alliances and acquisitions to enhance competitiveness. Exploring new markets and applications will be crucial for long-term growth.
Discharge Lighting Segmentation
-
1. Application
- 1.1. Entertainment Venues
- 1.2. Concerts
- 1.3. KTV
- 1.4. Bars
-
2. Types
- 2.1. Low Pressure Gas Discharge Lamp
- 2.2. High Pressure Discharge Lamp
- 2.3. Super High Pressure Gas Discharge Lamp
Discharge Lighting Segmentation By Geography
-
1. North America
- 1.1. United States
- 1.2. Canada
- 1.3. Mexico
-
2. South America
- 2.1. Brazil
- 2.2. Argentina
- 2.3. Rest of South America
-
3. Europe
- 3.1. United Kingdom
- 3.2. Germany
- 3.3. France
- 3.4. Italy
- 3.5. Spain
- 3.6. Russia
- 3.7. Benelux
- 3.8. Nordics
- 3.9. Rest of Europe
-
4. Middle East & Africa
- 4.1. Turkey
- 4.2. Israel
- 4.3. GCC
- 4.4. North Africa
- 4.5. South Africa
- 4.6. Rest of Middle East & Africa
-
5. Asia Pacific
- 5.1. China
- 5.2. India
- 5.3. Japan
- 5.4. South Korea
- 5.5. ASEAN
- 5.6. Oceania
- 5.7. Rest of Asia Pacific
Discharge Lighting Regional Market Share
Geographic Coverage of Discharge Lighting
Discharge Lighting REPORT HIGHLIGHTS
| Aspects | Details |
|---|---|
| Study Period | 2020-2034 |
| Base Year | 2025 |
| Estimated Year | 2026 |
| Forecast Period | 2026-2034 |
| Historical Period | 2020-2025 |
| Growth Rate | CAGR of XX% from 2020-2034 |
| Segmentation |
|
Table of Contents
- 1. Introduction
- 1.1. Research Scope
- 1.2. Market Segmentation
- 1.3. Research Objective
- 1.4. Definitions and Assumptions
- 2. Executive Summary
- 2.1. Market Snapshot
- 3. Market Dynamics
- 3.1. Market Drivers
- 3.2. Market Restrains
- 3.3. Market Trends
- 3.4. Market Opportunities
- 4. Market Factor Analysis
- 4.1. Porters Five Forces
- 4.1.1. Bargaining Power of Suppliers
- 4.1.2. Bargaining Power of Buyers
- 4.1.3. Threat of New Entrants
- 4.1.4. Threat of Substitutes
- 4.1.5. Competitive Rivalry
- 4.2. PESTEL analysis
- 4.3. BCG Analysis
- 4.3.1. Stars (High Growth, High Market Share)
- 4.3.2. Cash Cows (Low Growth, High Market Share)
- 4.3.3. Question Mark (High Growth, Low Market Share)
- 4.3.4. Dogs (Low Growth, Low Market Share)
- 4.4. Ansoff Matrix Analysis
- 4.5. Supply Chain Analysis
- 4.6. Regulatory Landscape
- 4.7. Current Market Potential and Opportunity Assessment (TAM–SAM–SOM Framework)
- 4.8. RAX Analyst Note
- 4.1. Porters Five Forces
- 5. Market Analysis, Insights and Forecast 2021-2033
- 5.1. Market Analysis, Insights and Forecast - by Application
- 5.1.1. Entertainment Venues
- 5.1.2. Concerts
- 5.1.3. KTV
- 5.1.4. Bars
- 5.2. Market Analysis, Insights and Forecast - by Types
- 5.2.1. Low Pressure Gas Discharge Lamp
- 5.2.2. High Pressure Discharge Lamp
- 5.2.3. Super High Pressure Gas Discharge Lamp
- 5.3. Market Analysis, Insights and Forecast - by Region
- 5.3.1. North America
- 5.3.2. South America
- 5.3.3. Europe
- 5.3.4. Middle East & Africa
- 5.3.5. Asia Pacific
- 5.1. Market Analysis, Insights and Forecast - by Application
- 6. Global Discharge Lighting Analysis, Insights and Forecast, 2021-2033
- 6.1. Market Analysis, Insights and Forecast - by Application
- 6.1.1. Entertainment Venues
- 6.1.2. Concerts
- 6.1.3. KTV
- 6.1.4. Bars
- 6.2. Market Analysis, Insights and Forecast - by Types
- 6.2.1. Low Pressure Gas Discharge Lamp
- 6.2.2. High Pressure Discharge Lamp
- 6.2.3. Super High Pressure Gas Discharge Lamp
- 6.1. Market Analysis, Insights and Forecast - by Application
- 7. North America Discharge Lighting Analysis, Insights and Forecast, 2020-2032
- 7.1. Market Analysis, Insights and Forecast - by Application
- 7.1.1. Entertainment Venues
- 7.1.2. Concerts
- 7.1.3. KTV
- 7.1.4. Bars
- 7.2. Market Analysis, Insights and Forecast - by Types
- 7.2.1. Low Pressure Gas Discharge Lamp
- 7.2.2. High Pressure Discharge Lamp
- 7.2.3. Super High Pressure Gas Discharge Lamp
- 7.1. Market Analysis, Insights and Forecast - by Application
- 8. South America Discharge Lighting Analysis, Insights and Forecast, 2020-2032
- 8.1. Market Analysis, Insights and Forecast - by Application
- 8.1.1. Entertainment Venues
- 8.1.2. Concerts
- 8.1.3. KTV
- 8.1.4. Bars
- 8.2. Market Analysis, Insights and Forecast - by Types
- 8.2.1. Low Pressure Gas Discharge Lamp
- 8.2.2. High Pressure Discharge Lamp
- 8.2.3. Super High Pressure Gas Discharge Lamp
- 8.1. Market Analysis, Insights and Forecast - by Application
- 9. Europe Discharge Lighting Analysis, Insights and Forecast, 2020-2032
- 9.1. Market Analysis, Insights and Forecast - by Application
- 9.1.1. Entertainment Venues
- 9.1.2. Concerts
- 9.1.3. KTV
- 9.1.4. Bars
- 9.2. Market Analysis, Insights and Forecast - by Types
- 9.2.1. Low Pressure Gas Discharge Lamp
- 9.2.2. High Pressure Discharge Lamp
- 9.2.3. Super High Pressure Gas Discharge Lamp
- 9.1. Market Analysis, Insights and Forecast - by Application
- 10. Middle East & Africa Discharge Lighting Analysis, Insights and Forecast, 2020-2032
- 10.1. Market Analysis, Insights and Forecast - by Application
- 10.1.1. Entertainment Venues
- 10.1.2. Concerts
- 10.1.3. KTV
- 10.1.4. Bars
- 10.2. Market Analysis, Insights and Forecast - by Types
- 10.2.1. Low Pressure Gas Discharge Lamp
- 10.2.2. High Pressure Discharge Lamp
- 10.2.3. Super High Pressure Gas Discharge Lamp
- 10.1. Market Analysis, Insights and Forecast - by Application
- 11. Asia Pacific Discharge Lighting Analysis, Insights and Forecast, 2020-2032
- 11.1. Market Analysis, Insights and Forecast - by Application
- 11.1.1. Entertainment Venues
- 11.1.2. Concerts
- 11.1.3. KTV
- 11.1.4. Bars
- 11.2. Market Analysis, Insights and Forecast - by Types
- 11.2.1. Low Pressure Gas Discharge Lamp
- 11.2.2. High Pressure Discharge Lamp
- 11.2.3. Super High Pressure Gas Discharge Lamp
- 11.1. Market Analysis, Insights and Forecast - by Application
- 12. Competitive Analysis
- 12.1. Company Profiles
- 12.1.1 ROBE
- 12.1.1.1. Company Overview
- 12.1.1.2. Products
- 12.1.1.3. Company Financials
- 12.1.1.4. SWOT Analysis
- 12.1.2 Clay Paky
- 12.1.2.1. Company Overview
- 12.1.2.2. Products
- 12.1.2.3. Company Financials
- 12.1.2.4. SWOT Analysis
- 12.1.3 ADJ
- 12.1.3.1. Company Overview
- 12.1.3.2. Products
- 12.1.3.3. Company Financials
- 12.1.3.4. SWOT Analysis
- 12.1.4 Proel S.p.A.
- 12.1.4.1. Company Overview
- 12.1.4.2. Products
- 12.1.4.3. Company Financials
- 12.1.4.4. SWOT Analysis
- 12.1.5 JB
- 12.1.5.1. Company Overview
- 12.1.5.2. Products
- 12.1.5.3. Company Financials
- 12.1.5.4. SWOT Analysis
- 12.1.6 LYCIAN
- 12.1.6.1. Company Overview
- 12.1.6.2. Products
- 12.1.6.3. Company Financials
- 12.1.6.4. SWOT Analysis
- 12.1.7 Robert juliat
- 12.1.7.1. Company Overview
- 12.1.7.2. Products
- 12.1.7.3. Company Financials
- 12.1.7.4. SWOT Analysis
- 12.1.8 PR Lighting
- 12.1.8.1. Company Overview
- 12.1.8.2. Products
- 12.1.8.3. Company Financials
- 12.1.8.4. SWOT Analysis
- 12.1.9 GOLDENSEA
- 12.1.9.1. Company Overview
- 12.1.9.2. Products
- 12.1.9.3. Company Financials
- 12.1.9.4. SWOT Analysis
- 12.1.10 ACME
- 12.1.10.1. Company Overview
- 12.1.10.2. Products
- 12.1.10.3. Company Financials
- 12.1.10.4. SWOT Analysis
- 12.1.11 Fineart
- 12.1.11.1. Company Overview
- 12.1.11.2. Products
- 12.1.11.3. Company Financials
- 12.1.11.4. SWOT Analysis
- 12.1.12 NightSun
- 12.1.12.1. Company Overview
- 12.1.12.2. Products
- 12.1.12.3. Company Financials
- 12.1.12.4. SWOT Analysis
- 12.1.13 GTD
- 12.1.13.1. Company Overview
- 12.1.13.2. Products
- 12.1.13.3. Company Financials
- 12.1.13.4. SWOT Analysis
- 12.1.14 TOPLED
- 12.1.14.1. Company Overview
- 12.1.14.2. Products
- 12.1.14.3. Company Financials
- 12.1.14.4. SWOT Analysis
- 12.1.15 Laiming
- 12.1.15.1. Company Overview
- 12.1.15.2. Products
- 12.1.15.3. Company Financials
- 12.1.15.4. SWOT Analysis
- 12.1.16 Hi-Ltte
- 12.1.16.1. Company Overview
- 12.1.16.2. Products
- 12.1.16.3. Company Financials
- 12.1.16.4. SWOT Analysis
- 12.1.17 Deliya
- 12.1.17.1. Company Overview
- 12.1.17.2. Products
- 12.1.17.3. Company Financials
- 12.1.17.4. SWOT Analysis
- 12.1.18 Jinnaite
- 12.1.18.1. Company Overview
- 12.1.18.2. Products
- 12.1.18.3. Company Financials
- 12.1.18.4. SWOT Analysis
- 12.1.19 Grandplan
- 12.1.19.1. Company Overview
- 12.1.19.2. Products
- 12.1.19.3. Company Financials
- 12.1.19.4. SWOT Analysis
- 12.1.20 Light Sky
- 12.1.20.1. Company Overview
- 12.1.20.2. Products
- 12.1.20.3. Company Financials
- 12.1.20.4. SWOT Analysis
- 12.1.1 ROBE
- 12.2. Market Entropy
- 12.2.1 Company's Key Areas Served
- 12.2.2 Recent Developments
- 12.3. Company Market Share Analysis 2025
- 12.3.1 Top 5 Companies Market Share Analysis
- 12.3.2 Top 3 Companies Market Share Analysis
- 12.4. List of Potential Customers
- 13. Research Methodology
List of Figures
- Figure 1: Global Discharge Lighting Revenue Breakdown (million, %) by Region 2025 & 2033
- Figure 2: Global Discharge Lighting Volume Breakdown (K, %) by Region 2025 & 2033
- Figure 3: North America Discharge Lighting Revenue (million), by Application 2025 & 2033
- Figure 4: North America Discharge Lighting Volume (K), by Application 2025 & 2033
- Figure 5: North America Discharge Lighting Revenue Share (%), by Application 2025 & 2033
- Figure 6: North America Discharge Lighting Volume Share (%), by Application 2025 & 2033
- Figure 7: North America Discharge Lighting Revenue (million), by Types 2025 & 2033
- Figure 8: North America Discharge Lighting Volume (K), by Types 2025 & 2033
- Figure 9: North America Discharge Lighting Revenue Share (%), by Types 2025 & 2033
- Figure 10: North America Discharge Lighting Volume Share (%), by Types 2025 & 2033
- Figure 11: North America Discharge Lighting Revenue (million), by Country 2025 & 2033
- Figure 12: North America Discharge Lighting Volume (K), by Country 2025 & 2033
- Figure 13: North America Discharge Lighting Revenue Share (%), by Country 2025 & 2033
- Figure 14: North America Discharge Lighting Volume Share (%), by Country 2025 & 2033
- Figure 15: South America Discharge Lighting Revenue (million), by Application 2025 & 2033
- Figure 16: South America Discharge Lighting Volume (K), by Application 2025 & 2033
- Figure 17: South America Discharge Lighting Revenue Share (%), by Application 2025 & 2033
- Figure 18: South America Discharge Lighting Volume Share (%), by Application 2025 & 2033
- Figure 19: South America Discharge Lighting Revenue (million), by Types 2025 & 2033
- Figure 20: South America Discharge Lighting Volume (K), by Types 2025 & 2033
- Figure 21: South America Discharge Lighting Revenue Share (%), by Types 2025 & 2033
- Figure 22: South America Discharge Lighting Volume Share (%), by Types 2025 & 2033
- Figure 23: South America Discharge Lighting Revenue (million), by Country 2025 & 2033
- Figure 24: South America Discharge Lighting Volume (K), by Country 2025 & 2033
- Figure 25: South America Discharge Lighting Revenue Share (%), by Country 2025 & 2033
- Figure 26: South America Discharge Lighting Volume Share (%), by Country 2025 & 2033
- Figure 27: Europe Discharge Lighting Revenue (million), by Application 2025 & 2033
- Figure 28: Europe Discharge Lighting Volume (K), by Application 2025 & 2033
- Figure 29: Europe Discharge Lighting Revenue Share (%), by Application 2025 & 2033
- Figure 30: Europe Discharge Lighting Volume Share (%), by Application 2025 & 2033
- Figure 31: Europe Discharge Lighting Revenue (million), by Types 2025 & 2033
- Figure 32: Europe Discharge Lighting Volume (K), by Types 2025 & 2033
- Figure 33: Europe Discharge Lighting Revenue Share (%), by Types 2025 & 2033
- Figure 34: Europe Discharge Lighting Volume Share (%), by Types 2025 & 2033
- Figure 35: Europe Discharge Lighting Revenue (million), by Country 2025 & 2033
- Figure 36: Europe Discharge Lighting Volume (K), by Country 2025 & 2033
- Figure 37: Europe Discharge Lighting Revenue Share (%), by Country 2025 & 2033
- Figure 38: Europe Discharge Lighting Volume Share (%), by Country 2025 & 2033
- Figure 39: Middle East & Africa Discharge Lighting Revenue (million), by Application 2025 & 2033
- Figure 40: Middle East & Africa Discharge Lighting Volume (K), by Application 2025 & 2033
- Figure 41: Middle East & Africa Discharge Lighting Revenue Share (%), by Application 2025 & 2033
- Figure 42: Middle East & Africa Discharge Lighting Volume Share (%), by Application 2025 & 2033
- Figure 43: Middle East & Africa Discharge Lighting Revenue (million), by Types 2025 & 2033
- Figure 44: Middle East & Africa Discharge Lighting Volume (K), by Types 2025 & 2033
- Figure 45: Middle East & Africa Discharge Lighting Revenue Share (%), by Types 2025 & 2033
- Figure 46: Middle East & Africa Discharge Lighting Volume Share (%), by Types 2025 & 2033
- Figure 47: Middle East & Africa Discharge Lighting Revenue (million), by Country 2025 & 2033
- Figure 48: Middle East & Africa Discharge Lighting Volume (K), by Country 2025 & 2033
- Figure 49: Middle East & Africa Discharge Lighting Revenue Share (%), by Country 2025 & 2033
- Figure 50: Middle East & Africa Discharge Lighting Volume Share (%), by Country 2025 & 2033
- Figure 51: Asia Pacific Discharge Lighting Revenue (million), by Application 2025 & 2033
- Figure 52: Asia Pacific Discharge Lighting Volume (K), by Application 2025 & 2033
- Figure 53: Asia Pacific Discharge Lighting Revenue Share (%), by Application 2025 & 2033
- Figure 54: Asia Pacific Discharge Lighting Volume Share (%), by Application 2025 & 2033
- Figure 55: Asia Pacific Discharge Lighting Revenue (million), by Types 2025 & 2033
- Figure 56: Asia Pacific Discharge Lighting Volume (K), by Types 2025 & 2033
- Figure 57: Asia Pacific Discharge Lighting Revenue Share (%), by Types 2025 & 2033
- Figure 58: Asia Pacific Discharge Lighting Volume Share (%), by Types 2025 & 2033
- Figure 59: Asia Pacific Discharge Lighting Revenue (million), by Country 2025 & 2033
- Figure 60: Asia Pacific Discharge Lighting Volume (K), by Country 2025 & 2033
- Figure 61: Asia Pacific Discharge Lighting Revenue Share (%), by Country 2025 & 2033
- Figure 62: Asia Pacific Discharge Lighting Volume Share (%), by Country 2025 & 2033
List of Tables
- Table 1: Global Discharge Lighting Revenue million Forecast, by Application 2020 & 2033
- Table 2: Global Discharge Lighting Volume K Forecast, by Application 2020 & 2033
- Table 3: Global Discharge Lighting Revenue million Forecast, by Types 2020 & 2033
- Table 4: Global Discharge Lighting Volume K Forecast, by Types 2020 & 2033
- Table 5: Global Discharge Lighting Revenue million Forecast, by Region 2020 & 2033
- Table 6: Global Discharge Lighting Volume K Forecast, by Region 2020 & 2033
- Table 7: Global Discharge Lighting Revenue million Forecast, by Application 2020 & 2033
- Table 8: Global Discharge Lighting Volume K Forecast, by Application 2020 & 2033
- Table 9: Global Discharge Lighting Revenue million Forecast, by Types 2020 & 2033
- Table 10: Global Discharge Lighting Volume K Forecast, by Types 2020 & 2033
- Table 11: Global Discharge Lighting Revenue million Forecast, by Country 2020 & 2033
- Table 12: Global Discharge Lighting Volume K Forecast, by Country 2020 & 2033
- Table 13: United States Discharge Lighting Revenue (million) Forecast, by Application 2020 & 2033
- Table 14: United States Discharge Lighting Volume (K) Forecast, by Application 2020 & 2033
- Table 15: Canada Discharge Lighting Revenue (million) Forecast, by Application 2020 & 2033
- Table 16: Canada Discharge Lighting Volume (K) Forecast, by Application 2020 & 2033
- Table 17: Mexico Discharge Lighting Revenue (million) Forecast, by Application 2020 & 2033
- Table 18: Mexico Discharge Lighting Volume (K) Forecast, by Application 2020 & 2033
- Table 19: Global Discharge Lighting Revenue million Forecast, by Application 2020 & 2033
- Table 20: Global Discharge Lighting Volume K Forecast, by Application 2020 & 2033
- Table 21: Global Discharge Lighting Revenue million Forecast, by Types 2020 & 2033
- Table 22: Global Discharge Lighting Volume K Forecast, by Types 2020 & 2033
- Table 23: Global Discharge Lighting Revenue million Forecast, by Country 2020 & 2033
- Table 24: Global Discharge Lighting Volume K Forecast, by Country 2020 & 2033
- Table 25: Brazil Discharge Lighting Revenue (million) Forecast, by Application 2020 & 2033
- Table 26: Brazil Discharge Lighting Volume (K) Forecast, by Application 2020 & 2033
- Table 27: Argentina Discharge Lighting Revenue (million) Forecast, by Application 2020 & 2033
- Table 28: Argentina Discharge Lighting Volume (K) Forecast, by Application 2020 & 2033
- Table 29: Rest of South America Discharge Lighting Revenue (million) Forecast, by Application 2020 & 2033
- Table 30: Rest of South America Discharge Lighting Volume (K) Forecast, by Application 2020 & 2033
- Table 31: Global Discharge Lighting Revenue million Forecast, by Application 2020 & 2033
- Table 32: Global Discharge Lighting Volume K Forecast, by Application 2020 & 2033
- Table 33: Global Discharge Lighting Revenue million Forecast, by Types 2020 & 2033
- Table 34: Global Discharge Lighting Volume K Forecast, by Types 2020 & 2033
- Table 35: Global Discharge Lighting Revenue million Forecast, by Country 2020 & 2033
- Table 36: Global Discharge Lighting Volume K Forecast, by Country 2020 & 2033
- Table 37: United Kingdom Discharge Lighting Revenue (million) Forecast, by Application 2020 & 2033
- Table 38: United Kingdom Discharge Lighting Volume (K) Forecast, by Application 2020 & 2033
- Table 39: Germany Discharge Lighting Revenue (million) Forecast, by Application 2020 & 2033
- Table 40: Germany Discharge Lighting Volume (K) Forecast, by Application 2020 & 2033
- Table 41: France Discharge Lighting Revenue (million) Forecast, by Application 2020 & 2033
- Table 42: France Discharge Lighting Volume (K) Forecast, by Application 2020 & 2033
- Table 43: Italy Discharge Lighting Revenue (million) Forecast, by Application 2020 & 2033
- Table 44: Italy Discharge Lighting Volume (K) Forecast, by Application 2020 & 2033
- Table 45: Spain Discharge Lighting Revenue (million) Forecast, by Application 2020 & 2033
- Table 46: Spain Discharge Lighting Volume (K) Forecast, by Application 2020 & 2033
- Table 47: Russia Discharge Lighting Revenue (million) Forecast, by Application 2020 & 2033
- Table 48: Russia Discharge Lighting Volume (K) Forecast, by Application 2020 & 2033
- Table 49: Benelux Discharge Lighting Revenue (million) Forecast, by Application 2020 & 2033
- Table 50: Benelux Discharge Lighting Volume (K) Forecast, by Application 2020 & 2033
- Table 51: Nordics Discharge Lighting Revenue (million) Forecast, by Application 2020 & 2033
- Table 52: Nordics Discharge Lighting Volume (K) Forecast, by Application 2020 & 2033
- Table 53: Rest of Europe Discharge Lighting Revenue (million) Forecast, by Application 2020 & 2033
- Table 54: Rest of Europe Discharge Lighting Volume (K) Forecast, by Application 2020 & 2033
- Table 55: Global Discharge Lighting Revenue million Forecast, by Application 2020 & 2033
- Table 56: Global Discharge Lighting Volume K Forecast, by Application 2020 & 2033
- Table 57: Global Discharge Lighting Revenue million Forecast, by Types 2020 & 2033
- Table 58: Global Discharge Lighting Volume K Forecast, by Types 2020 & 2033
- Table 59: Global Discharge Lighting Revenue million Forecast, by Country 2020 & 2033
- Table 60: Global Discharge Lighting Volume K Forecast, by Country 2020 & 2033
- Table 61: Turkey Discharge Lighting Revenue (million) Forecast, by Application 2020 & 2033
- Table 62: Turkey Discharge Lighting Volume (K) Forecast, by Application 2020 & 2033
- Table 63: Israel Discharge Lighting Revenue (million) Forecast, by Application 2020 & 2033
- Table 64: Israel Discharge Lighting Volume (K) Forecast, by Application 2020 & 2033
- Table 65: GCC Discharge Lighting Revenue (million) Forecast, by Application 2020 & 2033
- Table 66: GCC Discharge Lighting Volume (K) Forecast, by Application 2020 & 2033
- Table 67: North Africa Discharge Lighting Revenue (million) Forecast, by Application 2020 & 2033
- Table 68: North Africa Discharge Lighting Volume (K) Forecast, by Application 2020 & 2033
- Table 69: South Africa Discharge Lighting Revenue (million) Forecast, by Application 2020 & 2033
- Table 70: South Africa Discharge Lighting Volume (K) Forecast, by Application 2020 & 2033
- Table 71: Rest of Middle East & Africa Discharge Lighting Revenue (million) Forecast, by Application 2020 & 2033
- Table 72: Rest of Middle East & Africa Discharge Lighting Volume (K) Forecast, by Application 2020 & 2033
- Table 73: Global Discharge Lighting Revenue million Forecast, by Application 2020 & 2033
- Table 74: Global Discharge Lighting Volume K Forecast, by Application 2020 & 2033
- Table 75: Global Discharge Lighting Revenue million Forecast, by Types 2020 & 2033
- Table 76: Global Discharge Lighting Volume K Forecast, by Types 2020 & 2033
- Table 77: Global Discharge Lighting Revenue million Forecast, by Country 2020 & 2033
- Table 78: Global Discharge Lighting Volume K Forecast, by Country 2020 & 2033
- Table 79: China Discharge Lighting Revenue (million) Forecast, by Application 2020 & 2033
- Table 80: China Discharge Lighting Volume (K) Forecast, by Application 2020 & 2033
- Table 81: India Discharge Lighting Revenue (million) Forecast, by Application 2020 & 2033
- Table 82: India Discharge Lighting Volume (K) Forecast, by Application 2020 & 2033
- Table 83: Japan Discharge Lighting Revenue (million) Forecast, by Application 2020 & 2033
- Table 84: Japan Discharge Lighting Volume (K) Forecast, by Application 2020 & 2033
- Table 85: South Korea Discharge Lighting Revenue (million) Forecast, by Application 2020 & 2033
- Table 86: South Korea Discharge Lighting Volume (K) Forecast, by Application 2020 & 2033
- Table 87: ASEAN Discharge Lighting Revenue (million) Forecast, by Application 2020 & 2033
- Table 88: ASEAN Discharge Lighting Volume (K) Forecast, by Application 2020 & 2033
- Table 89: Oceania Discharge Lighting Revenue (million) Forecast, by Application 2020 & 2033
- Table 90: Oceania Discharge Lighting Volume (K) Forecast, by Application 2020 & 2033
- Table 91: Rest of Asia Pacific Discharge Lighting Revenue (million) Forecast, by Application 2020 & 2033
- Table 92: Rest of Asia Pacific Discharge Lighting Volume (K) Forecast, by Application 2020 & 2033
Frequently Asked Questions
1. What is the projected Compound Annual Growth Rate (CAGR) of the Discharge Lighting?
The projected CAGR is approximately XX%.
2. Which companies are prominent players in the Discharge Lighting?
Key companies in the market include ROBE, Clay Paky, ADJ, Proel S.p.A., JB, LYCIAN, Robert juliat, PR Lighting, GOLDENSEA, ACME, Fineart, NightSun, GTD, TOPLED, Laiming, Hi-Ltte, Deliya, Jinnaite, Grandplan, Light Sky.
3. What are the main segments of the Discharge Lighting?
The market segments include Application, Types.
4. Can you provide details about the market size?
The market size is estimated to be USD XXX million as of 2022.
5. What are some drivers contributing to market growth?
N/A
6. What are the notable trends driving market growth?
N/A
7. Are there any restraints impacting market growth?
N/A
8. Can you provide examples of recent developments in the market?
N/A
9. What pricing options are available for accessing the report?
Pricing options include single-user, multi-user, and enterprise licenses priced at USD 3350.00, USD 5025.00, and USD 6700.00 respectively.
10. Is the market size provided in terms of value or volume?
The market size is provided in terms of value, measured in million and volume, measured in K.
11. Are there any specific market keywords associated with the report?
Yes, the market keyword associated with the report is "Discharge Lighting," which aids in identifying and referencing the specific market segment covered.
12. How do I determine which pricing option suits my needs best?
The pricing options vary based on user requirements and access needs. Individual users may opt for single-user licenses, while businesses requiring broader access may choose multi-user or enterprise licenses for cost-effective access to the report.
13. Are there any additional resources or data provided in the Discharge Lighting report?
While the report offers comprehensive insights, it's advisable to review the specific contents or supplementary materials provided to ascertain if additional resources or data are available.
14. How can I stay updated on further developments or reports in the Discharge Lighting?
To stay informed about further developments, trends, and reports in the Discharge Lighting, consider subscribing to industry newsletters, following relevant companies and organizations, or regularly checking reputable industry news sources and publications.
Methodology
Step 1 - Identification of Relevant Samples Size from Population Database


Step 2 - Approaches for Defining Global Market Size (Value, Volume* & Price*)

Note*: In applicable scenarios
Step 3 - Data Sources
Primary Research
- Web Analytics
- Survey Reports
- Research Institute
- Latest Research Reports
- Opinion Leaders
Secondary Research
- Annual Reports
- White Paper
- Latest Press Release
- Industry Association
- Paid Database
- Investor Presentations

Step 4 - Data Triangulation
Involves using different sources of information in order to increase the validity of a study
These sources are likely to be stakeholders in a program - participants, other researchers, program staff, other community members, and so on.
Then we put all data in single framework & apply various statistical tools to find out the dynamic on the market.
During the analysis stage, feedback from the stakeholder groups would be compared to determine areas of agreement as well as areas of divergence